DOI:
10.1039/C7RA08645H
(Paper)
RSC Adv., 2017,
7, 49455-49462
Microfluidic fabrication of hollow protein microcapsules for rate-controlled release†
Received
4th August 2017
, Accepted 16th October 2017
First published on 24th October 2017
Abstract
Droplet-based microfluidics is an emerging technique that is capable of producing sophisticated supramolecular microcapsules in one step. However, food materials, due to their physical and chemical complexity, have limited success with microfluidic processes. The objectives of this work were to produce food-grade protein microcapsules in a microfluidic system and to control their structural properties by adjusting the formulation and flow rates. In this study, a T-junction microfluidic chip was used to create an interface for zein to self-assemble, and therefore form microcapsules with tunable particle sizes, pore distributions, and permeabilities. Our SEM and CLSM results show that the particle size and number of pores increased with the flow rate of the dispersing phase, while the pore size decreased with the flow rate of the dispersing phase. In order to quantify the release profiles, the release half-life (t50) was used as an indicator for the particle permeability. A wide range of t50, from 3 to 62 minutes, was achieved by changing the zein concentration and flow rate of the dispersing phase. Using Rhodamine B as an encapsulant, the release rate was positively correlated with the zein concentration and flow rate of the dispersing phase. Finally, response surface analysis of the formulation and flow rate was applied to aid the design of a carrier with a desirable release rate.
Introduction
The fabrication of microcapsules as carriers for stabilizing and delivering core materials has been extensively studied and widely applied in the biomedical, food, cosmetic and agricultural industries and many other industries.1,2 Recently, controlling the release profile of core materials from microcapsules has been gaining increasing attention, and one of the most well-known approaches is to use colloidosomes. Colloidosomes are microcapsules whose shells consist of densely packed colloidal particles as building blocks.3–5 The primary features of colloidosomes include the integrity of the microcapsules during release, their controllable permeability, stimulus-triggering ability and physical stability, which make colloidosomes desirable for releasing pharmaceuticals, bioactive compounds, and fragrances in a controlled manner.4,6 The conventional approaches to assembling colloidosomes possess several limitations such as complexity, low-efficiency, lack of uniformity, and the requirement for toxic solvents during the process.3,4 Therefore, it is of great interest to develop an alternative strategy that is simple and environmentally friendly while still featuring similar advantages such as a controllable release rate.
Droplet-based microfluidic platforms are an emerging technique that have become a topic of interest for analytical (e.g. cell analysis, DNA assays and high-throughput screening)7 and synthetic (e.g. encapsulation, polymerization and anti-solvent nanoparticle fabrication)8–10 applications. For encapsulation applications, microfluidic platforms provide precise particle size control over a wide range, which is vital for ensuring product homogeneity.8 Microfluidic platforms have been reported for single-step processes for fabricating many sophisticated supramolecular microcapsules, for example, non-spherical particles,11 porous microcapsules,12 alginate microspheres,13 dendritic microcapsules,14 cross-linked protein capsules15 and biological microgels.16 Microfluidic chips have also been deployed to trigger precisely controlled interfacial reactions for fabricating complex and multiple emulsions.17,18 However, most of these approaches require crosslinking agents, UV treatment, and polymer precursors, which may be toxic and potentially cytotoxic. These limitations are especially unfavorable for encapsulating live cells, as well as sensitive pharmaceuticals and nutraceuticals.8 Furthermore, there have been very few successes in using biological materials such as proteins in microfluidic processes as they could be prone to clogging the microfluidic channels.
Zein is a storage protein from corn that is insoluble in water but capable of self-assembling to form many types of microstructure such as films,19 nanoparticles20,21 or Pickering emulsions.22 Its distinct amino acid composition and rigidity in the solid state make it a potential food-grade wall material for fabricating diffusion-driven controlled-release systems. To date, self-assembly of zein could only be achieved in an uncontrolled or limited control manner (e.g., evaporation induced self-assembly23 or anti-solvent self-assembly24). However, recent advances have made it possible to direct particle assembly using microfluidic platforms.25 Many studies have explored the application of zein as a delivery carrier, although several limitations have been reported as well.26–28 One inherent limitation is that current zein-based delivery systems, in which encapsulation is achieved during a co-precipitation of zein and the encapsulant in water, are only able to carry hydrophobic compounds. Therefore, the encapsulant has to be insoluble in water but soluble in 60–90% ethanol. The second limitation is associated with particle size control in that only submicron (100–300 nm) zein nanoparticles are able to be generated.24 Small particles generally release encapsulated compounds rapidly due to their high surface-to-volume ratios and instant particle disintegration in the gastro-intestinal (GI) tract, thus they are not feasible for sustained release.29 In this study we report a facile method to fabricate hollow microcapsules with tunable release rates using a food-grade protein, zein. To the author’s knowledge, this is the first approach creating an interface to direct zein self-assembly and form a rigid shell. A water-soluble dye, Rhodamine B, was used as a tracer to indicate the permeability of the microcapsule and analyze the release rate.
Experimental
Materials
Zein (Z3625, Sigma-Aldrich, St. Louis, MO) dissolved in 70% (v/v) ethanol (200 Proof, Decon Laboratories, King of Prussia, PA) was used as the dispersing phase. Tributyrin (W222305, Sigma-Aldrich, St. Louis, MO) containing 2% (w/v) soy lecithin (MP Biomedicals Inc, Solon, OH) was used as the continuous phase. Rhodamine B (R6626, Sigma-Aldrich, St. Louis, MO) was added into the dispersing phase at 2 mg ml−1 to assess the rate of release. Hexane (Macron Fine Chemicals, Center Valley, PA) was used to wash the microcapsules. No. 42 (pore size 2.5 μm) Whatman filter paper (Whatman Inc., Florham Park, NJ) was used to collect the final products.
Microfluidic fabrication
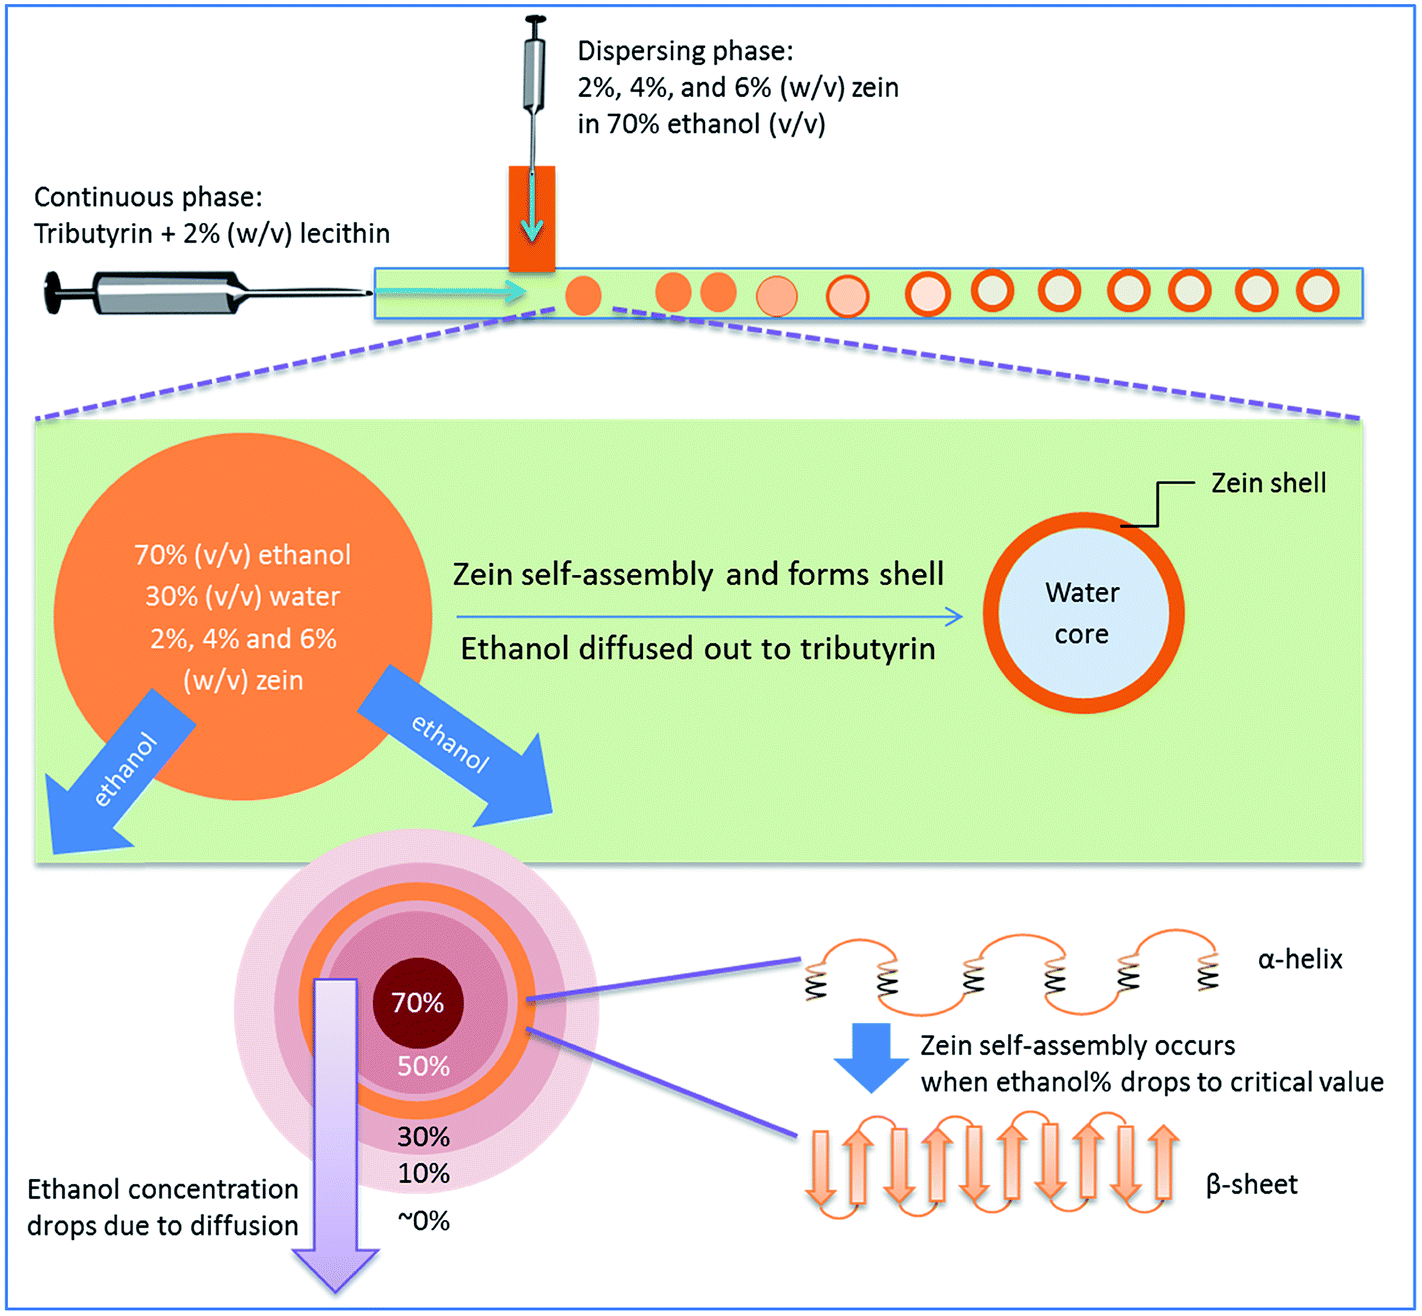
The dispersing phase was prepared by dissolving various amounts (2%, 4% and 6% w/v) of zein into an ethanol–water binary system containing 70% (v/v) ethanol. The continuous phase was prepared by mixing 2% (w/v) of soy lecithin with tributyrin by stirring at 250 rpm overnight, followed by centrifugation at 2000 g for 10 min to remove impurities. Hollow zein microcapsules were then produced in a 100 μm T-junction microfluidic chip (Dolomite, UK) through internal phase separation and the mechanism is shown in Fig. 1. The samples prepared in this study are listed in Table 1. Three flow rate combinations were chosen for this study based on our preliminary study. Flow rates were controlled using a Harvard Model 11 Elite syringe pump (Harvard Apparatus Inc., Holliston, MA). An amount of 2 mg ml−1 of Rhodamine B (Sigma-Aldrich, St. Louis, MO) was added into the dispersing phase as a release model indicator. Once collected, the capsules were immediately washed with hexane three times on a filter paper under vacuum. The final microcapsules were obtained by transferring the filtered samples into a convective oven at 30 °C for 6 hours to remove the excess water.
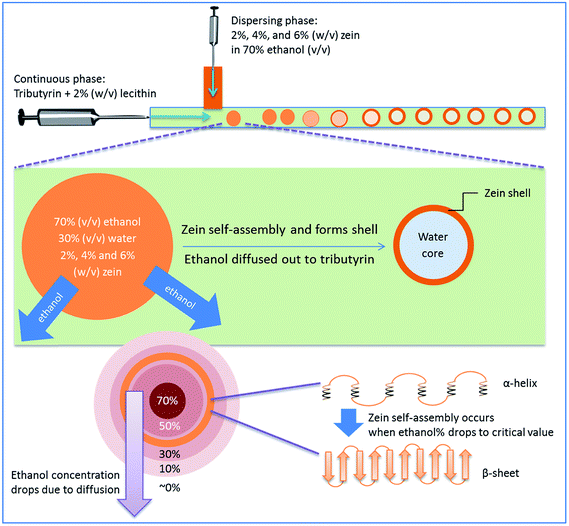 |
| | Fig. 1 A schematic diagram illustrating the mechanism of the formation of the hollow zein microcapsule in a microfluidic chip. An oil–water interface is created to initiate zein self-assembly followed by internal phase separation. | |
Table 1 Summary of the sample codes and formulations
| Sample no. |
Zein% (w/v) |
Dispersing phase flow rate (ml h−1) |
Continuous phase flow rate (ml h−1) |
Flow rate ratios (continuous/dispersing) |
Rhodamine B (mg ml−1) |
pH |
| 1 |
2% |
0.1 |
10 |
100 |
2 |
3.0 |
| 2 |
2% |
0.2 |
10 |
50 |
2 |
3.0 |
| 3 |
2% |
0.3 |
10 |
33.3 |
2 |
3.0 |
| 4 |
4% |
0.1 |
10 |
100 |
2 |
3.0 |
| 5 |
4% |
0.2 |
10 |
50 |
2 |
3.0 |
| 6 |
4% |
0.3 |
10 |
33.3 |
2 |
3.0 |
| 7 |
6% |
0.1 |
10 |
100 |
2 |
3.0 |
| 8 |
6% |
0.2 |
10 |
50 |
2 |
3.0 |
| 9 |
6% |
0.3 |
10 |
33.3 |
2 |
3.0 |
Characterization of microcapsules
Scanning electron microscopy (SEM). The surface morphology of the final products was imaged using a Quanta 450 FEG environmental scanning electron microscope (ESEM, FEI Company, Hillsboro, OR) located at the Beckman Institute. The blocks were mounted on SEM stubs and coated with 60 nm of gold–palladium using a Desk-II turbo sputter coater (Denton Vacuum, Moorestown, NJ). Flash-dry colloidal silver paint (cat. no. 04998-AB; SPI Supplies, West Chester PA) was applied to the blocks to ensure proper grounding. The embedded particles were then imaged using a Quanta 450 FEG environmental scanning electron microscope (ESEM; FEI Company, Hillsboro, OR). Image analysis was then performed using Image-Pro Plus 7.0 software (Media Cybernetics, MD, USA) to calculate the particle size of each sample.
Confocal laser scanning microscopy (CLSM). CLSM was used to visualize the internal structure of the microcapsules. Freshly collected microcapsule suspensions (1 ml) were stained with 40 μl of Nile blue (0.1%) for 2 h. A Zeiss LSM 700 confocal microscope (Zeiss, Germany) was operated using an excitation wavelength of 488 nm for the Nile blue dye to visualize the emulsions. Images were taken at a magnification of 20× and further processed using the instrumental software.
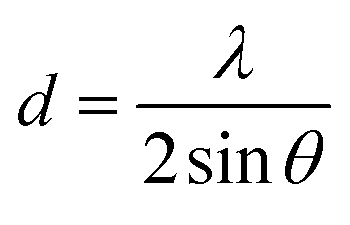
X-ray diffraction (XRD). XRD patterns were assessed using a diffractometer (D5000, Siemens) with Cu-Kα radiation (λ = 1.5406 Å) and a 0.2° step scan from 5 to 35° in 2θ angles. The scanning rate was set at 1° min−1. The d-spacing for a given scattering angle, 2θ, was calculated using Bragg’s law (1).| |
 | (1) |
where λ is the wavelength of the Cu-Kα radiation.
Circular dichroism spectroscopy (CD). The CD spectra were recorded with a JASCO J-715 spectropolarimeter (Jasco Inc., Easton, MD). Samples were placed in a quartz cell with a 1 cm path length. The measurements were conducted over the range of 200–250 nm at 25 °C, with a scanning speed of 50 nm min−1, and a resolution of 1 nm. The α-helix, β-sheet, and random coil content was calculated using the BeStSel software,30 which can be accessed online at http://bestsel.elte.hu. The Savitsky–Golay smoothing algorithm was used, with a polynomial order of 3 and a smoothing window of 20 points, according to the literature.31
Release profiles
Release curves. To study the release profile, approximately 5 mg of microcapsules was dispersed in 50 ml of deionized (DI) water with constant stirring at 250 rpm to release the water-soluble dye, Rhodamine B. In total, twelve measurements were taken at 1, 3, 5, 10, 20, 30, 45, 60, 120, 180, 360, and 1440 min, respectively, to evaluate the rate of release by measuring the dye concentration in water. For each measurement, 0.5 ml of the dispersion was removed using a 3 ml disposable syringe (Exelint International Co., Los Angeles, CA), and the aliquot was then filtered using a 4 mm syringe filter with pore size 0.45 μm (Restek Corp., Bellefonte, PA), to avoid potential contamination by the microcapsules. An equivalent volume of DI water was supplemented32 upon the removal of the sample. The fluorescence intensity of the aliquot was measured using a SpectraMax M2e microplate reader (Molecular Devices, Sunnyvale, CA) in triplicate. The excitation wavelength and emission wavelength were set at 420 nm and 565 nm, respectively.33 The fraction of cumulative release versus time was normalized and plotted with the assumption that complete release is achieved at 24 hours.
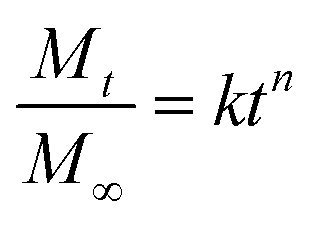
Release curve fitting and release half-lives (t50). To analyze the release kinetics, the Korsmeyer–Peppas model was used to fit the release curve (0 ≤ y ≤ 0.6)34 using Matlab software R2014a (The Mathworks Inc., Natick, MA), and the fitting equation is shown below as eqn (2).| |
 | (2) |
where Mt/M∞ is the fractional release of Rhodamine B, t is the release time, k is a kinetic constant characteristic, and n is an exponent which characterizes the mechanism of release of the tracer. The release half-lives (t50) were then derived from the fitting equation. The variation of the release half-lives with the processing conditions was subjected to statistical analysis using a response surface methodology by Matlab.
Results and discussion
Mechanisms of microcapsule formation
Fig. 1 is a schematic diagram displaying the formation of hollow zein microcapsules in a T-junction microfluidic chip. A 70% (v/v) ethanol solution containing zein and Rhodamine B was introduced to the microfluidic channel as the dispersing phase, and the continuous phase was composed of tributyrin containing 2% (w/v) soy lecithin as an emulsifier. Upon mixing at the joint, a jetting regime was observed where the dispersing phase maintained parallel flow before breaking up into droplets within the flow rates tested in this study. The formation of different regimes is determined by two competing forces: the viscous dragging force and surface tension.35,36 Herein, we used the jetting regime to generate particles considering its high yield and decreased risk of clogging at the expense of losing a certain degree of monodispersity in the particle size compared to that of the dripping regime.
Ethanol in the dispersing phase is miscible with tributyrin in the continuous phase, while water is not. In this study, the flow rate of the continuous phase was much higher (more than 30 times higher) than the flow rate of the dispersing phase, such that the ethanol in the dispersing phase would constantly diffuse into the continuous phase due to the concentration gradient. Once the dispersing droplets dispatch from the parallel flow, a greater interface area is created which further accelerates ethanol migration. At the same time, zein self-assembly is triggered by the continuous decrease in ethanol concentration inside the droplet. The formation of walls starts at the droplet interface, where the ethanol concentration is lower than that in the center of the droplet because of the ethanol flux. Eventually, the liquid remaining in the droplet will be mostly water, and zein becomes solid as the wall material. The self-assembly of zein is a complex process, which involves a transformation from α-helices to β-sheets, followed by side-by-side packing of the β-sheets to form a rigid structure.23 Typically, this process is induced by evaporation of ethanol to produce a film structure. In this work, an oil–water interface was created to direct zein self-assembly in droplet microfluidic chips. The self-assembly in the internal phase separation process was verified by CD spectroscopy and XRD analysis. The CD spectra presented in Fig. 2 compare the secondary structures of raw zein and microfluidic-treated zein, using sample 5 as an example. Diminishment of the α-helix structure and formation of the β-sheet structure were observed, which indicates that self-assembly of zein could occur in a short time, on the scale of a few seconds. Secondary structure is an important property for the microcapsules, and it might also affect the release profiles, though no studies have been reported yet. In terms of the secondary structure formation of zein, it is highly related to the residence time of zein self-assembly. Typically the time needed to make a difference for zein is in the scale of hours.23 However, the residence time of microfluidic processes is short, usually in the scale of seconds. So similar secondary structures between the particles were expected in this study. In order to verify this, three samples with different zein concentrations and dispersing phase flow rates were selected to analyse their CD spectra. As expected, the differences between their secondary structures were minor. More details can be found in the ESI.†
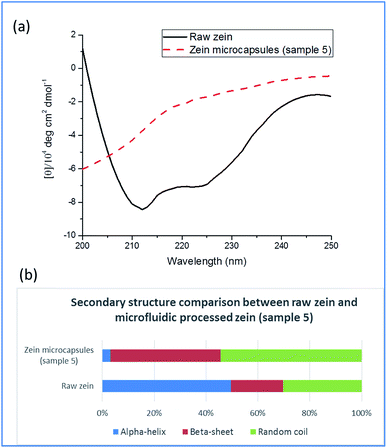 |
| | Fig. 2 (a) CD spectra of raw zein and zein microcapsules. (b) The secondary protein structure of raw zein and zein microcapsules. | |
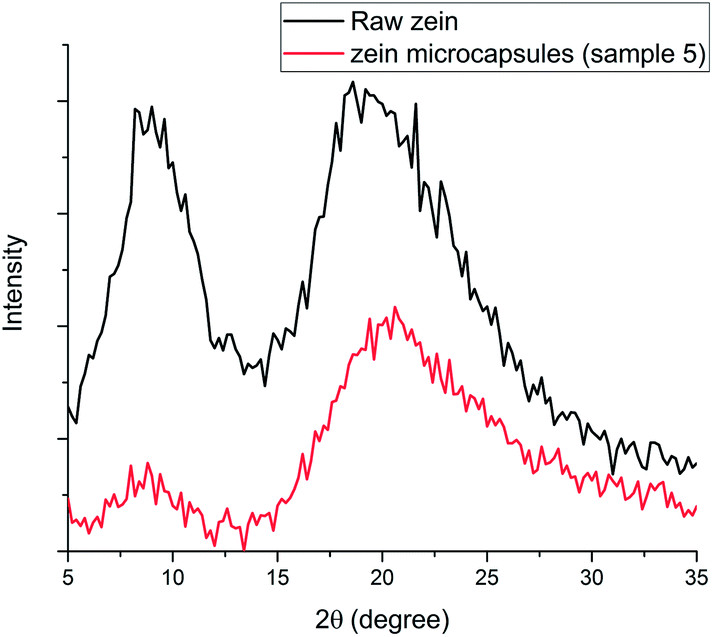
The XRD patterns shown in Fig. 3 also compared the structures of the raw zein and zein microcapsules (sample 5). For both samples, there are two distinctive peaks exhibited at the same 2θ angles, which are close to 9° and 21°. Based on the d-spacing eqn (1), the characteristic d-spacing values could be calculated as 9.8 Å and 4.2 Å, respectively. According to the literature, these two characteristic d-spacing values have been clearly interpreted. The smaller d-spacing (4.2 Å) is related to the backbone distance within the α-helix, whereas the longer d-spacing (9.8 Å) comes from the lateral α-helix packing.37 The ratio between these two peaks is an indication of the degree of α-helix packing.37,38 Physical and chemical changes, such as thermal treatment and anti-solvent processes like that in this study, could induce secondary structural transformation. One notable and common transition is the helix-to-coil transition,39 which we also found in this study. Since the unwinding of α-helices is a necessary step in helix-to-coil transition, the peak ratio evolution before and after microfluidic treatment is therefore an important sign of helix-to-coil transition and secondary structural transformation. In this study, it was found that the lateral α-helix packing structure decreased in the zein microcapsules, indicating the occurrence of structural transformation (Fig. 3).
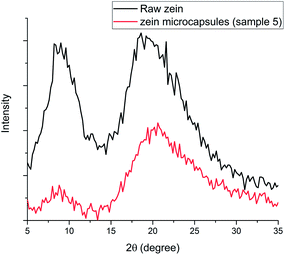 |
| | Fig. 3 XRD patterns of raw zein and zein microcapsules. | |
Morphology and internal structures of zein microcapsules
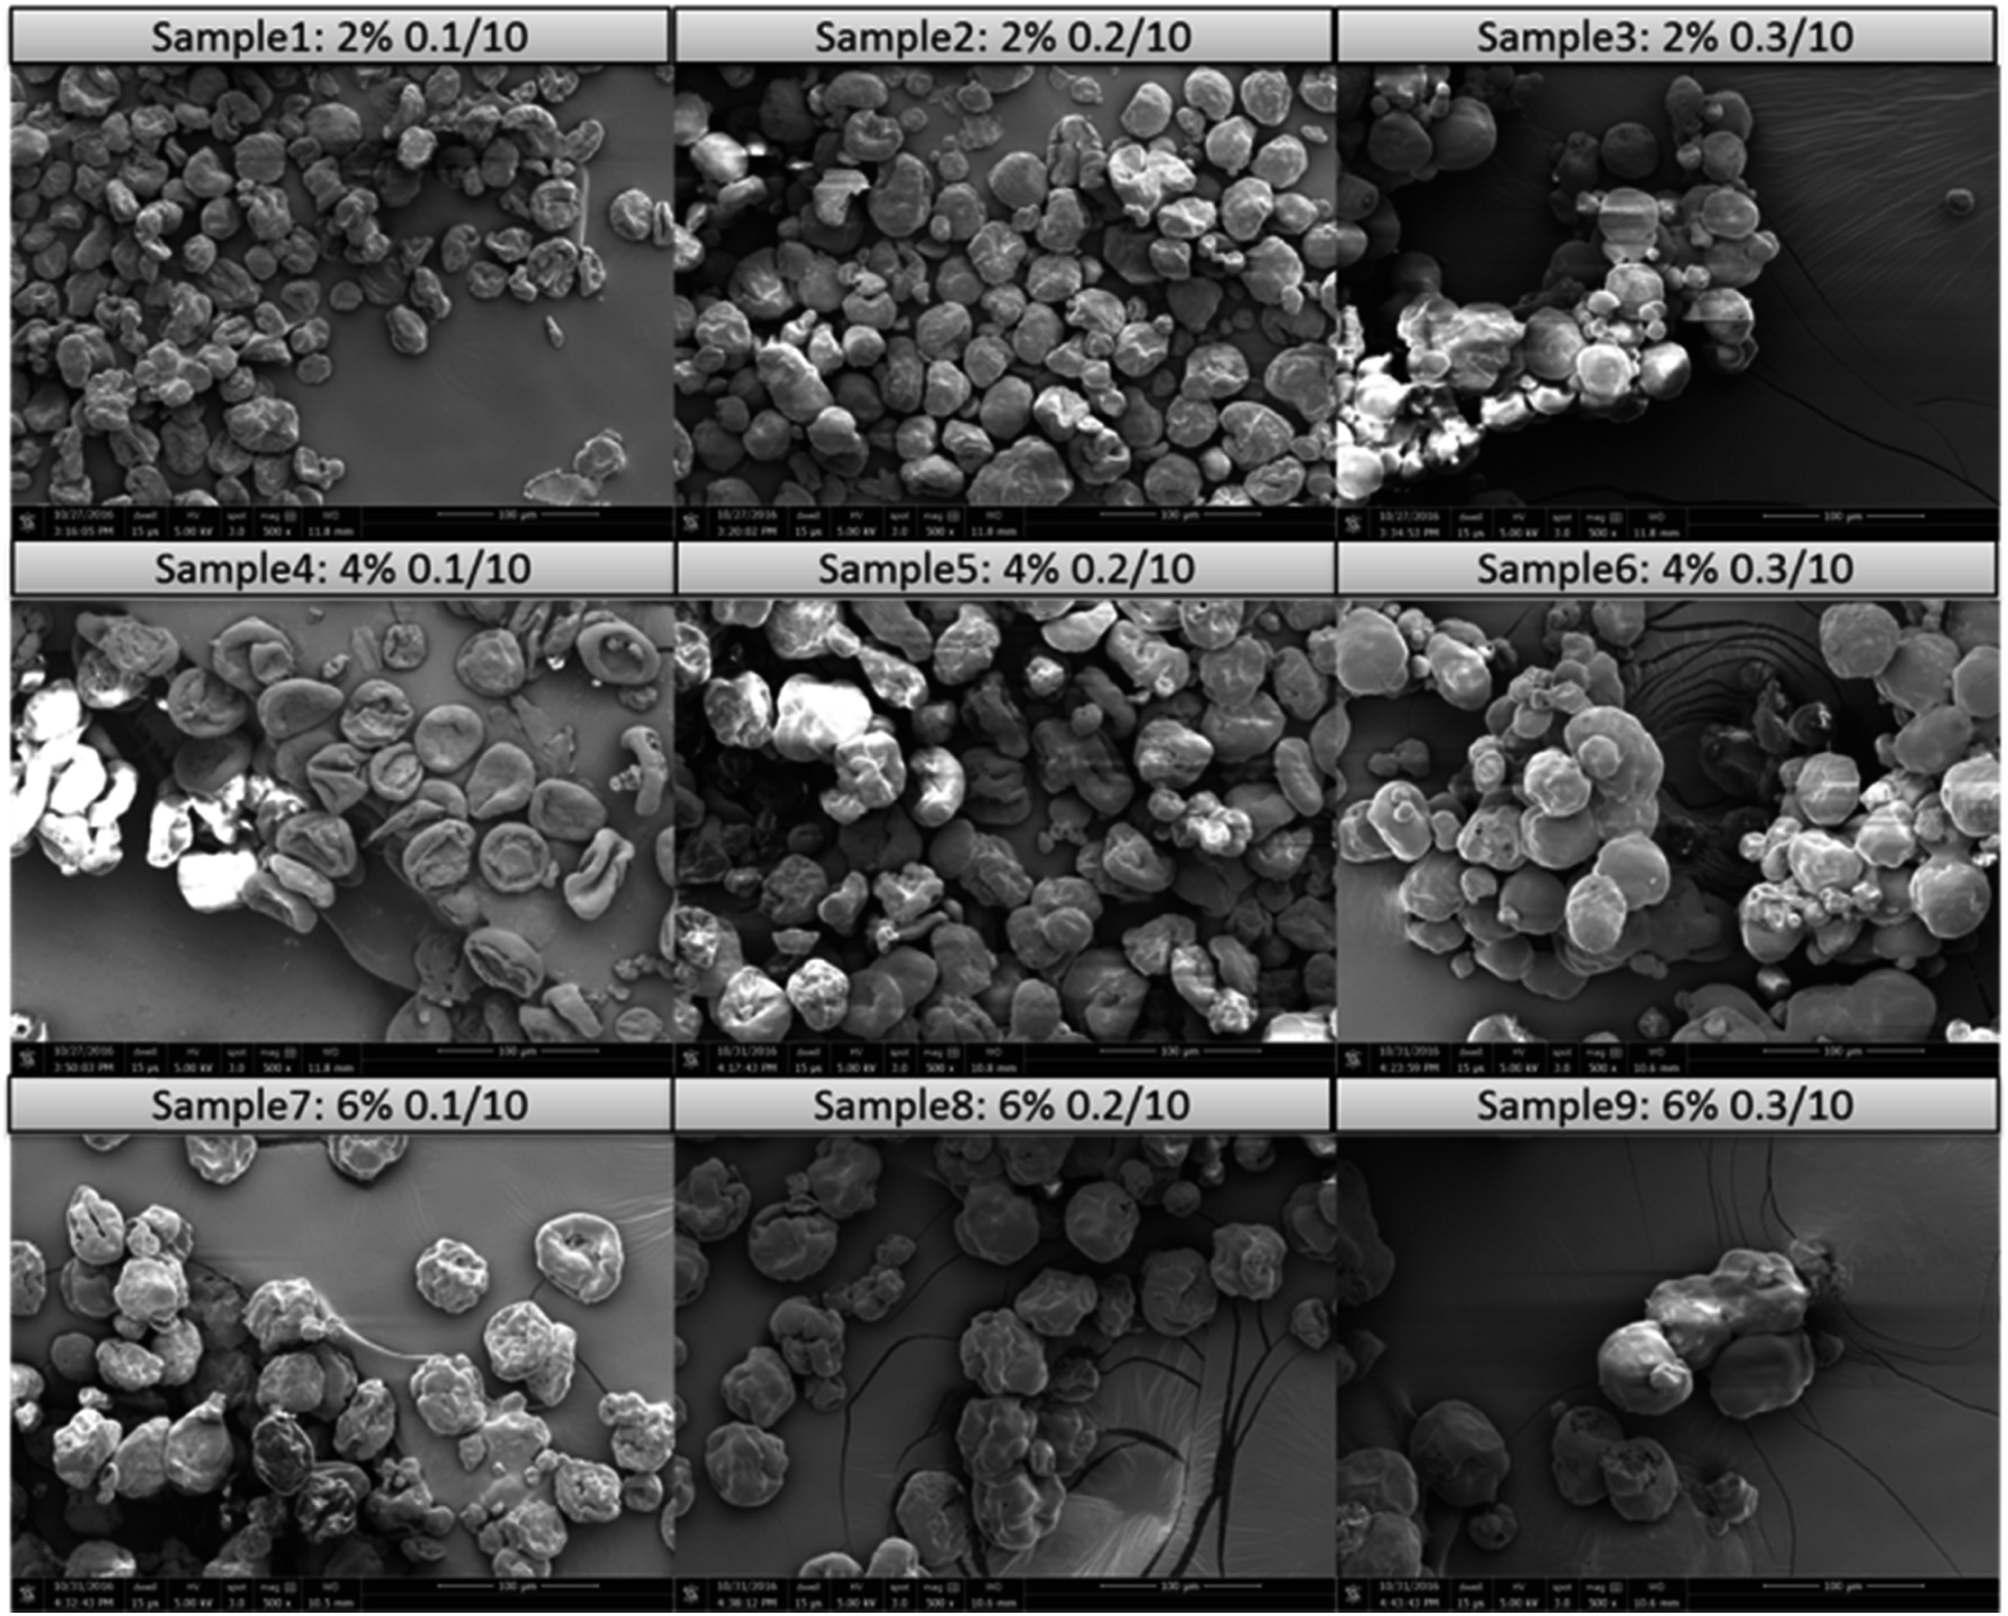
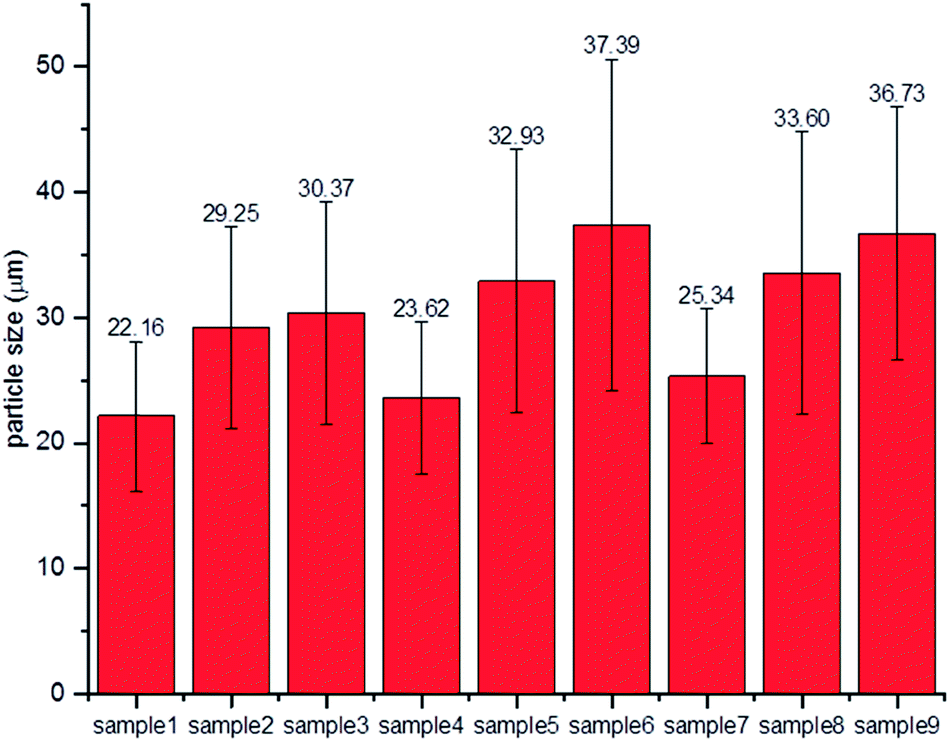
The morphologies of the dried particles at various zein concentrations and flow rate combinations are shown in Fig. 4. One of the promising features of microfluidic devices is that the droplet size can be finely tuned by adjusting the flow rates of the dispersing and continuous phases.35 Image analysis was performed to calculate the particle sizes of the microcapsules, and the results are shown in Fig. 5. A trend was identified that the size of the microcapsule increased with an increasing flow rate of the dispersing phase, while the zein concentration had less impact. The flow rate ratio is one of the predominant factors governing the droplet size, which has been described in a previous study.36 On the other hand, the zein concentration in the dispersing phase determined the solid content in the droplet, and the droplets with greater amounts of zein are more resistant against shrinking during ethanol diffusion, which also resulted in larger microcapsule sizes.
 |
| | Fig. 4 The morphologies of hollow zein microcapsules produced at different concentrations of zein and flow rate combinations. Sample code: zein% dispersing phase flow rate (ml h−1)/continuous phase flow rate (ml h−1). The scale bar for each image is 100 μm. | |
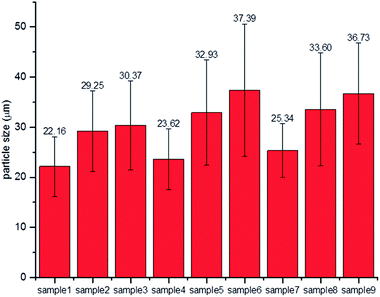 |
| | Fig. 5 Mean particle size of microcapsules using image analysis on SEM images. | |
Precise control over particle size generally correlates with enhanced control of the rate of release of an encapsulant. It was observed from the SEM images that the particle size was relatively uniform at low dispersing flow rates (0.1 and 0.2 ml h−1), but a larger variation of particle size was observed when the flow rate of the dispersing phase reached 0.3 ml h−1. A probable reason is that the parallel flow extended too far in the microfluidic channel when the flow rate of the dispersing phase increased. Therefore the detachment occurred at later time, leaving a short residence time for the zein to self-assemble. Without a completely hardened droplet surface, microcapsules may coalesce in the tubing or collector, resulting in non-uniform particle size. There are two other reasons that might also cause the polydispersity of protein capsules in this study. First, zein is a biologically-originated material, which is naturally inhomogeneous. Zein contains α-zein, β-zein, γ-zein and δ-zein, and these conformations have the tendency to form micelles or nanoaggregates in solution and therefore alter the local concentrations of each composition.40 Another reason could be related to the morphological change during the drying process. When water is removed from the core, different degrees of shrinkage could occur which may result in different shapes and sizes. For example, bowl-like and wrinkled structures have been found, depending on the hollow core distribution patterns.
Fig. 6 displays the internal structure of zein microcapsules captured using CLSM. The images show that the internal structure of the microcapsules was hollow, and the number of hollow cores varied from a single core to multiple cores by simply adjusting the flow rate of the dispersing phase. At a lower flow rate of the dispersing phase, zein microcapsules with fewer hollow cores were formed, while a higher dispersing flow rate tended to form a larger number of hollow cores. The differences in the number of hollow cores could be attributed to the droplet size, which could affect the rate of ethanol diffusion during the internal phase separation process. When the droplet size was small, ethanol could be readily extracted into the continuous phase, tributyrin, leaving a large but single hollow core, while the slow diffusion of ethanol to the continuous phase was expected in the case of large droplets. The formation of internal structure is difficult to predict due to the complexity of two competing processes: ethanol diffusion and zein self-assembly. The rate of either process could have a significant impact on the other, for example, the formation of a zein network could decrease the rate of ethanol diffusion. Therefore, the general conclusion of a positive correlation between the flow rate of the dispersing phase and the number of hollow cores may not be drawn. However, this method did provide a facile approach to tune the internal structure of the microcapsules.
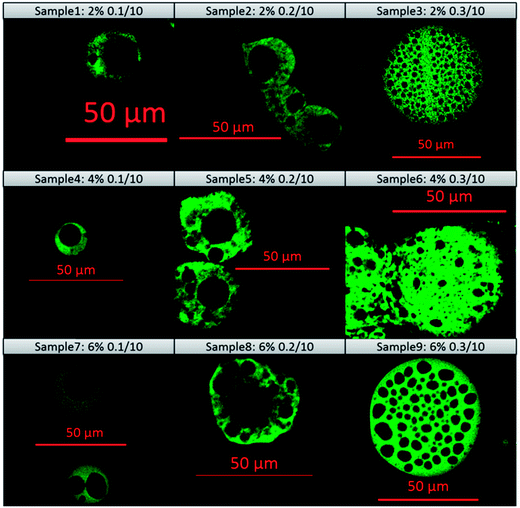 |
| | Fig. 6 The internal structure of hollow zein microcapsules produced at different concentrations of zein and flow rate combinations. Sample code: zein% dispersing phase flow rate (ml h−1)/continuous phase flow rate (ml h−1). The scale bar for each image is 50 μm. | |
Release profiles
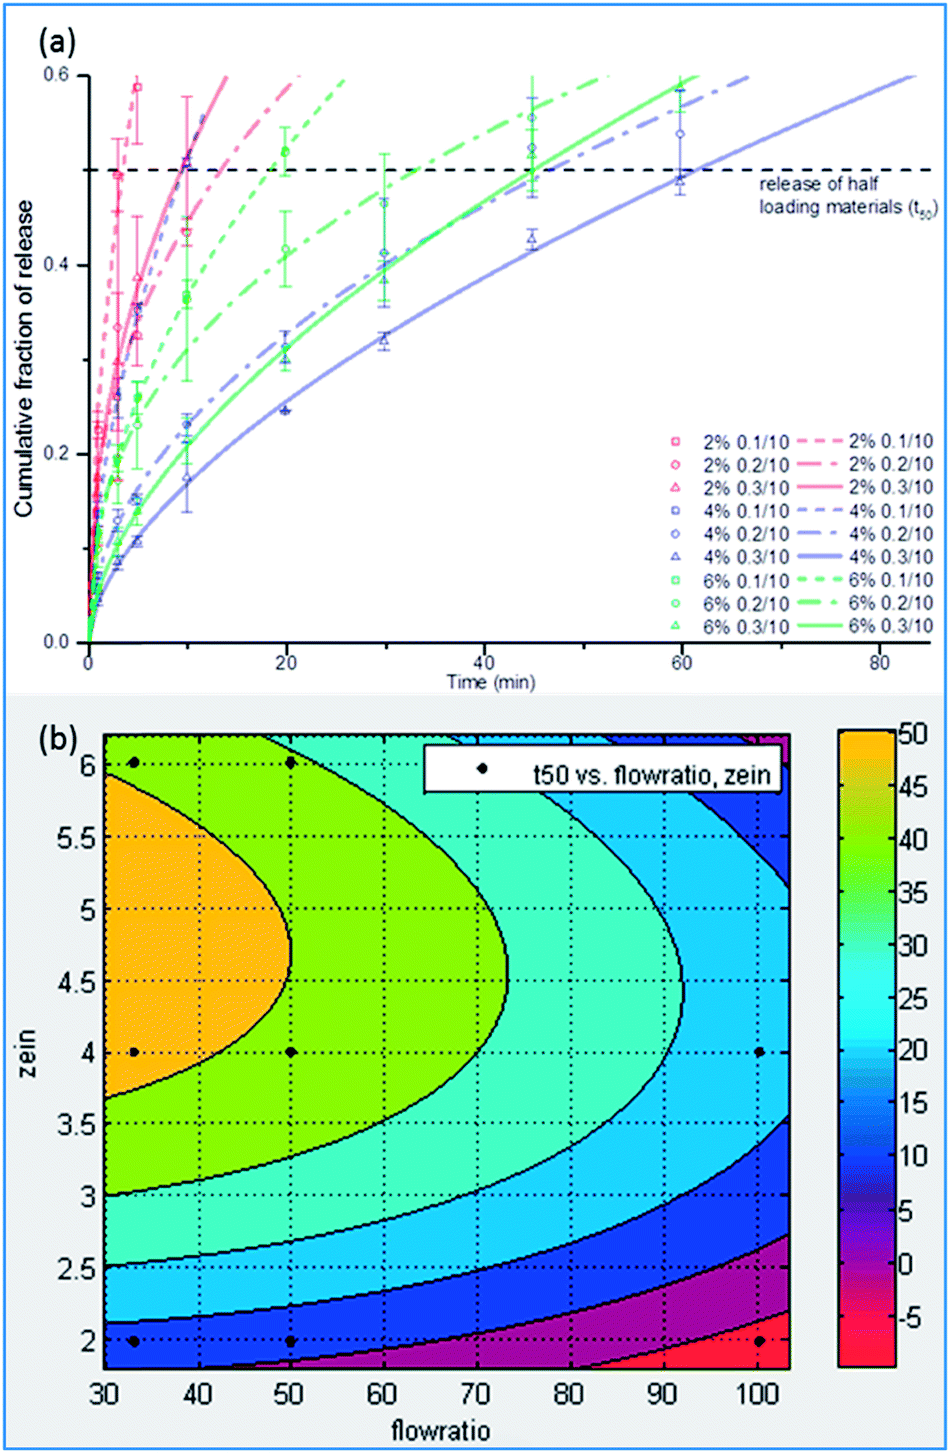
Fig. 7(a) shows the release profiles and fitted curves of all of the samples tested in this study. The release test was carried out for 24 hours and approximately 60% of Rhodamine was recovered. This number is reasonable because Rhodamine B has a greater affinity for ethanol than water and a considerable fraction of Rhodamine B was diffused along with ethanol.
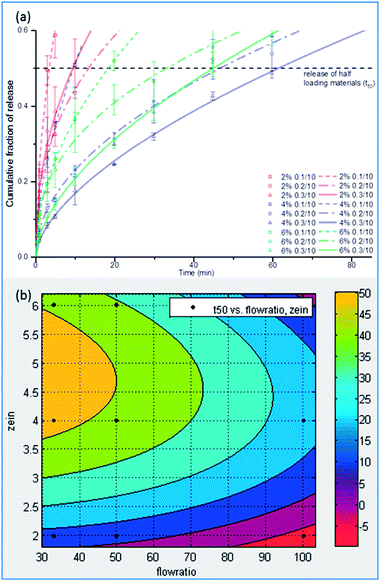 |
| | Fig. 7 Release performance of the zein microcapsules prepared at different conditions. (a) The combined release curves of all nine samples, displaying normalized fractional release versus release time (min) and fitting curves. Sample code: zein% dispersing phase flow rate (ml h−1)/continuous phase flow rate (ml h−1). (b) The response surface plot of the release half-life time as a function of the zein concentration (%, w/v) and flow rate ratio. | |
The samples produced with 2% zein released the dye fairly quickly, probably due to the formation of thinner walls than the samples with higher zein concentrations. Increasing the zein concentration to 4% was suitable to prolong the release while increasing the zein concentration to 6% did not induce further delay of the release. The cross-section images indicate that the difference in pore size between the 4% and 6% zein samples might not be significant, so it is reasonable to conclude that a further increase in the zein concentration may not further modify the release profile. On the other hand, increasing the flow rate of the dispersing phase could also prolong the release. It has been discussed above that a larger size of microcapsules was generated at higher dispersing flow rates. Usually, larger particles possess smaller surface-to-volume ratios, so the release of the dye is hindered as well. Another reason could be associated with the structure of the microcapsules. Those microcapsules with single large cores could release the core material faster than those microcapsules with multiple small pores, which could be attributed to the differences in wall thickness. For the microcapsules with single large cores, the wall was thin, which favors fast diffusion. However, for those microcapsules with a porous structure with multiple small cores, the pores embedded in the center had multiple relatively thick walls to pass through during diffusion. A similar finding and mechanism were also reported in a previous study with quantifications.41 When releasing drugs in in vitro models, the rate of release is more complicated and also depends on other factors such as degradation of microcapsules.42 Therefore, further development and optimization is necessary to engineer the microcapsule for applications such as gastro-intestinal delivery. Response surface is a robust methodology to study multivariable experiments and to find the experimental region that would generate desirable results.43 Fig. 7(b) shows a response surface that correlates the release half-lives (t50) with zein concentrations and flow rates (R2 = 0.852). Based on the response surface prediction, a wide range of t50, from 3 minutes to 62 minutes, was achieved by adjusting the zein concentrations and flow rate ratios. Microcapsules that are capable of sustained release could be used as intestinal delivery carriers for enhanced bioavailability, or encapsulating antimicrobial components and fragrances for extended efficacy.44,45 On the other hand, microcapsules with boosted release properties could be used for flavor compounds in order to rapidly release flavors during oral processing while improving flavor stability during storage.46
Conclusions
In this study, we demonstrated a facile approach to fabricating hollow protein microcapsules in a T-junction microfluidic chip. It is a single-step process that features great biocompatibility and all of the materials involved were non-hazardous. The generation of droplets in the microfluidic chip allowed the creation of an interface to direct zein self-assembly and hence the formation of microcapsules. By adjusting the zein concentration in the dispersing phase and flow rates during processing, microcapsules with various particle sizes, internal structures and permeabilities could be prepared, which will allow for the design of microcapsules that are versatile for various applications. This type of microcapsule can be an alternative for replacing colloidosomes. It is easier, safer and more cost-effective to produce than colloidosomes. Furthermore, this study also presented the great potential of zein as a food-grade protein, which can be incorporated for expanded applications.
Conflicts of interest
There are no conflicts to declare.
Acknowledgements
This work was partially supported by the Hatch Project No. ILLU-698-380, United State Department of Agriculture.
References
- S. Gouin, Trends Food Sci. Technol., 2004, 15, 330–347 CrossRef CAS.
- G. Kaufman, S. Nejati, R. Sarfati, R. Boltyanskiy, M. Loewenberg, E. R. Dufresne and C. O. Osuji, Soft Matter, 2015, 11, 7478–7482 RSC.
- K. L. Thompson, M. Williams and S. P. Armes, J. Colloid Interface Sci., 2014, 447, 217–228 CrossRef PubMed.
- D. Lee and D. A. Weitz, Adv. Mater., 2008, 20, 3498–3503 CrossRef CAS.
- A. D. Dinsmore, M. F. Hsu, M. G. Nikolaides, M. Marquez, A. R. Bausch and D. A. Weitz, Science, 2002, 298, 1006–1009 CrossRef CAS PubMed.
- A. San Miguel, J. Scrimgeour, J. E. Curtis and S. H. Behrens, Soft Matter, 2010, 6, 3163 RSC.
- D. Mark, S. Haeberle, G. Roth, F. von Stetten and R. Zengerle, Chem. Soc. Rev., 2010, 39, 1153 RSC.
- D. M. Headen, G. Aubry, H. Lu and A. J. García, Adv. Mater., 2014, 26, 3003–3008 CrossRef CAS PubMed.
- A. G. Olenskyj, Y. Feng and Y. Lee, J. Food Eng., 2017, 211, 50–59 CrossRef CAS.
- B. Kim, T. Y. Jeon, Y.-K. Oh and S.-H. Kim, Langmuir, 2015, 31, 6027–6034 CrossRef CAS PubMed.
- H. C. Shum, A. R. Abate, D. Lee, A. R. Studart, B. Wang, C. H. Chen, J. Thiele, R. K. Shah, A. Krummel and D. A. Weitz, Macromol. Rapid Commun., 2010, 31, 108–118 CAS.
- J. Zhang, R. J. Coulston, S. T. Jones, J. Geng, O. A. Scherman and C. Abell, Science, 2012, 335, 690–694 CrossRef CAS PubMed.
- V. L. Workman, S. B. Dunnett, P. Kille and D. D. Palmer, Macromol. Rapid Commun., 2008, 29, 165–170 CrossRef CAS.
- Y. Zheng, Z. Yu, R. M. Parker, Y. Wu, C. Abell and O. A. Scherman, Nat. Commun., 2014, 5, 5772 CrossRef CAS PubMed.
- J. Zhou, D. C. Hyun, H. Liu, H. Wu and Y. Xia, Macromol. Rapid Commun., 2014, 35, 1436–1442 CrossRef CAS PubMed.
- H. Zhang, E. Tumarkin, R. M. A. Sullan, G. C. Walker and E. Kumacheva, Macromol. Rapid Commun., 2007, 28, 527–538 CrossRef CAS.
- C. X. Zhao and A. P. J. Middelberg, Microfluid. Nanofluid., 2013, 14, 703–709 CrossRef CAS.
- C. X. Zhao and A. P. J. Middelberg, Angew. Chem., Int. Ed., 2009, 48, 7208–7211 CrossRef CAS PubMed.
- Y. Zhang, L. Cui, X. Che, H. Zhang, N. Shi, C. Li, Y. Chen and W. Kong, J. Controlled Release, 2015, 206, 203–219 CrossRef PubMed.
- K. Pan and Q. Zhong, Annu. Rev. Food Sci. Technol., 2016, 7, 245–266 CrossRef CAS PubMed.
- K. Pan and Q. Zhong, Food Hydrocolloids, 2016, 52, 600–606 CrossRef CAS.
- Y. Feng and Y. Lee, Food Hydrocolloids, 2016, 56, 292–302 CrossRef CAS.
- Y. Wang and G. W. Padua, Langmuir, 2012, 28, 2429–2435 CrossRef CAS PubMed.
- Q. Zhong and M. Jin, Food Hydrocolloids, 2009, 23, 2380–2387 CrossRef CAS.
- T. Brugarolas, F. Q. Tu and D. Lee, Soft Matter, 2013, 9, 9046–9058 RSC.
- H. Chen and Q. Zhong, Food Hydrocolloids, 2015, 43, 593–602 CrossRef CAS.
- S. Hu, T. Wang, M. L. Fernandez and Y. Luo, Food Hydrocolloids, 2016, 61, 821–831 CrossRef CAS.
- Y. Luo, B. Zhang, M. Whent, L. L. Yu and Q. Wang, Colloids Surf., B, 2011, 85, 145–152 CrossRef CAS PubMed.
- G. Golomb, P. Fisher and E. Rahamim, J. Controlled Release, 1990, 12, 121–132 CrossRef CAS.
- A. Micsonai, F. Wien, L. Kernya, Y.-H. Lee, Y. Goto, M. Réfrégiers and J. Kardos, Proc. Natl. Acad. Sci. U. S. A., 2015, 112, E3095–E3103 CrossRef CAS PubMed.
- N. J. Greenfield, Nat. Protoc., 2006, 1, 2876–2890 CrossRef CAS PubMed.
- H. Chen, Y. Zhang and Q. Zhong, J. Food Eng., 2015, 144, 93–102 CrossRef CAS.
- X. Wang, Z. Li, Y. Yang, X. Gong, Y. Liao and X. Xie, Langmuir, 2015, 31, 5456–5463 CrossRef CAS PubMed.
- R. W. Korsmeyer, R. Gurny, E. Doelker, P. Buri and N. A. Peppas, Int. J. Pharm., 1983, 15, 25–35 CrossRef CAS.
- A. S. Utada, A. Fernandez-Nieves, H. A. Stone and D. A. Weitz, Phys. Rev. Lett., 2007, 99, 94502 CrossRef PubMed.
- K. Muijlwijk, C. Berton-carabin and K. Schroën, Trends Food Sci. Technol., 2016, 49, 51–63 CrossRef CAS.
- Y. Wang, F. Lopes Filho, P. Geil and G. W. Padua, Macromol. Biosci., 2005, 5, 1200–1208 CrossRef CAS PubMed.
- G. Liu, D. Wei, H. Wang, Y. Hu and Y. Jiang, Chem. Eng. J., 2016, 284, 1094–1105 CrossRef CAS.
- Z. Zhang, R. Zhang, Q. Tong, E. A. Decker and D. J. McClements, Food Res. Int., 2015, 69, 274–280 CrossRef CAS.
- S. Kim and J. Xu, J. Cereal Sci., 2008, 47, 1–5 CrossRef CAS.
- K. A. Mehta, M. S. Kislalioglu, W. Phuapradit, A. W. Malick and N. H. Shah, J. Controlled Release, 2000, 63, 201–211 CrossRef CAS PubMed.
- D. Klose, F. Siepmann, K. Elkharraz, S. Krenzlin and J. Siepmann, Int. J. Pharm., 2006, 314, 198–206 CrossRef CAS PubMed.
- P. Z. Hou and J. Regenstein, J. Food Sci., 2006, 69, C393–C398 CrossRef.
- X.-Y. Shi and T.-W. Tan, Biomaterials, 2002, 23, 4469–4473 CrossRef CAS PubMed.
- P. Sarkar, A. K. Bhunia and Y. Yao, J. Food Sci., 2016, 81, M2982–M2987 CrossRef CAS PubMed.
- H. Yoshii, A. Soottitantawat, X. D. Liu, T. Atarashi, T. Furuta, S. Aishima, M. Ohgawara and P. Linko, Innovative Food Sci. Emerging Technol., 2001, 2, 55–61 CrossRef CAS.
Footnote |
| † Electronic supplementary information (ESI) available. See DOI: 10.1039/c7ra08645h |
|
| This journal is © The Royal Society of Chemistry 2017 |
Click here to see how this site uses Cookies. View our privacy policy here. 
 Open Access Article
 This Open Access Article is licensed under a Creative Commons Attribution-Non Commercial 3.0 Unported Licence
 and
Youngsoo Lee*
and
Youngsoo Lee*