 Open Access Article
Creative Commons Attribution 3.0 Unported Licence
Antiferroelectric to relaxor ferroelectric phase transition in PbO modified (Pb0.97La0.02)(Zr0.95Ti0.05)O3 ceramics with a large energy-density for dielectric energy storage
Bi Li ,
Qiu-Xiang Liu,
Xin-Gui Tang*,
Tian-Fu Zhang,
Yan-Ping Jiang,
Wen-Hua Li and
Jie Luo
School of Physics & Optoelectric Engineering, Guangdong University of Technology, Guangzhou Higher Education Mega Centre, Guangzhou 510006, PR China. E-mail: xgtang@gdut.edu.cn
First published on 7th September 2017
Abstract
(Pb0.97(1+x)La0.02)(Zr0.95Ti0.05)O3 (PLZT2/95/5) ceramics with excess lead content (x = 0, 3%, 5%, 7.5%, 10% and 15%) were successfully prepared via a solid-state reaction route. X-ray diffraction analysis indicated that a pure perovskite structure was obtained for all compositions. The effects of excess lead content on the microstructure, dielectric properties, and energy-storage performance of PLZT2/95/5 ceramics were systematically investigated. The ceramics exhibited tetragonal phase structures and showed two dielectric peaks at 120 and 240 °C, corresponding to antiferroelectric–ferroelectric and ferroelectric–paraelectric phase transitions. The recoverable energy-storage density calculated from hysteresis loops reached about 2.12 J cm−3 with an efficiency of 92.98%, which was due to the phase transition from the antiferroelectric state to the relaxor ferroelectric state. Based on these results, typical PLZT2/95/5 ceramics with different lead excess content have been studied, which could be potential candidates for applications in high energy storage-density electrical capacitors.
Introduction
Recently, electrical capacitors have displayed an extremely high power density but their energy storage density needed further improvement, which has driven the active investigation and innovation of energy-storage materials.1–4 Generally, dielectric materials under intensive study can be classified into four categories: linear dielectrics, ferroelectrics (FEs), anti-ferroelectrics (AFEs), and relaxor ferroelectrics.5,6 Due to the large polarization of AFE materials, the energy density of AFE materials is high. In the past few years, some efforts have been made to improve the energy-storage properties of AFE materials. It was found that the energy-storage properties of PbZrO3 (PZ) materials could be enhanced by doping with Sn, La, Ba, Nb and Sr.7–12 Most AFE materials, such as Pb(Zr, Sn, Ti)O3 (PZST), (Pb, La)(Zr, Ti)O3 (PLZT), Pb1−xBaxZrO3 (PBZ), (Pb, Nb)(Zr, Sn, Ti)O3 (PNZST), and (Pb, Sr)ZrO3 (PSZ), are lead based. The previous works on energy-storage properties of thin films were conducted mainly under electric fields of hundreds of kV cm−1. It is a well-known fact that large electric fields can induce higher polarization. As both the electric field and polarization increase, the energy-storage properties inevitably increase. Unfortunately, from the aspect of applications, such large electric fields are needless for energy-storage devices; the first priority for energy-storage devices is to obtain slim hysteresis loops or double hysteresis loops. This is the research direction to which we should pay more attention.(Pb0.97La0.02)(Zr0.95Ti0.05)O3 (PLZT2/95/5) ceramics is considered to be one of most promising candidates for the applications in high energy-storage density ceramic capacitors due to AFE properties. AFE materials have two distinct electric displacement versus electric field behaviors, double hysteresis loops and slim and slanted hysteresis loops. La3+ doping and excess PbO were used to produce relaxor behavior with slim and slanted hysteresis loops to increase the discharge energy density.13 A slim hysteresis loop is associated with low loss and thus is important to improving pulsed capacitor operation, which makes relaxor materials with slim and slanted hysteresis loops preferred candidates for pulsed capacitors. However, the typical PLZT2/95/5 ceramics with different excess lead content were still rarely reported. In order to enhance the energy-storage properties, the typical PLZT2/95/5 ceramics with different excess lead content have been studied.
In this work, the typical PLZT2/95/5 ceramics were fabricated in order to investigate the effects of excess lead content on the energy-storage performance. Compared with the previous study,14 the experimental process used high purity lead oxide PbO and cold isostatic pressure technology. These measurements were done by immersing the ceramics in silicone oil at the electric field of dielectric breakdown strength (90 kV cm−1). Dielectric measurements permitted to determine the exits phase transition of the samples. The recoverable energy-storage density calculated from hysteresis loops reached about 2.12 J cm−3 and efficiency of 92.98%. These results demonstrated that the PLZT2/95/5 ceramics with excess lead content may be quite promising candidates for dielectrics in high energy density electrical capacitors.
Experimental
(Pb0.97(1+x)La0.02)(Zr0.95Ti0.05)O3 ceramics with excess lead content (x = 0, 3%, 5%, 7.5%, 10% and 15%) were successfully prepared via a solid-state reaction route. Compared with the previous study,14 the experimental process used high purity lead oxide PbO and cold isostatic pressure technology. Raw materials of PbO (99%), TiO2 (99%), ZrO2 (99%) and La2O3 (99.9%) were weighed according to the formula (Pb0.97(1+x)La0.02)(Zr0.95Ti0.05)O3 in the required stoichiometry with different excess lead content. Precursor oxides were mixed by ball milling in ethanol for 24 h, then dried and presintered at 850 °C in an alumina crucible for 5 h. After remilled and dried, the calcined fine powder with 5 wt% PVA as a binder was cold pressed into cylindrical pellets of size 10 mm diameter and 1–2 mm thickness using a cold isostatic pressure technology with 250 MPa. The ceramics were fabricated by sintering at 1250 °C for 5 h. In order to avoid the vaporization, PbO atmosphere for the sintering was maintained using Pb(Zr0.95Ti0.05) as spacer powder.Ceramic samples were polished to the thickness of 0.8 mm for the measurement of electrical properties. Both sides of samples were electroded with silver paste and sintered at 600 °C for 2 h. The crystal structure and orientation of the ceramic samples were characterized by using an X-ray diffractometer (XRD, D/MAX 2200 VPC, Rigaku, Japan) with working current and voltage of 20 mA and 36 kV, respectively. The morphology of the samples were characterized by a field emission scanning electronic microscope (FE-SEM, JSM-7001F, Japan) with accelerating voltage of 15 kV. The temperature dependence of dielectric was measured by Agilent E4980A in the temperature range of 26–650 °C with the heating rate 3 of °C min−1. The polarization-electric field (P–E) loops were characterized by Radiant Technolies' Precision premier II (Albuquerque, NM) over the temperature range of 30–200 °C.
Results and discussion
Fig. 1 presents XRD patterns of sintered PLZT2/95/5 ceramics samples with excess lead content from 0 to 15%. From the XRD patterns, we can observe the additional peaks (*), which matched with the pyrochlore phase. These phases arose due to the volatization of PbO and over sintering at high temperature.15 The small peaks near 29 degree Bragg's angle were becoming more and more obvious with the increasing excess lead content. XRD patterns indicated that peaks the (200) diffraction peak splits into two peaks of (200) and (002) samples with the arrow, demonstrating tetragonal phase structures in these samples.16 It can be concluded that these ceramics have the AFE and FE phases.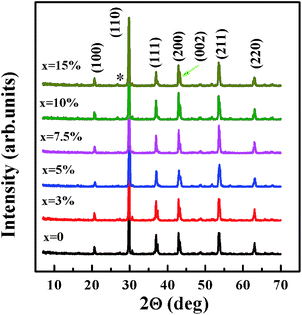 | ||
| Fig. 1 XRD patterns of PLZT2/95/5 ceramics with excess lead content from 0 to 15% sintered at 1250 °C for 5 h. | ||
Fig. 2(a)–(f) shows the surface microstructure of the PLZT2/95/5 ceramics samples with excess lead content from 0 to 15%. It can be seen that the samples presented dense and similar grain morphology with different lead excess content. Sample densities were measured based on Archimedes' principle, equaling ∼95% of the theoretical density.17 Thus, the fabricated ceramics were confirmed to be dense.
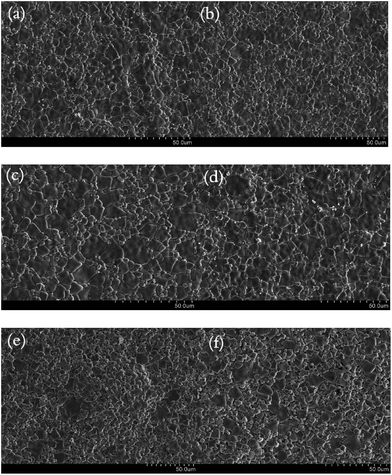 | ||
| Fig. 2 SEM image of PLZT2/95/5 ceramics with excess lead content: (a) 0, (b) 3%, (c) 5%, (d) 7.5%, (e) 10% and (f) 15%. | ||
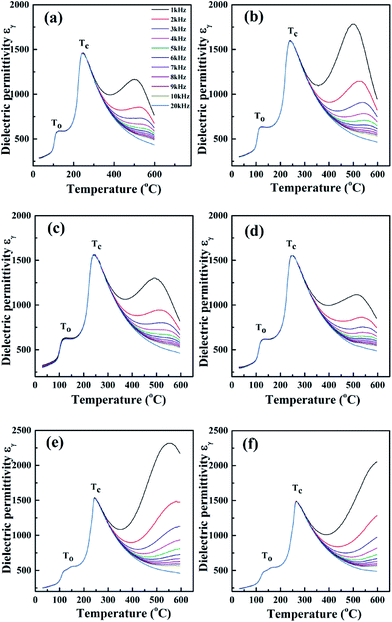
Temperature dependences of dielectric permittivity εr for PLZT2/95/5 ceramics samples with excess lead content from 0 to 15% at various frequencies were shown in Fig. 3(a)–(f). Clearly, the curves of PLZT2/95/5 ceramics samples displayed a similar tendency in the measurement range. It could be found from these figures that lead excess content had a little influence on dielectric constant of PLZT2/95/5 ceramics samples. The relative permittivity curves exhibited anomalous peaks at about 120 (To) and 240 °C (TC), respectively. The small anomalous peak was interpreted by the phase transition tetragonal AFE phase to rhombohedral FE phase,18,19 whereas the maximum anomalous peak was linked with the transformation of rhombohedral FE phase to cubic paraelectric phase at the higher temperature. The characteristic temperatures of To decreased, whereas TC increased.14 The temperature of the FE–AFE phase transition, Curie temperature and maximum relative permittivity were shown in Table 1. With lead excess content 10% and 15%, the small anomalous peak To was wide humps, which could be the phase tetragonal AFE phase and rhombohedral FE phase. Moreover, dielectric permittivity εr was gradually decreased with the increasing frequency. It was because that the polarization process of some frameworks, such as space charges, needs slightly longer time.20
| x (%) | 0 | 3 | 5 | 7.5 | 10 | 15 |
|---|---|---|---|---|---|---|
| To (°C) | 120 | 116 | 122 | 126 | 115 | 130 |
| TC (°C) | 243 | 240 | 244 | 247 | 246 | 265 |
| εmax | 1460 | 1595 | 1562 | 1554 | 1534 | 1488 |
Fig. 4(a)–(f) illustrates the temperature dependences of dielectric loss tan![[thin space (1/6-em)]](https://www.rsc.org/images/entities/char_2009.gif) δ for PLZT2/95/5 ceramics samples with different excess lead content from 0 to 15% at various frequencies. Two anomalies in the dielectric loss tan
δ for PLZT2/95/5 ceramics samples with different excess lead content from 0 to 15% at various frequencies. Two anomalies in the dielectric loss tan![[thin space (1/6-em)]](https://www.rsc.org/images/entities/char_2009.gif) δ were observed, which was consistent with the dielectric measurements. The similar phenomenon was reported by some researchers.21–24 Meanwhile, a low dielectric loss could be maintained in the frequency range (1 to 20 kHz), which was beneficial to electric energy-storage and practical applications. However, it was interesting to note that the value of dielectric permittivity εr in Fig. 3(a)–(f) was very large, and prominent and wide humps were observed in the temperature region of 500–600 °C from 1 to 20 kHz (the relaxor behavior), which were attributed to the space charge polarization or the conductivity of insulating ceramics increases with increase in temperature.25 The same phenomenon had also been reported in several perovskites with the temperature range of 400–800 °C.26 The high temperature relaxation does not have relationship with the phase transitions, which looks like the behavior of the diffuse phase transition.27 The relaxer behavior could be induced by many factors, such as interfacial polarization, space charge, domain wall motion, Maxwell–Wagner polarization, defect relaxation.28,29 The dielectric relaxation increased with the lead excess content increasing, implying that they could due to the volatization of PbO. Lead vacancies will appear inevitably due to the volatility of lead, leading to OVs (oxygen vacancies) due to charge neutrality restrictions. The dielectric anomaly of dielectric materials in the high temperature region, which is usually related to OVs, and the hopping motions of ionized OVs can lead to a relaxation processes in low frequency region typically below mega hertz.30,31 Therefore, it is reasonable to assume that the OVs cause dielectric anomaly in ceramics.
δ were observed, which was consistent with the dielectric measurements. The similar phenomenon was reported by some researchers.21–24 Meanwhile, a low dielectric loss could be maintained in the frequency range (1 to 20 kHz), which was beneficial to electric energy-storage and practical applications. However, it was interesting to note that the value of dielectric permittivity εr in Fig. 3(a)–(f) was very large, and prominent and wide humps were observed in the temperature region of 500–600 °C from 1 to 20 kHz (the relaxor behavior), which were attributed to the space charge polarization or the conductivity of insulating ceramics increases with increase in temperature.25 The same phenomenon had also been reported in several perovskites with the temperature range of 400–800 °C.26 The high temperature relaxation does not have relationship with the phase transitions, which looks like the behavior of the diffuse phase transition.27 The relaxer behavior could be induced by many factors, such as interfacial polarization, space charge, domain wall motion, Maxwell–Wagner polarization, defect relaxation.28,29 The dielectric relaxation increased with the lead excess content increasing, implying that they could due to the volatization of PbO. Lead vacancies will appear inevitably due to the volatility of lead, leading to OVs (oxygen vacancies) due to charge neutrality restrictions. The dielectric anomaly of dielectric materials in the high temperature region, which is usually related to OVs, and the hopping motions of ionized OVs can lead to a relaxation processes in low frequency region typically below mega hertz.30,31 Therefore, it is reasonable to assume that the OVs cause dielectric anomaly in ceramics.
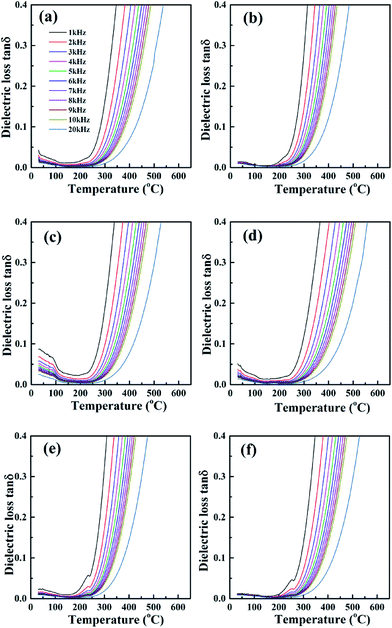 | ||
Fig. 4 Temperature dependences of dielectric loss tan![[thin space (1/6-em)]](https://www.rsc.org/images/entities/char_2009.gif) δ for PLZT2/95/5 ceramics samples with different excess lead content at various frequencies: (a) 0, (b) 3%, (c) 5%, (d) 7.5%, (e) 10% and (f) 15%. δ for PLZT2/95/5 ceramics samples with different excess lead content at various frequencies: (a) 0, (b) 3%, (c) 5%, (d) 7.5%, (e) 10% and (f) 15%. | ||
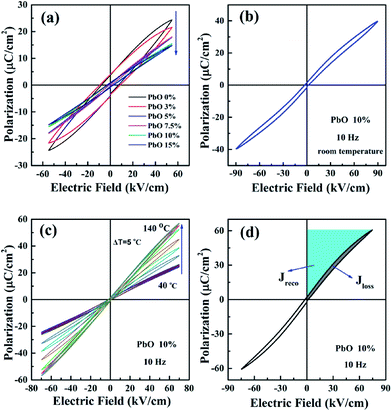
Fig. 5(a) shows the room temperature P–E loops at 10 Hz for the PLZT2/95/5 ceramics samples with different excess lead content from 0 to 15% under the electric field 55 kV cm−1. With excess lead content (0, 3%, 5%) of the PLZT2/95/5 ceramics displayed the characteristics of FE, indicating that they could be due to the volatization of PbO. The hysteresis loop of samples became slimmer with the increasing excess lead content. The slim and slanted hysteresis loops were obtained at room temperature, which was consistent with the soft mode theory.32 Under the electric field of dielectric breakdown strength (90 kV cm−1), the double P–E loops demonstrated the relaxor FE nature of ceramic,33,34 indicating that the critical field for phase switching between the AFE and FE states in Fig. 5(b). Unfortunately, AFE double hysteresis loops were not observed. The ceramics obtained in this work have lots of defects due to the volatility of lead. When a critical electric field was applied to induce the AFE phase, the opposite dipoles are forced to turn into parallel configuration.35 As shown in Fig. 5(c), slim double P–E loops were induced by the increasing temperature, which made them a potential candidate for applications in high energy density electrical capacitors.
Fig. 5(d) illustrates the recoverable energy-storage density Jreco (the green area) of the PLZT2/95/5 ceramics with 10% of the excess lead content at room temperature. Generally, the energy-storage density could be estimated from the P–E loops, which was calculated with the equation as follows:36
 | (1) |
 | (2) |
 | (3) |
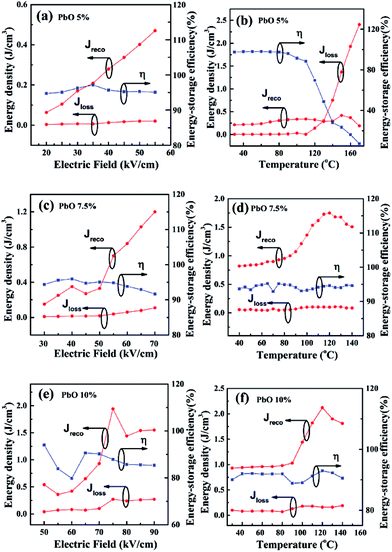
Fig. 6(a)–(f) illustrates the electric-field-related and the temperature-related showed energy-storage properties of the PLZT2/95/5 ceramics with excess lead content from 5 to 10%. Clearly, it can be seen that the PLZT2/95/5 ceramics displayed the lower Jreco values and had the lower Jloss values over the measurement range in Fig. 6(a) and (b), and the corresponding η value was slightly varied as the electric field increased from 20 to 55 kV cm−1 and strongly varied as the temperature increased, respectively. In Fig. 6(c), the Jreco value for the PLZT2/95/5 ceramics was varied from 0.15 to 1.20 J cm−3, and the corresponding η value was varied from 94.30 to 91.70% as the electric field increased from 30 to 70 kV cm−1 when 7.5% PbO was doped. Therefore, it was evident that Jreco values of certain materials could be improved by increasing their operating electric-fields and polarization. Meanwhile, the temperature dependent of the energy-storage performance is also a very important parameter over the measurement range. In the temperature-related showed energy-storage properties of the PLZT2/95/5 ceramics, the Jreco would first rise and then decrease. In Fig. 6(d), the largest Jreco value for the PLZT2/95/5 ceramics was 1.76 J cm−3 and the corresponding η value was 94.62% at To = 120 °C when 7.5% PbO was doped, which was interpreted by the phase transition AFE to relaxor FE. AFE materials possess relatively larger energy-storage density, have lower values of remnant polarization and coercive electric field and faster discharge rates for dissipating stored electrical energy, due to AFE to FE phase transition.37 However, the anti-parallel dipoles are aligned to form a relaxor FE phase at higher electric fields. When 10% PbO was doped in Fig. 6(e) and (f), it can be seen that the PLZT2/95/5 ceramics displayed the largest Jreco values and had the lowest Jloss values during the measurement range. For example, the Jreco value for the PLZT2/95/5 ceramics was changed from 0.36 to 1.94 J cm−3 at room temperature and the corresponding Jloss value was varied slightly as the electric field increased from 50 to 90 kV cm−1. The large recoverable energy density of 2.12 J cm−3 and the high energy efficiency of 92.98% can be achieved at 120 °C. At 120 °C, due to the phase transition from the AFE state to the relaxor FE state. The Jreco and the corresponding η value both kept decreasing over 120 °C during the heating process. However, the Jloss showed an opposite tendency. The maximum recoverable energy-storage density was shown in Table 2. Under the measurement conditions, the excess lead content (10%) of the PLZT2/95/5 ceramics displayed the largest Jreco values (2.12 J cm−3), indicating that they could be considered as potential candidate materials for energy storage ceramic capacitors. However, owing to the fact that these measurements were done by immersing the ceramics in silicone oil which broken down at low the electric field, the lead excess content (15%) of P–E data were not obtained.
| x (%) | 0 | 3 | 5 | 7.5 | 10 | 15 |
|---|---|---|---|---|---|---|
| Jreco (J cm−3) | 0.52 | 0.44 | 0.47 | 1.75 | 2.12 | 0.75 |
| Jloss (J cm−3) | 0.30 | 0.32 | 0.02 | 0.10 | 0.16 | 0.04 |
| η (%) | 63.41 | 57.89 | 95.91 | 94.59 | 92.98 | 94.94 |
A comparison of (anti)ferroelectric-based energy-storage properties between the PbZrO3-based ceramics are shown in Fig. 7.2,3,19,28,38–45 It can be seen that the PLZT2/95/5 ceramics possessed a very high energy-storage density simultaneously with the high energy-storage efficiency. In practical application, people often desire a larger recoverable energy density Jreco and a higher energy-storage efficiency η. Our work was superior to prior reported results as shown in Fig. 7 and the highest energy-storage with a calculated energy density of 2.12 J cm−3, which was higher than the reported data for the PLZST (1.24 J cm−3) and PLZT (1.27 J cm−3) bulk ceramics.46,47 Compared with the recently reported PbZrO3-based perovskite compositions ceramics, the PLZT2/95/5 ceramics with different excess lead content possessed a very high energy-storage density simultaneously with the high energy-storage efficiency, which indicated that the PLZT2/95/5 ceramics could be considered as potential candidate materials for energy-storage electrical capacitors.
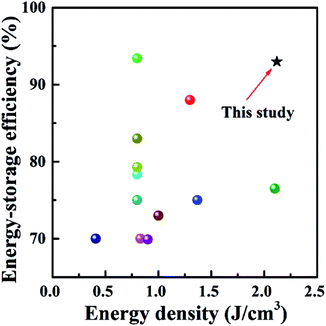 | ||
| Fig. 7 A comparison of energy densities and efficiencies of recently reported (anti)ferroelectric-based energy storage dielectric material. | ||
Conclusions
In summary, PLZT2/95/5 ceramics with excess lead content from 0 to 15% were successfully prepared by a conventional mixed oxide solid state reaction method. The typical PLZT2/95/5 ceramics with different excess lead content were fabricated in order to investigate the effects of excess lead content on the energy-storage performance. The recoverable energy-storage density calculated from hysteresis loops reached about 2.12 J cm−3 and efficiency of 92.98%. Compared with the recently reported PbZrO3-based perovskite compositions ceramics, the PLZT2/95/5 ceramics possessed a very high energy-storage density simultaneously with the high energy-storage efficiency, which indicated that the PLZT2/95/5 ceramics can be considered as potential candidate materials for energy storage electrical capacitors.Conflicts of interest
There are no conflicts to declare.Acknowledgements
This work was supported by the National Natural Science Foundation of China (Grant No. 11574057 and 51604087), the Guangdong Provincial Natural Science Foundation of China (Grant No. 2016A030313718), the Science and Technology Program of Guangdong Province of China (Grant No. 2016A010104018, and 2017A0104022) and the Youth Foundation of Guangdong University of Technology (Grant No. 14QNZA004).Notes and references
- K. Singh, Ferroelectrics, 1989, 94, 433 CrossRef.
- S. E. Young, J. Y. Zhang, W. Hong and X. Tan, J. Appl. Phys., 2013, 113, 054101 CrossRef.
- Z. Liu, X. F. Chen, W. Peng, C. H. Xu, X. L. Dong, F. Gao and G. S. Wang, Appl. Phys. Lett., 2015, 106, 262901 CrossRef.
- S. C. Chen, X. C. Wang, T. Q. Yang and J. F. Wang, J. Electroceram., 2014, 32, 307–310 CrossRef CAS.
- B. M. Xu, P. Moses, N. G. Pai and L. E. Cross, Appl. Phys. Lett., 1998, 72, 593–595 CrossRef CAS.
- N. Ortega, A. Kumar, J. F. Scott, D. B. Chrisey, M. Tomazawa, S. Kumari, D. G. B. Diestra and R. S. Katiyar, J. Phys.: Condens. Matter, 2012, 24, 445901 CrossRef CAS PubMed.
- L. Zhang, S. L. Jiang, Y. K. Zeng, M. Fu, K. Han, Q. Li, Q. Wang and G. Z. Zhang, Ceram. Int., 2014, 40, 5455–5460 CrossRef CAS.
- M. S. Mirshekarloo, K. Yao and T. Sritharan, Appl. Phys. Lett., 2010, 97, 142902 CrossRef.
- B. H. Ma, D. K. Kwon, M. Narayanan and U. Balachandran, J. Mater. Res., 2009, 24, 2993–2996 CrossRef CAS.
- B. P. Pokharel and D. Pandey, J. Appl. Phys., 2000, 88, 5364–5373 CrossRef CAS.
- P. S. Silva da, M. Venet and O. Florencio, J. Alloys Compd., 2015, 647, 784–789 CrossRef.
- A. Kumar, S. K. Mishra and V. K. Verma, J. Mater. Sci.: Mater. Electron., 2015, 26, 2769–2774 CrossRef CAS.
- H. R. Jo and C. S. Lynch, J. Appl. Phys., 2016, 119, 024104 CrossRef.
- B. Li, Q. X. Liu, X. G. Tang, T. F. Zhang, Y. P. Jiang, W. H. Li and J. Luo, Materials, 2017, 10, 143 CrossRef PubMed.
- G. Z. Zhang, Z. B. Chen, B. Y. Fan, J. G. Liu, M. Chen, M. Shen, P. Liu, Y. K. Zeng, S. L. Jiang and Q. Wang, APL Mater., 2016, 4, 064103 CrossRef.
- J. W. Zhai, X. Yao, Z. K. Xu and H. Chen, J. Phys. D: Appl. Phys., 2007, 40, 1811–1815 CrossRef CAS.
- B. Asbani, J. L. Dellis, A. Lahmar, M. Courty, M. Amjoud, Y. Gagou, K. Djellab, D. Mezzane, Z. Kutnjak and M. El Marssi, Appl. Phys. Lett., 2015, 106, 042902 CrossRef.
- P. Wawrzała and J. Korzekwa, Ferroelectrics, 2013, 446, 91–101 CrossRef.
- I. V. Ciuchi, L. Mitoseriu and C. Galassi, J. Am. Ceram. Soc., 2016, 99, 2382–2387 CrossRef CAS.
- X. H. Hao, J. Zhou and S. L. An, J. Am. Ceram. Soc., 2011, 94, 1647–1650 CrossRef CAS.
- X. H. Dai and D. Viehland, J. Appl. Phys., 1994, 76, 3701–3709 CrossRef CAS.
- Z. Xu, X. H. Dai and D. Viehland, Phys. Rev. B: Condens. Matter Mater. Phys., 1995, 51, 6261–6271 CrossRef CAS.
- X. H. Hao, Z. X. Yue, J. B. Xu, S. L. An and C. W. Nan, J. Appl. Phys., 2011, 110, 064109 CrossRef.
- A. Chauhan, S. Patel, R. Vaish and C. R. Bowen, Materials, 2015, 8, 8009–8031 CrossRef PubMed.
- U. Sukkha, W. Vittayakorn, R. Muanghlua, S. Niemcharoen, B. Boonchom and N. Vittayakorn, J. Am. Ceram. Soc., 2012, 95, 3151–3157 CrossRef CAS.
- J. Kreisel, P. Bouvier, M. Maglione, B. Dkhil and A. Simon, Phys. Rev. B: Condens. Matter Mater. Phys., 2004, 69, 092104 CrossRef.
- G. Singh, V. S. Tiwari and P. K. Gupta, J. Appl. Phys., 2010, 107, 064103 CrossRef.
- T. F. Zhang, X. G. Tang, Q. X. Liu, Y. P. Jiang, X. X. Huang and Q. F. Zhou, J. Phys. D: Appl. Phys., 2016, 49, 095302 CrossRef.
- J. Wang, X. G. Tang, H. L. W. Chan, C. L. Choy and H. S. Luo, Appl. Phys. Lett., 2005, 86, 152907 CrossRef.
- T. F. Zhang, X. G. Tang, Q. X. Liu, Y. P. Jiang and X. X. Huang, J. Am. Ceram. Soc., 2015, 98, 551–558 CrossRef CAS.
- C. C. Wang, C. M. Lei, G. J. Wang, X. H. Sun, T. Li, S. G. Huang, H. Wang and Y. D. Li, J. Appl. Phys., 2013, 113, 094103 CrossRef.
- J. Y. Yi and J. K. Lee, J. Phys. D: Appl. Phys., 2011, 44, 415302 CrossRef.
- Y. Liu, J. F. Scott and B. Dkhil, Appl. Phys. Rev., 2016, 3, 031102 Search PubMed.
- H. Borkar, V. N. Singh, B. P. Singh, M. Tomar, V. Gupta and A. Kumar, RSC Adv., 2014, 4, 22840–22847 RSC.
- X. Guo, J. Ge, F. Ponchel, D. Remiens, Y. Chen, X. L. Dong and G. S. Wang, Thin Solid Films, 2017, 632, 93–96 CrossRef CAS.
- B. J. Chu, X. Zhou, K. L. Ren, B. Neese, M. R. Lin, Q. Wang, F. Bauer and Q. M. Zhang, Science, 2006, 313, 1887 CrossRef CAS PubMed.
- S. Patel, A. Chauhan and R. Vaish, Mater. Res. Express, 2014, 1, 045502 CrossRef.
- X. C. Wang, J. Shen, T. Q. Yang, Z. Xiao and Y. Dong, J. Mater. Sci.: Mater. Electron., 2015, 26, 9200–9204 CrossRef CAS.
- X. F. Chen, X. L. Dong, G. S. Wang, F. Cao and Y. L. Wang, Ferroelectrics, 2008, 363, 56–63 CrossRef CAS.
- Q. Zhang, X. L. Liu, Y. Zhang, X. Z. Song, J. Zhu, I. Baturin and J. F. Chen, Ceram. Int., 2015, 41, 3030–3035 CrossRef CAS.
- R. Xu, Q. S. Zhu, J. J. Tian, Y. J. Feng and Z. Xu, Ceram. Int., 2017, 43, 2481–2485 CrossRef CAS.
- A. Pelaiz-Barranco, Y. Mendez-Gonzalez, J. D. S. Guerra, X. C. Wang and T. Q. Yang, J. Adv. Dielectr., 2016, 6, 1620003 CrossRef CAS.
- H. Yu, J. H. Zhang, M. Wei, J. P. Huang, H. W. Chen and C. R. Yang, J. Mater. Sci.: Mater. Electron., 2017, 28, 832–838 CrossRef CAS.
- R. Xu, Z. Xu, Y. J. Feng, H. L. He, J. J. Tian and D. Huang, J. Am. Ceram. Soc., 2016, 99, 2984–2988 CrossRef CAS.
- T. F. Zhang, X. G. Tang, X. X. Huang, Q. X. Liu, Y. P. Jiang and Q. F. Zhou, Energy Technol., 2016, 4, 633–640 CrossRef CAS.
- J. F. Wang, T. Q. Yang, S. C. Chen and G. Li, Mater. Res. Bull., 2013, 48, 3847–3849 CrossRef CAS.
- F. P. Zhuo, Q. Li, Y. Y. Li, J. H. Gao, Q. F. Yan, Y. L. Zhang, X. C. Chu and W. W. Cao, Mater. Res. Express, 2014, 1, 045501 CrossRef.
| This journal is © The Royal Society of Chemistry 2017 |

