DOI:
10.1039/C7RA08620B
(Paper)
RSC Adv., 2017,
7, 44759-44765
Synthesis and luminescence characteristics of fine-sized Ba3Si6O12N2:Eu green phosphor through spray pyrolysis using TEOS/Si3N4 mixed precursors
Received
4th August 2017
, Accepted 12th September 2017
First published on 19th September 2017
Abstract
Fine-sized Ba3Si6O12N2:Eu2+ phosphor powders were synthesized by spray pyrolysis using tetraethyl orthosilicate (TEOS) and Si3N4 nanopowder as Si precursors, and the crystallographic and luminescence characteristics were explored with changing the mole ratio of TEOS to Si3N4. When only Si3N4 was used as the Si precursor, the main phase of the resulting particles was Ba3Si6O9N4 and the Ba3Si6O12N2 phase was formed as an impurity phase. As the TEOS mole fraction increased as the Si precursor, the main phase changed from Ba3Si6O9N4 to Ba3Si6O12N2, and BaSi2O5 was formed as the main phase when the TEOS fraction was 80% or higher. As a result, the excitation and emission intensity were largely affected by changing the TEOS/Si3N4 ratio. Finally, the optimal TEOS/Si3N4 mole ratio was determined as 50/50 in terms of preparing Ba3Si6O12N2:Eu particles having the highest emission through spray pyrolysis. At the TEOS fraction of 50%, the crystallographic form and the emission properties were investigated as the calcination temperature was varied from 700 °C to 1350 °C. It was found that Ba2Si3O8 is generated as an intermediate phase at a calcination temperature of lower than 1200 °C and a pure Ba3Si6O12N2 phase without any impurity phases was obtained at 1300 °C. Based on XRD analysis, a possible formation mechanism of Ba3Si6O12N2:Eu was discussed. The prepared Ba3Si6O12N2:Eu2+ powder exhibited high thermal stability with the thermal activation energy of 0.247 eV and a fine size of less than 1 μm without significant agglomeration.
1. Introduction
Phosphors have been used in various applications including fluorescent lamps, displays, biological diagnostics and white light-emitting diodes (WLEDs).1–4 Phosphors should be designed to have suitable properties to meet the requirements of the application area. In white LEDs, known as the next generation lighting, the luminescence properties of phosphors play a key role in fabricating highly luminescent and efficient products. White LEDs were first commercialized by combining a GaN blue chip with a yellow phosphor (YAG:Ce) due to its simplicity.5–7 The GaN-YAG based white LEDs, however, have drawbacks, like low colour rendering index (CRI).8–10 To solve the problems, many researchers have tried to find new phosphors with excellent thermal quenching properties or new methods to improve the CRI value.11–16 The low CRI problem can be solved by using two phosphors (green and red) with a blue chip or by using three phosphors (blue, green and red) with a near-UV chip.17–20 Thus, the development of new green and red phosphor materials is important for realizing highly efficient white LEDs with good CRI and thermal quenching properties.
Over the last decade, Eu2+-doped nitrides have emerged as new phosphors with excellent luminescent properties.21 Sr2Si5N8:Eu2+ or CaAlSiN3:Eu2+ is a representative example for a highly efficient red phosphor and β-SiAlON:Eu2+ is a good candidate for a green phosphor with high luminescence efficiency and good thermal stability.22–26 These nitride phosphors are frequently synthesized by a solid-state reaction which needs well-controlled synthetic conditions to obtain high phase purity. The synthesis of β-SiAlON:Eu2+ requires high temperature over 1800 °C and high gas pressure.27 Recently, Ba3Si6O15-3/2δNδ:Eu2+ (δ = 6, 4 and 2) have received great attention as a potential green phosphor due to the relatively easier synthesis compared with β-SiAlON:Eu2+ as well as excellent luminescent properties.28 Thus, M3Si6O6N6:Eu2+ (MSi2O2N2:Eu2+, M = Ca, Sr and Ba) has been widely studied for its structure and luminescence characteristics.29,30 Also, Ba3Si6O12N2:Eu2+ (BSON) was reported to have excellent emission properties.31–35 Compared with Ba3Si6O12N2:Eu2+, Ba3Si6O9N4:Eu2+ has relatively lower luminescence intensity and a bad thermal quenching behaviour although its crystal structure is similar.36–38
Ba3Si6O12N2:Eu2+ has been synthesized by means of a solid-state reaction.32,33 Then, the problem frequently encountered is phase purity. That is, some impurities like orthosilicates are formed and significantly decrease the thermal stability and emission intensity. Therefore, more precise synthetic strategy for the solid-state synthesis of Ba3Si6O12N2:Eu2+ is required to achieve high phase purity. There are two ways frequently used for the synthesis of Ba3Si6O12N2:Eu2+. One is the nitridation of Ba3Si6O15:Eu (BaSi2O5:Eu) oxides using NH3 gas at high temperature and high pressure. The other is to use silicon nitride as a solid precursor. For example, Ba3Si6O12N2:Eu2+ can be synthesized by the following solid reaction:34
| |
 | (1) |
However, both methods require complicated apparatus or multi-step processing. In addition, the resulting powder has a size of several tens of micrometers and further post-milling is required to obtain fine powder. Therefore, there is still a need to develop a simple and novel synthesis method for producing a Ba3Si6O12N2:Eu2+ green phosphor having fine size as well as excellent luminescent properties. In this work, for the first time, spray pyrolysis was applied to directly synthesize fine-sized Ba3Si6O12N2:Eu2+ particles using tetraethyl orthosilicate (TEOS) and Si3N4 nanoparticles as the Si precursor. The spray pyrolysis is known to be a powerful synthetic method for the preparation of multi-component oxides like Ba3Si6O12N2:Eu2+.39 According to the eqn (1), the mole ratio controlling of SiO2 to Si3N4 makes it possible to easily change the degree of nitridation. In this work, the mole ratio of TEOS to Si3N4 was varied and the resulting particles were characterized in terms of the crystallographic form and the luminescent properties. Also, the calcination temperature effect was investigated. Finally, optimum synthesis conditions were determined when Ba3Si6O12N2:Eu2+ green phosphor was prepared by spray pyrolysis.
2. Experimental
For the preparation of Ba3Si6O12N2:Eu2+, barium nitrate (Ba(NO3)2, Aldrich 99%), silicon nitride (Si3N4, Aldrich 98.5%) nanoparticle, tetraethyl orthosilicate (TEOS, Aldrich, 98%) and europium oxide (High purity Co., 99.99%) were used as the starting materials. All precursors were used without further purification. Ba3Si6O12N2:Eu2+ was synthesized by an ultrasonic spray pyrolysis process consisting of an ultrasonic nebulizer (1.7 MHz), a quartz tube (ID = 55 mm and length = 1200 mm), an electrical furnace and a Teflon bag filter.
In the spray solution, the total concentration was 0.2 M and the Eu content (x) was fixed at x = 0.3 in (Ba3−x, Eux)Si6O12N2. The total Si quantity stoichiometrically needed is 3 times of the Ba/Eu moles. The required Si moles were adjusted with using TEOS and Si3N4 nanoparticles. Then, the mole fraction of TEOS to Si3N4 was changed from 0.0 to 1.0 in order to control the quantity of N elements in Ba3Si6O15-3/2δNδ:Eu2+. To prepare the spray solution, Eu2O3 and TEOS were first dissolved with nitric acid in 300 mL purified water (aqueous solution). Thereafter, Ba(NO3)2 was added to the above solution. In another beaker having 100 mL of water, Si3N4 nanoparticles were added and followed by an ultrasonic treatment for 10 min in order to the homogeneous dispersion of aggregated nanoparticles. This Si3N4 colloidal solution was mixed with the aqueous solution, and the total volume was adjusted to be 500 mL by adding purified water. The precursor droplets generated by the ultrasonic nebulizer were transferred to a quartz reactor maintained at 900 °C by air (30 L min−1). The resulting particles were withdrawn by a Teflon bag filter and followed by the calcination for 3 h under flowing the 5% H2/N2 mixed gas (400 mL min−1). The calcination temperature was changed from 700 °C to 1350 °C.
The crystallographic form was analysed by the X-ray diffraction (XRD, Rigaku, MiniFlex600) measurement. The excitation and emission spectra were obtained by using a fluorescence spectrometer (Perkin Elmer LS 55). Also, the emission spectrum was monitored in the temperature range from room temperature to 200 °C in order to evaluate the thermal quenching behaviour of the prepared Ba3Si6O12N2:Eu2+ phosphor. The morphology of the power was monitored by scanning electron microscopy (SEM, Hitachi S4800). The weight increase of Si3N4 nanoparticles was monitored by a thermos gravimetric analyser (TGA) under flowing air.
3. Results and discussion
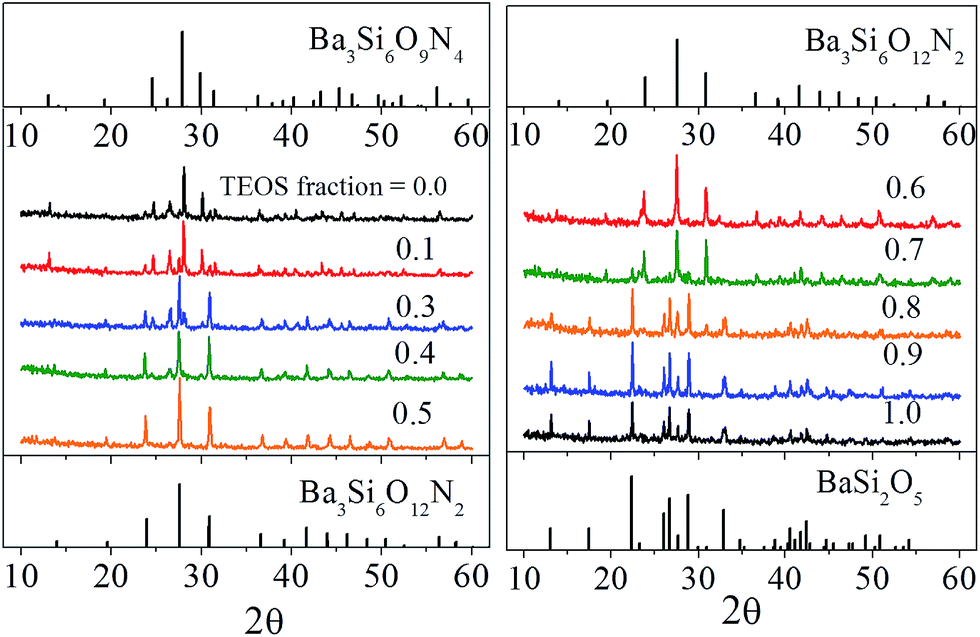
Fig. 1 is the result of X-ray diffraction analysis of Ba3Si6O15-3/2δNδ:Eu2+ phosphor prepared by changing the TEOS mole fraction. All the samples were calcined at 1300 °C. When the molar fraction of TEOS was 0.0 (100% Si3N4), the observed peaks are well matched with the trigonal structure (JCPDS # 01-075-5732) of Ba3Si6O9N4 (δ = 4), and Ba3Si6O12N2 (ICSD # 42-1322) was formed as an impurity phase. As the molar fraction of TEOS increases, the Ba3Si6O9N4 phase peaks become gradually weaker and the Ba3Si6O12N2 phase peaks becomes more pronounced. Nearly pure Ba3Si6O12N2 phase was observed at the TEOS mole fraction of 0.5. BaSi2O5 phase is formed as an impurity when the molar fraction of TEOS was 0.7 and becomes the main phase when the TEOS mole fraction is 0.8 or more. Given this, the nitrogen content (δ) in Ba3Si6O15-3/2δNδ:Eu2+ phosphor prepared by spray pyrolysis was confirmed to be readily controllable from δ = 0 to δ = 4 via simply changing the TEOS fraction in the precursor solution.
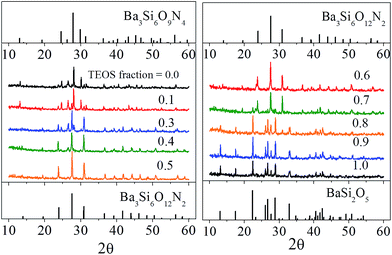 |
| | Fig. 1 XRD diffraction pattern of Ba3Si6O15-3/2δNδ:Eu2+ prepared by changing the mole fraction (shown in the figure) used as a Si precursor. | |
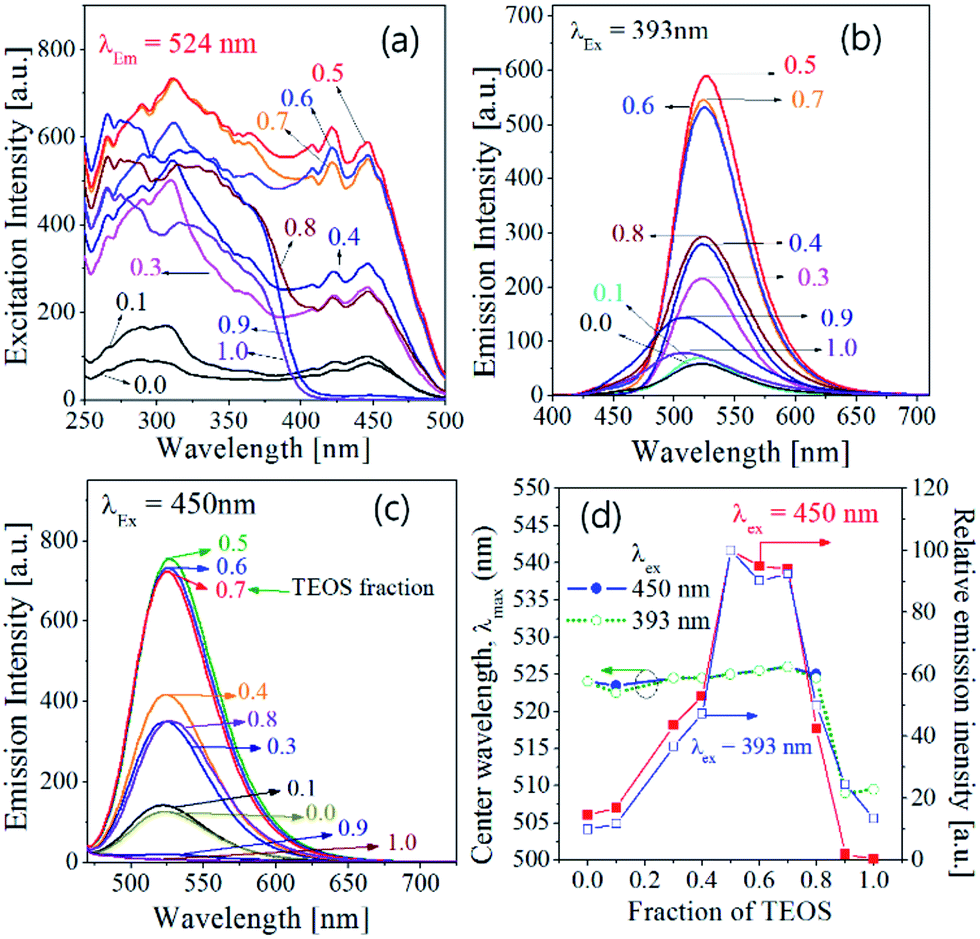
Fig. 2 shows the excitation and emission spectra of Ba3Si6O15-3/2δNδ:Eu2+ phosphor prepared with changing of TEOS mole fraction. The excitation bands observed are typically due to the 4f7 → 4f65d transition of Eu2+ and largely influenced by the TEOS fraction. Compared with the BaSi2O5:Eu phosphor prepared using 100% TEOS as the Si precursor, both Ba3Si6O9N4:Eu and Ba3Si6O12N2:Eu exhibit a much stronger excitation band at the wavelength range from 400 nm to 500 nm. Ba3Si6O12N2:Eu is known to have better excitation and emission properties compared with Ba3Si6O9N4:Eu. The phosphors prepared at TEOS molar fractions of 0.0 and 0.1 had Ba3Si6O9N4 as the main phase and exhibited low excitation characteristics in the wavelength range of 250 to 470 nm. On the other hand, the phosphors having Ba3Si6O12N2 as the main phase, which were achieved when TEOS molar fraction was 0.3 to 0.7, show the high excitation intensity between 400 nm and 500 nm. When the TEOS mole fraction was 0.8, the prepared phosphor powder had a mixed phase of Ba3Si6O12N2 and BaSi2O5, so that the excitation strength between 400 nm and 500 nm was greatly reduced again. The emission spectra measured at 393 nm and 450 nm were shown in Fig. 2(b) and (c), respectively. The prepared Ba3Si6O15-3/2δNδ:Eu2+ phosphors show a broad band emission due to the 5d → 4f transition of Eu2+. Regardless of the excitation wavelengths, the emission intensity is largest at the TEOS fraction (0.5) at which nearly pure Ba3Si6O12N2:Eu2+ is prepared. The emission wavelength and relative emission intensity were shown in Fig. 2(d) as a function of the TEOS fraction. There is no difference in the center wavelength of both emission spectra measured under the excitation of 393 or 450 nm light. The emission wavelength was slightly increased from 523 nm to 527 nm by increasing the TEOS fraction increases up to 0.7, which is due to the crystal phase change from Ba3Si6O9N4 to Ba3Si6O12N. When the TEOS fraction was 0.8 or larger, the emission showed a blue shift and the emission intensity largely decreases because the dominant crystal phase of the phosphor particles is turned into BaSi2O5.
 |
| | Fig. 2 Luminescence properties of Ba3Si6O15-3/2δNδ:Eu2+ phosphor prepared by changing TEOS mole fraction: excitation spectra (a), emission spectra (b and c), emission wavelength and relative emission intensity (d). | |
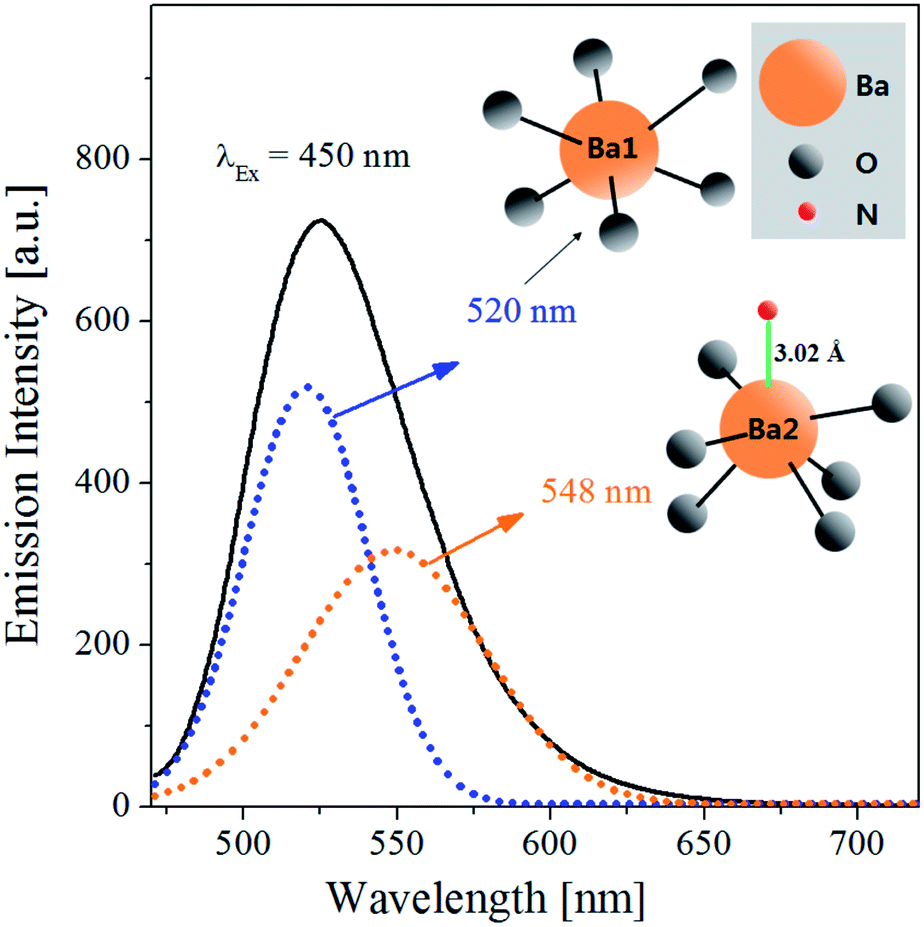
The emission spectrum (λex = 450 nm) of Ba3Si6O12N2:Eu2+ prepared by spray pyrolysis at the TEOS mole fraction of 0.5 was deconvoluted into Gaussian components to compare the emission sites, and the resulting spectra were shown in Fig. 3. The emission spectrum of Ba3Si6O12N2:Eu2+ can be well deconvoluted into two intense peaks: one is observed at 520 nm and the other is observed at 548 nm. In Eu2+-doped barium silicate or oxonitridosilicate phosphors, the emission is influenced by the crystallographic characteristics of Ba2+ sites substituted by Eu2+ ions. Ba3Si6O12N2 has a trigonal structure with the ring sheet composed of 8-membered Si–(O,N) and 12-membered Si–O rings, and the Ba2+ ions are located between the corrugated layers formed by corner sharing SiO3N tetrahedron.38 The coordination environments around Ba sites in Ba3Si6O12N2 were shown in the inset of Fig. 3. There are two Ba2+ sites (Ba1 and Ba2) substituted by Eu2+ ions in the Ba3Si6O12N2 host. The Ba1 sites are bonding with only six oxygen atoms, whereas the Ba2 sites are bonding with one nitrogen and six oxygen atoms. The emission due to the 5d → 4f transition of Eu2+ is influenced by the crystal field strength or the covalency of Eu2+-substituted emission sites. The emission band due to the 5d → 4f transition of Eu2+ shifts to longer wavelength as the crystal field strength or the covalency increases.40 Resultantly, in long wavelength, oxynitride or nitride phosphors have better excitation characteristics than oxides because of the stronger covalency due to ligand N3− ions. In Ba3Si6O12N2:Eu2+, the covalency of Eu2+ ions substituted in the Ba2 sites is larger than the other. Thus, the Gaussian peaks at 520 nm and 548 nm are due to the Eu2+ ions substituted into the Ba1 and the Ba2 sites, respectively.
 |
| | Fig. 3 Emission spectrum (λex = 450 nm) of Ba3Si6O9N4:Eu2+ prepared by spray pyrolysis at the TEOS mole fraction of 0.5. The dot lines were obtained by Gaussian deconvolution. The inset schematic diagram is the coordination environment of Ba sites in Ba3Si6O12N2. | |
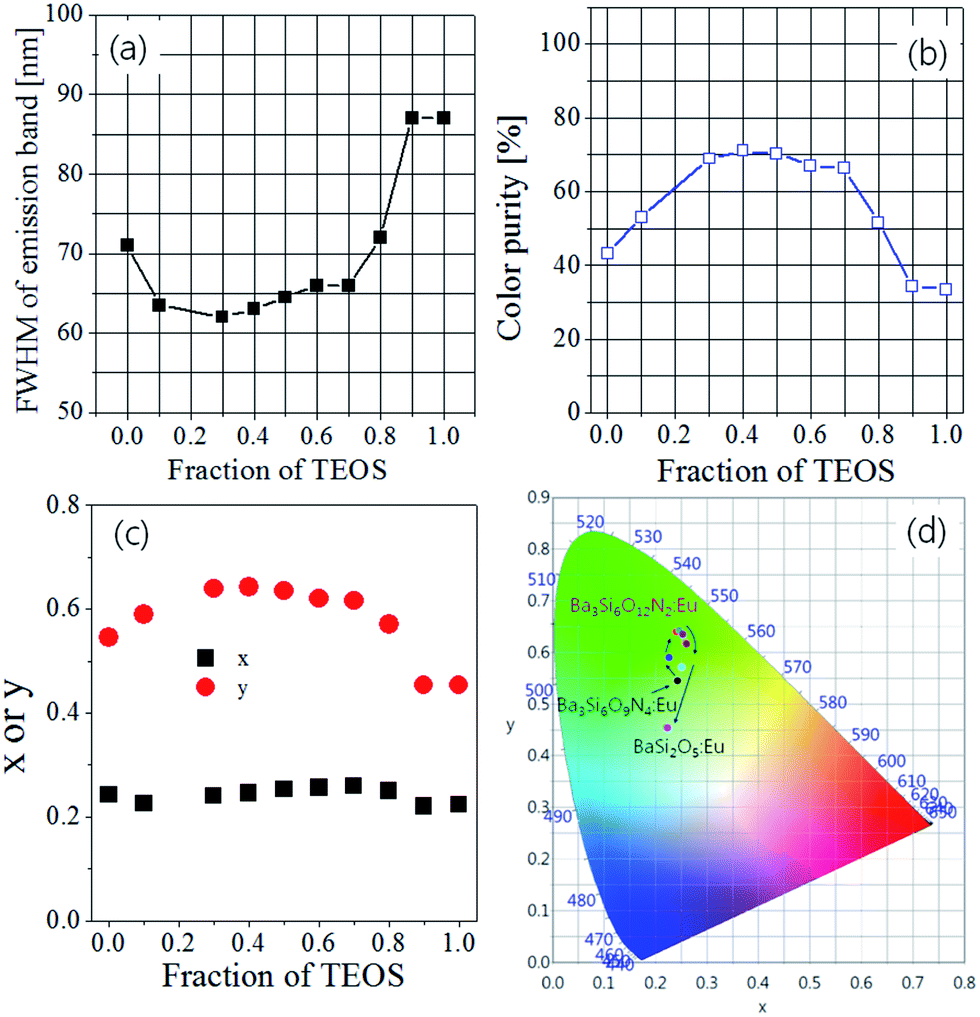
As the TEOS mole fraction was changed, the FWHM (full width at half maximum) values, colour purity and CIE chromatic coordinates were estimated from the emission spectra obtained under excitation at 393 nm, and the results were shown in Fig. 4. When 100% Si3N4 nanoparticles were used as the Si precursor (TEOS fraction = 0), Ba3Si6O9N4:Eu was formed as the main crystal phase, and its FWHM and colour purity are 71 nm and 43%, respectively. As the TEOS fraction increases, the FWHM decreases and reaches the smallest value (63 nm) at 0.3. This is because the main crystal phase is changed from Ba3Si6O9N4 to Ba3Si6O12N2. The highest colour purity (71%) was observed at the TEOS fraction of 0.4. When the TEOS fraction is larger than 0.7, the FWHM values sharply increase and the color purity steeply decreases because of the formation of BaSi2O5 as a minor or major phase. In colour coordinates, no significant change in x value was observed with a change in TEOS mole fraction. On the other hand, the y value increases with increasing TEOS mole fraction and reaches the maximum value at TEOS mole fraction of 0.4. From the results obtained so far, it has been found that the nitrogen content (δ) of the Ba3Si6O15-3/2δNδ:Eu2+ phosphor prepared by the spray pyrolysis method can be easily controlled by changing the mole ratio of TEOS/Si3N4 as the Si precursor. From the viewpoint of colour purity and luminescence intensity, it is appropriate to use 50% each of TEOS and Si3N4 as a Si precursor in order to obtain Ba3Si6O12N2:Eu2+ with good luminescence characteristics by spray pyrolysis.
 |
| | Fig. 4 (a) FWHM, (b) colour purity, (c) colour coordinates and (d) CIE colour diagram for Ba3Si6O15-3/2δNδ:Eu2+ phosphors prepared by varying TEOS mole fraction. | |
Under the assumption that the Ba(NO3)2 and TEOS precursors are turned into BaO and SiO2 by the pyrolysis at 900 °C or the post-thermal treatment, the theoretical reaction can be written by the follow:
| |
 | (2) |
where
a and
b are controlled by changing the TEOS fraction (
x) of the total Si precursor and should have the stoichiometric relation,
a + 3
b = 6. Then, the TEOS fraction is equal to
a/6. For example,
a = 3.0 and
b = 1.0 when 50% TEOS is used as the Si precursor. From the reaction
eqn (2), the O/N ratio becomes 6.0 when
a = 4.5 and
b = 0.5. That is, to obtain Ba
3Si
6O
12N
2:Eu
2+, the TEOS fraction stoichiometrically needed is 75% (
a = 4.5 and
b = 0.5). In experimental results, however, the TEOS fraction for obtaining pure Ba
3Si
6O
12N
2:Eu
2+ was 50% (
a = 3 and
b = 1). That is, the quantity of Si
3N
4 is twice of the theoretical requirement. Therefore, 50% of the initially used Si
3N
4 precursor nanoparticles should be oxidized before involving in the formation of Ba
3Si
6O
12N
2:Eu
2+ during the spray pyrolysis or the post-thermal treatment. To see the oxidization behaviour of Si
3N
4 nanoparticles, TGA analysis under flowing air was carried out, and the result was shown in
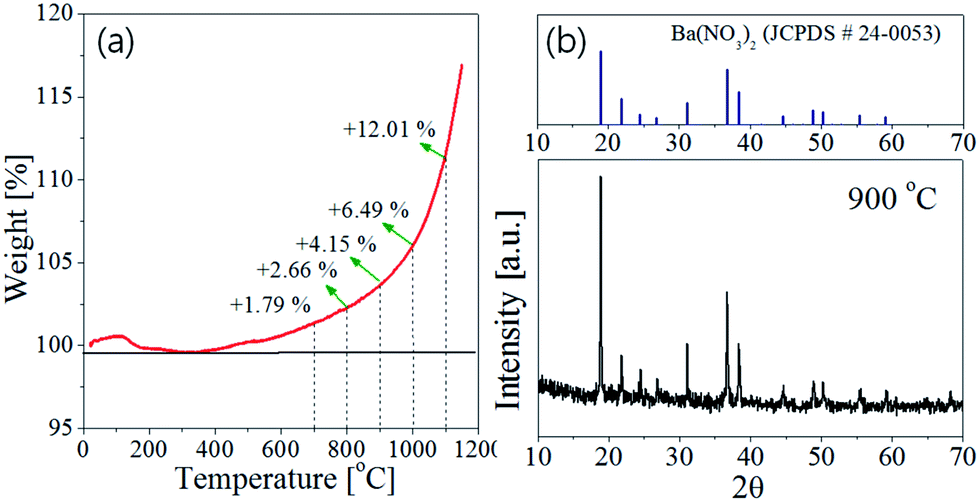
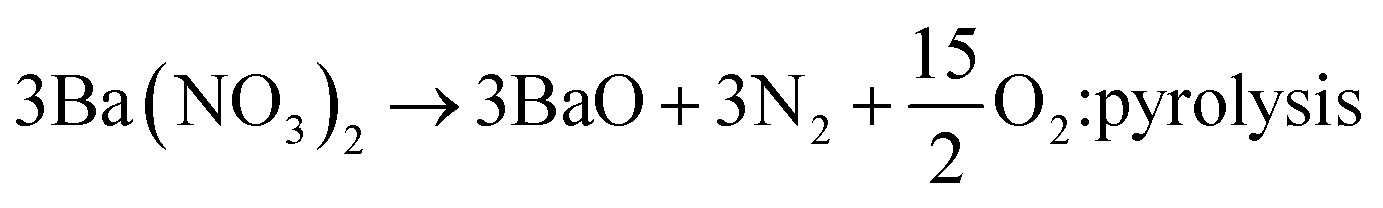
Fig. 5(a). Also, the XRD result of the precursor power was shown in
Fig. 5(b). The TGA data indicates that the oxidation begins at about 380 °C and the weight increases exponentially with elevating temperature. According to the XRD analysis (
Fig. 5(b)), the Ba(NO
3)
2 precursor seems to be partially decomposed to BaO in the spray pyrolysis step. As a result, the barium nitrate crystals still exist in the as-prepared precursor powder. During the post-thermal calcination, the barium nitrate will be decomposed to produce a lot of oxygen molecules. These oxygen molecules can be involved in the further oxidation of Si
3N
4. If Si
3N
4 is oxidized to SiO
2 (Si
3N
4+ 3O
2 → 3SiO
2), the maximum weight increment should be about 28.49%. When the mole fraction of Si
3N
4 oxidized to SiO
2 is defined as
x, the oxidation reaction of Si
3N
4 in the spray pyrolysis or post-thermal treatment steps can be expressed by the following reaction:
| | |
Si3N4(s) + 3xO2(g) → 3xSiO2(s) + (1−x)Si3N4(s) + 2xN2(g)
| (3) |
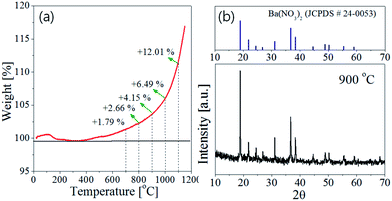 |
| | Fig. 5 (a) TGA curve of Si3N4 nanoparticles under flowing air and (b) XRD pattern of precursor powder prepared at the TEOS fraction of 0.5 (the inset temperature indicates the preparation temperature in the spray pyrolysis step). | |
Then, the percentage (Y) of weight increment via the oxidation can be expressed as the following relation:
| |
 | (4) |
| |
 | (5) |
where
M1 and
M2 are molecular weight of SiO
2 (60.08) and Si
3N
4 (140.28), respectively. The spray pyrolysis was operated 900 °C under flowing air. Thus, Si
3N
4 nanoparticles should be oxidized. In the TGA data for the oxidation of Si
3N
4 nanoparticles, the weight increment (
Y) at 900 °C is about 4.15% and the
x value obtained from the
eqn (4) is 0.146. Therefore, it is surmised that the oxidation of Si
3N
4 to SiO
2 occurs about 15% in the spray pyrolysis step and about 35% in the post-thermal treatment step.
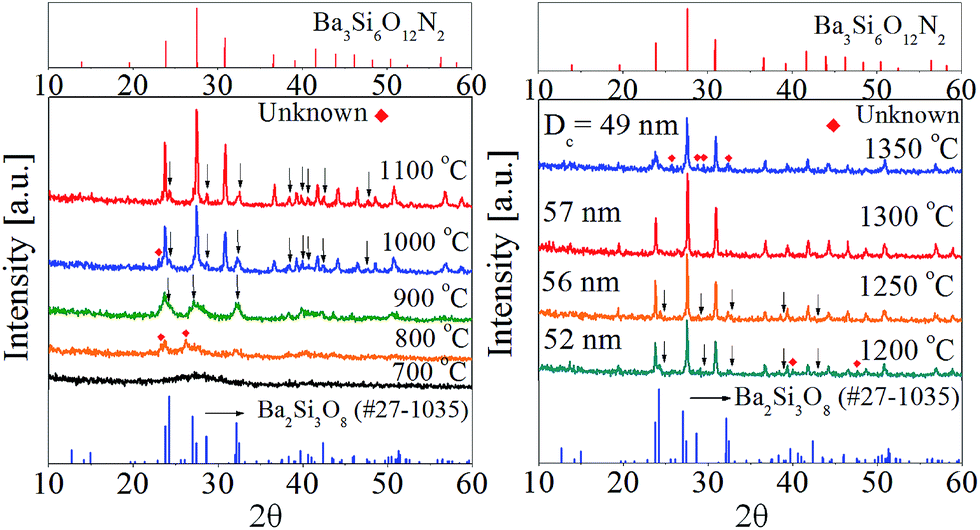
To identify the intermediate during the post-thermal treatment, the XRD analysis for the precursor powder prepared at the TEOS fraction of 0.5 were carried out with changing the calcination temperature. The resulting XRD patterns were shown in Fig. 6. Small unknown peaks are formed at 800 °C and Ba2Si3O8 crystals appear at 900 °C. When the calcination temperature is 1000 °C or higher, Ba3Si6O12N2 is produced as the major phase and Ba2Si3O8 exists as an impurity phase up to 1250 °C. At 1300 °C, the powder has nearly pure Ba3Si6O12N2 phase. From the XRD result, it is clear that Ba2Si3O8 is generated as the intermediate before the formation of Ba3Si6O12N2. Considering that 50% of Si3N4 is oxidized to SiO2 and involved in forming Ba2Si3O8, the formation path of Ba3Si6O12N2 can be written by the following reactions:
| |
 | (6) |
| | |
3TEOS → 3SiO2:pyrolysis
| (7) |
| | |
Si3N4 + 1.5O2 → 0.5Si3N4 + 1.5SiO2 + N2:oxydation
| (8) |
| | |
3BaO + 4.5SiO2 → 1.5Ba2Si3O8
| (9) |
| |
 | (10) |
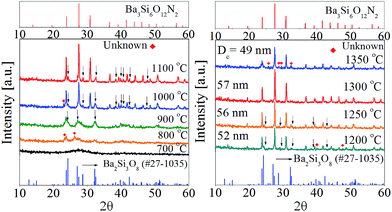 |
| | Fig. 6 XRD patterns with changing the calcination temperature for the precursor powder prepared at the TEOS fraction of 0.5. | |
As the same manner, when no TEOS is used, the formation of Ba3Si6O9N4:Eu2+ is well explained if 50% of Si3N4 is assumed to be oxidized to SiO2 during the spray pyrolysis or post-thermal treatment steps.
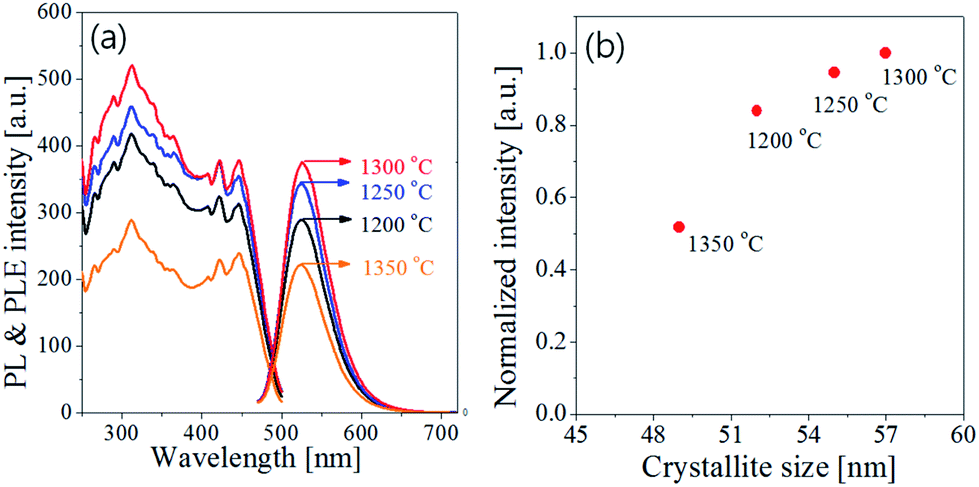
Fig. 7 shows the emission and excitation spectra with changing the calcination temperature for Ba3Si6O12N2:Eu2+ particles prepared at the TEOS fraction of 0.5. There is no significant change in the emission peak position or the excitation band shape. This result reflects the main crystal phase in the temperature window of 1200–1350 °C is Ba3Si6O12N, which is in good agreement with the XRD data shown in Fig. 6(b). The emission intensity under the excitation of 450 nm blue light was enhanced by increasing the calcination temperature up to 1300 °C. In general, the emission of phosphor particles is affected by the crystallinity and the phase purity. Crystallinity of a solid can be evaluated from its crystallite size. The larger the crystallite size, the higher the crystallinity. The crystallite size at each temperature was calculated by using the Scherrer equation and the resulting sizes were inserted in Fig. 6(b). The crystallite sizes are 52 nm, 56 nm and 57 nm at 1200 °C, 1250 °C and 1300 °C, respectively. At 1350 °C, the crystallite size (49 nm) was smaller than other temperature. There are weak Ba2Si3O8 peaks at 1200 °C and 1250 °C. Also, unknown impurities were observed at 1350 °C. Fig. 7(b) is the normalized emission intensity as a function of the crystallite size. Clearly, the emission intensity largely depends on the crystallite size of Ba3Si6O12N2:Eu2+. At 1300 °C, the crystallite size is largest and nearly pure Ba3Si6O12N phase is formed. Thus, the increase of the emission intensity as the calcination temperature increase up to 1300 °C is due to the increase in crystallinity and phase purity. The large reduction of the emission intensity at 1350 °C is ascribed to the formation of unknown impurities and the reduction of crystallinity. From this result, it was concluded that the optimum calcination temperature is 1300 °C.
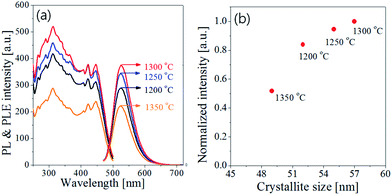 |
| | Fig. 7 (a) Emission/excitation spectra and (b) normalized intensity as a function of crystallite size for Ba3Si6O12N2:Eu particles prepared at the TEOS fraction of 0.5 and by changing the calcination temperature. | |
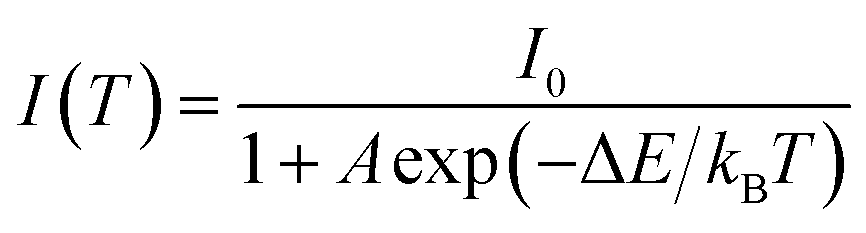
The thermal quenching behaviour of LED phosphors is important on the fabrication of high-power white LEDs. Fig. 8 shows the temperature dependence of Ba3Si6O12N2:Eu2+ prepared at the TEOS fraction of 0.5 and calcined at 1300 °C. The emission intensity decreases steadily with increasing the measuring temperature. The emission peak shows a blue shift with increasing the temperature, which is explained by the thermally induced lift up of the lowest 5d energy levels. The emission intensity at 200 °C is 78% of that at room temperature. To explain the temperature quenching mechanism, a simple configuration coordinate diagram was displayed in Fig. 8(c). In general, the emission of phosphor is achieved by the radiative transition of the photo-excited electrons from the lowest 5d energy level to the ground state, which is corresponding to the path of (1) → (2) → (3) in Fig. 8(c). When phosphors are heated, the phonon vibration becomes stronger and some electrons at the lowest 5d energy state (B position in Fig. 8(c)) are activated to the state C by absorbing the phonon energy. Thereafter, photo-excited electrons at the state C go back to the ground state via a non-radiative relaxation. As a result, some of the photo-excited electrons return to the ground state without emission, which leads to a gradual decrease in emission intensity as the temperature increases. The dependence of the emission intensity on the temperature is expressed by the following equation:17
| |
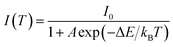 | (11) |
where
I0 is the emission intensity at room temperature,
A is a constant,
T is the measuring temperature in Kelvin,
kB is the Boltzmann constant (8.61733 × 10
−5 eV K
−1) and Δ
E is the activation energy for thermal quenching. The larger the Δ
E value, the better the thermal stability. That is, a phosphor having a large Δ
E value has a higher thermal barrier so that the luminescence quenching occurs at a high temperature. The activation energy can be estimated from the slope of the plot of ln[
I0/
I − 1]
versus 1/
T. As shown in
Fig. 8(d), the slope is about −2870.32 and the resulting Δ
E is about 0.247 eV. The measured activation energy is similar with the Δ
E value (0.235–257 eV) of Ba
3Si
6O
12N
2:Eu
2+ prepared by a solid-state route
34,41 and slightly lower than the Δ
E value (0.32 eV) of SrSi
2ON
2:Eu
2+.
30
 |
| | Fig. 8 Temperature dependence of Ba3Si6O12N2:Eu: (a) emission spectra, (b) emission intensity, (c) configuration coordination diagram and (d) ln(I0/I − 1) versus 1/T plot. | |
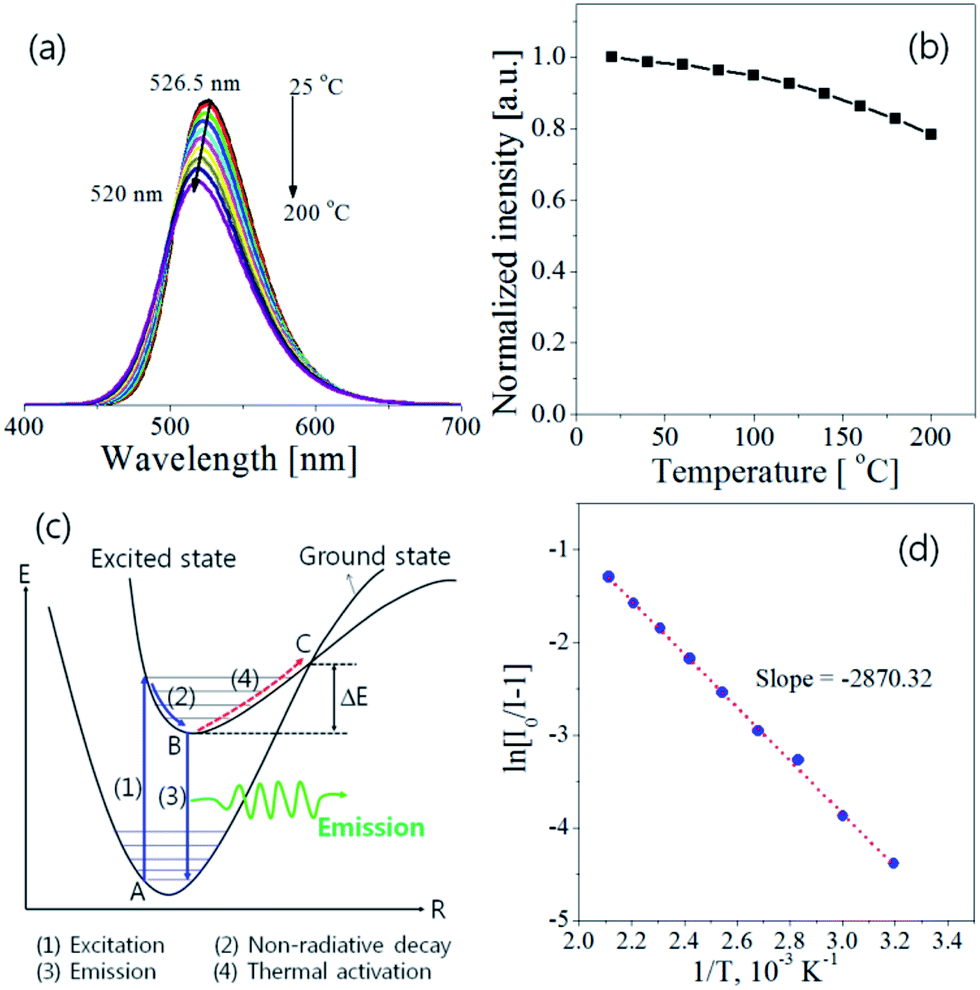
Finally, the particle size and morphology were monitored by the SEM analysis, and the resulting was shown in Fig. 9. The as-prepared particles show spherical morphology, which is because one particle is generated from one droplet in spray pyrolysis. During the post thermal treatment, the as-prepared particles undergo several solid-phase reactions including pyrolysis of Ba(NO3)2, oxidation of Si3N4, formation of Ba2Si3O8 and crystallization to Ba3Si6O12N2. As a result, the resulting Ba3Si6O12N2:Eu2+ particles have an irregular shape after the calcination at 1300 °C. The prepared powder shows fine size of less than 1 μm and there is no significant agglomeration between particles. From this result, the spray pyrolysis was confirmed to produce fine-sized Ba3Si6O12N2:Eu2+ green phosphors with good luminescent characteristics.
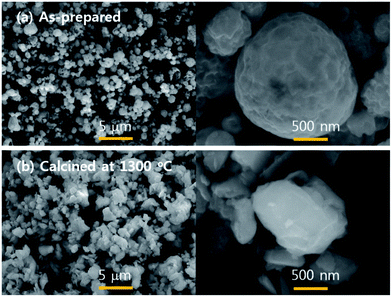 |
| | Fig. 9 SEM photos of Ba3Si6O12N2:Eu2+ particles prepared by the spray pyrolysis. | |
4. Conclusions
Spray pyrolysis was applied to prepare of Ba3Si6O12N2:Eu2+ particles. The crystallographic form and the luminescence properties were investigated by changing the fraction of TEOS to Si3N4. When 100% Si3N4 nanoparticles were used as the Si precursor, Ba3Si6O9N4:Eu2+ was formed and Ba3Si6O12N2 appeared as an impurity. As the TEOS mole fraction increased as the Si precursor, the main phase changed from Ba3Si6O9N4 to Ba3Si6O12N2, and BaSi2O5 was formed as the main phase when the TEOS fraction was 80% or larger. Pure Ba3Si6O12N2 phase was achieved by using 50% TEOS as the Si precursor, which is twice the theoretical requirement. This result indicated that about 50% of Si3N4 added in the precursor solution was oxidized to SiO2 by air during spray pyrolysis and oxygen generated by decomposition of Ba(NO3)2 during the post-thermal treatment. According to XRD analysis, Ba2Si3O8 was generated as an intermediate phase and pure Ba3Si6O12N2:Eu2+ was obtained at 1300 °C. Based on these results, a possible formation mechanism was suggested when Ba3Si6O12N2:Eu2+ was synthesized by spray pyrolysis. The prepared Ba3Si6O12N2:Eu2+ powder showed good thermal stability with a high thermal activation energy of 0.247 eV and was found to have a fine size of less than 1 μm without significant agglomeration. Thus, the fine-sized Ba3Si6O12N2:Eu2+ powder produced by spray pyrolysis is expected to be potentially applicable as a green phosphor of white LEDs.
Conflicts of interest
There are no conflicts to declare.
Acknowledgements
This work was supported by the research grant of the Kongju National University in 2016.
Notes and references
- C. Feldmann, T. Jüstel, C. R. Ronda and P. J. Schmit, Adv. Funct. Mater., 2003, 13, 511–516 CrossRef CAS.
- J. Kaur, Y. Parganiha, V. Dubey and D. Singh, Res. Chem. Intermed., 2014, 40, 2837–2858 CrossRef CAS.
- H. Lin, B. Wang, J. Xu, R. Zhang, H. Chen, Y. Yu and Y. Wang, ACS Appl. Mater. Interfaces, 2014, 6, 21264–21269 CAS.
- P. F. Smet, J. Botterman, K. Van den Eeckhout, K. Korthout and D. Poelman, Opt. Mater., 2014, 36, 1913–1919 CrossRef CAS.
- J. Zhou, F. Huang, H. Lin, Z. Lin, J. Xu and Y. Wang, J. Mater. Chem. C, 2016, 4, 7601–7606 RSC.
- Y. Kim, K. B. Shim, M. Wu and H.-K. Jung, J. Alloys Compd., 2017, 693, 40–47 CrossRef CAS.
- I. Pricha, W. Rossner and R. Moos, J. Am. Ceram. Soc., 2016, 99, 211–217 CrossRef CAS.
- H. S. Jang, W. B. Im, D. C. Lee, D. Y. Jeon and S. S. Kim, J. Lumin., 2007, 126, 371–377 CrossRef CAS.
- V. Bachmann, C. Ronda and A. Meijerink, Chem. Mater., 2009, 21, 2077–2084 CrossRef CAS.
- M. Kottaisamy, P. Thiyagarajan, J. Mishra and M. S. Ramachandra Rao, Mater. Res. Bull., 2008, 43, 1657–1663 CrossRef CAS.
- X. Yang, Z. Wang, S. Madakuni, J. Li and G. E. Jabbour, Appl. Phys. Lett., 2008, 93, 193305 CrossRef.
- K. Han, S. H. Lee, Y. G. Choi, W. B. Im and W. J. Chung, J. Non-Cryst. Solids, 2016, 445–446, 77–80 CrossRef CAS.
- C. Ruan, X. Bai, C. Sun, H. Chen, C. Wu, X. Chen, H. Chen, V. L. Colvin and W. W. Yu, RSC Adv., 2016, 6, 106225–106229 RSC.
- M. C. Maniquiz, K. Y. Jung and S. M. Jeong, J. Electrochem. Soc., 2011, 158, H697–H703 CrossRef CAS.
- J. H. Kim and K. Y. Jung, J. Lumin., 2012, 132, 1376–1381 CrossRef CAS.
- R.-J. Xie, N. Hirosaki and M. Mitomo, Appl. Phys. Lett., 2006, 89, 241103 CrossRef.
- R.-J. Xie, N. Hirosai, N. Kiura, K. Sakuma and M. Mitomo, Appl. Phys. Lett., 2007, 90, 191101 CrossRef.
- S. Pimputkar, J. S. Speck, S. P. DenBaars and S. Nakamura, Nat. Photonics, 2009, 3, 180–182 CrossRef CAS.
- R. Mueller-March, G. Mueller, M. R. Krames, H. A. Höppe, F. Stadler, W. Schnick, T. Juestel and P. Schmidt, Phys. Status Solidi C, 2005, 202, 1727–1732 CrossRef.
- S. Ye, F. Xiao, Y. X. Pan, Y. Y. Ma and Q. Y. Zhang, Mater. Sci. Eng., R, 2010, 71, 1–34 CrossRef.
- R.-J. Xie and N. Hirosaki, Sci. Technol. Adv. Mater., 2007, 8, 588–600 CrossRef CAS.
- X. Piao, T. Horikawa, H. Hanzawa and K.-I. Machida, Appl. Phys. Lett., 2006, 88, 161908 CrossRef.
- T. Suehiro, R.-J. Xie and N. Hirosaki, Ind. Eng. Chem. Res., 2014, 53, 2713–2717 CrossRef CAS.
- H. S. Kim, K.-I. Machida, T. Horikawa and H. Hanzawa, J. Alloys Compd., 2015, 633, 97–103 CrossRef CAS.
- Z. Wang, W. Ye, I.-H. Chu and S. P. Ong, Chem. Mater., 2016, 28, 8622–8630 CrossRef CAS.
- Y. Xing, Y. Zhu, C. Chang, Y. Wang and Y. Wang, J. Mater. Sci.: Mater. Electron., 2017, 28, 9460–9470 Search PubMed.
- H. Wang, Z. Yang, Z. Wang, X. Dong, D. Wei, Z. Li and M. Tian, RSC Adv., 2017, 7, 32982–32988 RSC.
- G. Chen, W. Zhuang, Y. Hu, Y. Liu, R. Liu and H. He, J. Mater. Sci.: Mater. Electron., 2013, 24, 2176–2181 CrossRef CAS.
- M. Seibald, T. Rosenthal, O. Oeckler and W. Schnick, Crit. Rev. Solid State Mater. Sci., 2014, 39, 215–229 CrossRef CAS.
- W. Lü, M. Jiao, B. Shao, L. Zhao and H. You, Inorg. Chem., 2015, 54, 9060–9065 CrossRef PubMed.
- C. Braun, M. Seibald, S. L. Börger, O. Oeckler, T. D. Boyko, A. Moewes, G. Miehe, A. Tücks and W. Schnick, Chem.–Eur. J., 2010, 16, 9646–9657 CrossRef CAS PubMed.
- J. Tang, J. Chen, L. Hao, X. Xu, W. Xie and Q. Li, J. Lumin., 2011, 131, 1101–1106 CrossRef CAS.
- Y. H. Song, T. Y. Choi, K. Senthil, T. Masaki and D. H. Yoon, Mater. Lett., 2011, 65, 3399–3401 CrossRef CAS.
- W. Li, R.-J. Xie, T. Zhou, L. Liu and Y. Zhu, Dalton Trans., 2014, 43, 6132–6138 RSC.
- C. Li, H. Chen and S. Xu, Optik, 2015, 126, 499–502 CrossRef CAS.
- H.-G. Kim, E.-H. Kang, B.-H. Kim and S.-H. Hong, Opt. Mater., 2013, 35, 1279–1282 CrossRef CAS.
- M. Mikami, Opt. Mater., 2013, 35, 1958–1961 CrossRef CAS.
- B. Bertrand, S. Poncé, D. Waroquiers, M. Stankovski, M. Giantomassi, M. Mikami and X. Gonze, Phys. Rev. B: Condens. Matter Mater. Phys., 2013, 88, 075136 CrossRef.
- B. H. Min, J. C. Lee, K. Y. Jung, D. S. Kim, B.-K. Choi and W.-J. Kang, RSC Adv., 2016, 6, 81203–81210 RSC.
- M. Mikami and N. Kijima, Opt. Mater., 2010, 33, 145–148 CrossRef CAS.
- G. Chen, W. Zhuang, Y. Hu, Y. Liu, R. Liu and H. He, J. Rare Earths, 2013, 31, 113–118 CrossRef CAS.
|
| This journal is © The Royal Society of Chemistry 2017 |
Click here to see how this site uses Cookies. View our privacy policy here. 
 Open Access Article
 This Open Access Article is licensed under a Creative Commons Attribution-Non Commercial 3.0 Unported Licence
 *
*