 Open Access Article
Creative Commons Attribution 3.0 Unported Licence
Adsorption of Cu(II) ions in aqueous solution by aminated lignin from enzymatic hydrolysis residues
Jun Xuab,
Shiyun Zhu a,
Peng Liua,
Wenhua Gaoa,
Jun Li
 *a and
Lihuan Moa
aState Key Laboratory of Pulp and Paper Engineer, South China University of Technology, Guangzhou, Guangdong 510640, China. E-mail: ppjunli@scut.edu.cn
bKey Laboratory of Pulp and Paper Science & Technology of Ministry of Education of China, Qilu University of Technology, Jinan, Shandong 250353, China
First published on 19th September 2017
Abstract
Aminated lignin (AL) has been prepared by a Mannich reaction for the removal of Cu(II) ions from aqueous solution. Effects of pH, reaction temperature, reaction time and the initial concentration of Cu(II) ions on the adsorption capacity were investigated. The structure and properties of AL were analyzed by Fourier transform infrared spectroscopy (FT-IR), scanning electron microscopy analysis (SEM), and X-ray photoelectron spectroscopy analysis (XPS). Adsorption kinetic and isotherm models were used to illustrate the adsorption behaviors of AL. AL was more effective than enzymatic hydrolysis residues (EHR) and separated lignin (SL) in removing Cu(II) ions in aqueous solution. The adsorption capacity of AL for Cu(II) ions was better in near-neutral pH. Under the optimum adsorption conditions, the adsorption capacity of AL could reach up to 37.14 mg g−1. The pseudo-second-order model fitted the kinetic data well. The adsorption isotherm was well described by the Langmuir isotherm model. AL exhibited a good adsorption performance for recovery after three cycles. AL could be utilized as a kind of promising feedstock for high value-added products to remove Cu(II) ions in wastewater effectively.
1. Introduction
Cellulosic ethanol from lignocellulosic biomass like corn stalks, which are abundant and renewable resources, is considered as a feasible replacement of fossil fuel for transportation. The processing of cellulosic ethanol includes mechanical pretreatment, enzymatic hydrolysis and fermentation.1 Therefore, EHR are produced as by-products simultaneously, which are mainly used as low-grade fuel to recover part of the energy cost but cause certain pollution to the environment.2In addition, heavy metal ions have been excessively released into the environment due to rapid industrialization, which created a major global concern.3 Heavy metal ions are typical contaminants which generate serious problems to all bodies from the aqueous medium as they are bio-accumulative and non-biodegradable.4 Current techniques for the removal of toxic metals from an aqueous system have been developed for a long period, such as ion exchange,5,6 membrane separation, reverse osmosis, ultrafiltration, electrodeposition7 complexation precipitation, and biosorption.8 Specially, biosorption is a higher effective, environmentally friendly, cheap, and easy way to operate comparing with other treatment processes.9 AL as an excellent biosorbent for removal heavy metals has an attractive potential.
Biosorbents have the advantages of biocompatibility and biodegradability,10 such as starch, chitosan,11 cellulose, lignin and so on. EHR is considered as waste in the cellulosic ethanol industry,12–14 which contains a lot of lignin and little of cellulose, hemicellulose and other impurities. Lignin is the main component in EHR and still retains its original chemical structure,15 which could be separated from these residues and then modified as aminated lignin by Mannich reaction.16 AL contains large amounts of reactive sites17 such as amino group and phenolic hydroxyl,18 and can be utilized as adsorbent to uptake heavy mental ions such as Cu(II) ions.19–21 It is an eco-friendly and cost-effective method to make full use of aminated lignin to adsorb Cu(II) ions from aqueous solution.22,23
In one study, the alkali lignin from the black liquor of a kraft pulp mill was aminated with hexane-diamine to be a flocculant with ultrasonic assistance. It's more difficult to separate lignin from black liquor than from enzymatic hydrolysis residues, and its adsorption needs more assistance. In another study, aminated bagasse pith was reported as an ions adsorbent to remove copper(II) from aqueous solution, but the adsorption capacity of aminated bagasse pith was lower than some sorbents.24
The aim of this study was to carry out a thoroughly investigation of the adsorption of Cu(II) ions by AL from EHR,25 including the adsorption kinetic, adsorption isotherm26 and factors which could make a difference to the adsorption of Cu(II) ions onto AL such as pH, reaction temperature, reaction time and initial concentration of Cu(II) ions.27 The relationship between the adsorption capacity and adsorption mechanisms was studied by Langmuir and Freundlich isotherms models.28,29 Lignin from EHR of corn stalks in cellulosic ethanol process could be modified and then used to remove heavy metal ions which can maximize the economic value of the residues.
2. Materials and methods
2.1 Materials
EHR of corn stalk was obtained from a factory (Heilongjiang Province, China). Copper sulfate pentahydrate (CuSO4·5H2O), epichlorohydrin and diethylenetriamine (DETA) were purchased from Runjie Chemical Reagent Co., Ltd. (Shanghai, China). Concentrated hydrochloric acid, nitric acid and sodium hydroxide were purchased from Kemiou Chemical Reagent Co., Ltd. (Tianjin, China). All other reagents were of analytical grade. The raw material was grinded to 100 mesh particles for further analysis.2.2 Preparation of AL from EHR
The air-dried EHR particles were added into 40 g L−1 of NaOH solution (1![[thin space (1/6-em)]](https://www.rsc.org/images/entities/char_2009.gif) :
:![[thin space (1/6-em)]](https://www.rsc.org/images/entities/char_2009.gif) 30, w/v) and soaked for 2.5 h at 60 °C in the water bath. After that, the mixture was filtrated and diluted HCl was used to adjust the pH value to 1.5, then the precipitation was centrifuged after standing for 12 hours at room temperature. The precipitation was washed with deionized water and filtrated then freeze-dried into SL.
30, w/v) and soaked for 2.5 h at 60 °C in the water bath. After that, the mixture was filtrated and diluted HCl was used to adjust the pH value to 1.5, then the precipitation was centrifuged after standing for 12 hours at room temperature. The precipitation was washed with deionized water and filtrated then freeze-dried into SL.
The pre-weighted SL was mixed with 16.7% NaOH solution (1![[thin space (1/6-em)]](https://www.rsc.org/images/entities/char_2009.gif) :
:![[thin space (1/6-em)]](https://www.rsc.org/images/entities/char_2009.gif) 10, w/v) and epichlorohydrin (1
10, w/v) and epichlorohydrin (1![[thin space (1/6-em)]](https://www.rsc.org/images/entities/char_2009.gif) :
:![[thin space (1/6-em)]](https://www.rsc.org/images/entities/char_2009.gif) 10, w/v), and the mixture was agitated and heated at 80 °C for 3 hours, then 95.0% ethanol and deionized water was used to wash the product to neutral. The light yellow powdered epoxy lignin could be gained by freeze drying method from the product. After that, single factor experiments were applied to determine the optimum conditions for the synthesis of AL by a Mannich reaction. The factors and levels are showed in Table 1. 1.0 g epoxy lignin and 16.7% NaOH solution were added into a three-necked flask. This mixture was continuously stirred under temperature and time in Table 1. Then AL was washed, filtrated and dried by freeze drying again. The content of nitrogen element was used to determine the grafting of DETA onto epoxy lignin.
10, w/v), and the mixture was agitated and heated at 80 °C for 3 hours, then 95.0% ethanol and deionized water was used to wash the product to neutral. The light yellow powdered epoxy lignin could be gained by freeze drying method from the product. After that, single factor experiments were applied to determine the optimum conditions for the synthesis of AL by a Mannich reaction. The factors and levels are showed in Table 1. 1.0 g epoxy lignin and 16.7% NaOH solution were added into a three-necked flask. This mixture was continuously stirred under temperature and time in Table 1. Then AL was washed, filtrated and dried by freeze drying again. The content of nitrogen element was used to determine the grafting of DETA onto epoxy lignin.
| Factor | Level | ||||
|---|---|---|---|---|---|
| 1 | 2 | 3 | 4 | 5 | |
| 16.7% NaOH (mL) | 10 | 20 | 30 | 40 | 50 |
| DETA (mL) | 10 | 20 | 30 | 40 | 50 |
| Time (h) | 2 | 3 | 4 | 5 | 6 |
| Temperature (°C) | 40 | 50 | 60 | 70 | 80 |
2.3 Characteristics of EHR, SL and AL
FT-IR spectra of EHR, SL and AL were recorded by Vector 33 type infrared spectrometer (Bruker, German). The element contents were measured by Vario EL cube element analyzer (Elementar, German). The appearance of EHR and AL were detected by EVO18 type SEM (Zeiss, German). The Cu(II) ions concentration was measured by the ZEEnit 700p flame graphite furnace atomic absorption spectrometer (F/GF-AAS) (Analytik Jena, German). The binding energy of AL was determined by the Axis Ultra DLD clutches multi-function XPS (Kratos, British).2.4 Adsorption procedure
Cu2+ solutions were prepared by dissolving CuSO4·5H2O in deionized water to reach a concentration of 100 mg L−1. Diluted HCl (0.01 M) and NaOH (0.01 M) were dropped into Cu2+ solutions to adjust systemic pH value to 3.0, 3.5, 4.0, 4.5, 5.0, and 5.5, respectively. Batch experiments were carried out (at 25 °C) by agitating 100 mg of AL in 50 mL of Cu2+ solution (100 mg L−1) for 150 min at 20, 30, 40, 50, and 60 °C, respectively. After that the Cu2+ concentration in the mixture was determined by F/GF-AAS, and the adsorption capacity of AL at adsorption equilibrium, qe (mg g−1), was calculated according to the following equation:
 | (1) |
2.5 Adsorption kinetics analysis
The adsorption kinetics analysis was conducted with the following conditions: 100 mg of AL were added into 50 mL of Cu2+ solution (100 mg L−1), and the mixture was agitated continuously for 5–360 min (200 rpm) at an optimum pH value and reaction temperature obtained from Section 2.4. The adsorption capacity of AL was calculated according to eqn (1). Pseudo-first-order and pseudo-second-order kinetic models were used to fit the adsorption kinetic data.The pseudo-first-order kinetic equation is
Which has a linear form of
ln(qe − qt) = ln![[thin space (1/6-em)]](https://www.rsc.org/images/entities/char_2009.gif) qe − k1t qe − k1t |
The pseudo-second-order kinetic equation is
where qt (mg g−1) is the adsorption capacity at time t (min), qe (mg g−1) is the adsorption capacity at adsorption equilibrium, and k1 (min−1) and k2 (g mg−1 min−1) are the kinetics rate constants for the pseudo-first-order and pseudo-second-order models, respectively.
2.6 Adsorption isotherms analysis
Adsorption isotherm analysis can describe the adsorption mechanism at equilibrium well.29 The effect of the initial Cu2+ concentration on the adsorption capacity was investigated by variation of the initial concentration of Cu2+ at an optimum pH value, reaction temperature and time. A total of 100 mg of AL was added into 50 mL of Cu2+ solution (50–300 mg L−1) at appropriate conditions as above. At the end of this experiment, the adsorption capacity of AL was calculated according to eqn (1). Langmuir and Freundlich adsorption isotherm models were used to fit the adsorption isotherm data.The Langmuir adsorption isotherm equation is
The Freundlich adsorption isotherm equation is
2.7 Contrast experiment and regeneration
Batch experiments were carried out (at 25 °C) by agitating 100 mg of AL, SL and EHR in 50 mL of Cu2+ solution under optimum conditions from 2.4, 2.5 and 2.6 respectively. Then the Cu2+ concentration was determined by F/GF-AAS. Three adsorbents were filtrated and washed with deionized water 3 times. Then, three adsorbents were added into HNO3 solution (0.05 M) for 2 h under stirring to remove Cu2+, then filtrated and washed with deionized water again. Finally, three recycled adsorbents were used to adsorb copper ion and the adsorption–desorption process was repeated 3 times. The adsorption capacity of adsorbents was calculated according to the eqn (1).3. Results and discussion
3.1 Single factor experiment
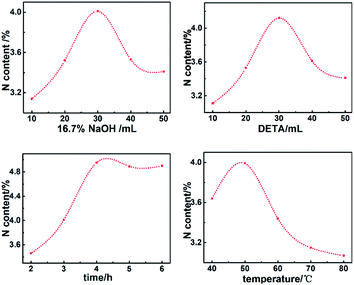
The grafting ratio of AL depends on the nitrogen content. A higher nitrogen content indicates a better grafting modification. Results in Fig. 1 exhibited that AL could be well prepared by mixing epoxy lignin with 16.7% NaOH solution (1![[thin space (1/6-em)]](https://www.rsc.org/images/entities/char_2009.gif) :
:![[thin space (1/6-em)]](https://www.rsc.org/images/entities/char_2009.gif) 30, w/v) and DETA (1
30, w/v) and DETA (1![[thin space (1/6-em)]](https://www.rsc.org/images/entities/char_2009.gif) :
:![[thin space (1/6-em)]](https://www.rsc.org/images/entities/char_2009.gif) 30, w/v) for 4 hours at 50 °C.
30, w/v) for 4 hours at 50 °C.
3.2 The FT-IR spectra analysis
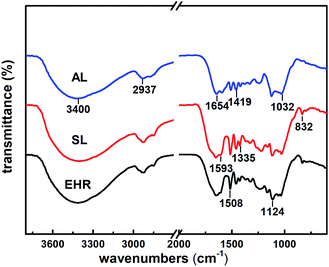
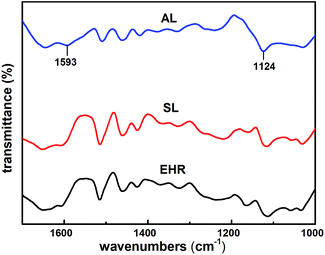
The FT-IR spectra obtained from EHR, SL and AL were shown in Fig. 2 and 3. Absorption peak at 1654 cm−1 indicated aromatic ring of conjugated C![[double bond, length as m-dash]](https://www.rsc.org/images/entities/char_e001.gif) O stretching vibration.14 Two absorption peaks at 1508 cm−1 and 1419 cm−1 could be assigned to typical aromatic skeleton vibrations.14 The peaks at 1335 cm−1 was syringyl ring C–O stretching vibration and peaks at 1032 cm−1 indicated guaiacyl units.30
O stretching vibration.14 Two absorption peaks at 1508 cm−1 and 1419 cm−1 could be assigned to typical aromatic skeleton vibrations.14 The peaks at 1335 cm−1 was syringyl ring C–O stretching vibration and peaks at 1032 cm−1 indicated guaiacyl units.30
Comparing with the FT-IR spectra of AL and SL, the peaks of AL at 832 cm−1 of epoxy groups weakened significantly.13 The peaks of AL at 1124 cm−1 of aliphatic C–N stretching vibration, 1593 cm−1 of N–H swing vibration enhanced.15 The broad band at 3400 cm−1 was dominated by the stretching vibrations of –OH groups.11 These peaks indicated the presence of amino groups in AL, indicating that diethylenetriamine monomers could be grafted onto SL.23,31,32
3.3 SEM and XPS spectra analysis
Fig. 4(a) and (b) depicted the morphological changes of EHR and AL prior to the adsorption in Cu2+ solutions. EHR exhibited a macroporous structure. However, the surface of AL looked smoother than that of EHR. After modification, the expanded macropores gradually shrank and even flattened, and no apparent pores could be observed on the surface of AL.23 The morphologies of Cu2+ adsorbed onto EHR and AL were also shown in Fig. 4(c) and (d). It could be observed that many irregular pieces appeared on the surface of both EHR and AL, which were the metal Cu salts.10 Interestingly, the metal Cu salts adsorbed onto AL were more than EHR. Therefore, it could be concluded that plenty of active sites located on AL, and played an important role in Cu2+ adsorption.10,33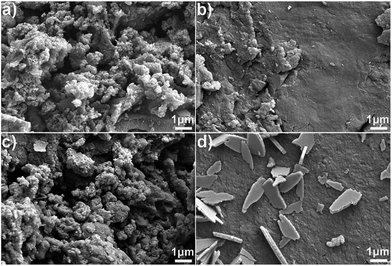 | ||
| Fig. 4 Typical SEM micrographs: (a) EHR before Cu2+ adsorption, (b) AL before Cu2+ adsorption, (c) EHR after Cu2+ adsorption, (d) AL after Cu2+ adsorption. | ||
In order to make further research on the Cu2+ adsorption of AL, the Kratos Axis Ultra (DLD) type photoelectron spectrometer was used for chemical analysis of surface of AL. As shown in Fig. 5(a) and (d), there were no obvious changes before and after Cu2+ adsorption. As shown in Fig. 5(b), the peaks at binding energy of 399.8 eV and 401.1 eV respectively referred to –NH2 groups and C-bonded CH2CN (–CH2CN), indicating that diethylenetriamine monomers could be grafted onto SL again.34 Interestingly, it could be clearly found that the peak at binding energy of 397.5 eV appeared after Cu(II) ions adsorption in Fig. 5(e). It could be Cu–N bonds but hard to confirm whether Cu–N bonds exist or not. Thus, copper nitrides were not taken into consideration.35 Meanwhile, Cu2p spectrum changed obviously comparing Fig. 5(c) with (f). There were five groups of peaks in Fig. 5(f). The peaks at binding energy of 940 eV and 947 eV represented Cu2p2/3 spectra, indicating the Cu and N connection.36 The point of 960 eV could be the characteristic peak of Cu3d3/2. According to the ligand field theory, d orbital of Cu was incompletely filled and had strong coordination ability. Similarly, p orbital of N was incompletely filled, allowing reactions between Cu and N. In addition, Cu2p1/2 at 952 eV and Cu2p3/2 at 932 eV were observed and corresponded, respectively.37 These results indicated that Cu2+ were adsorbed onto AL, which was consistent with SEM analysis.34
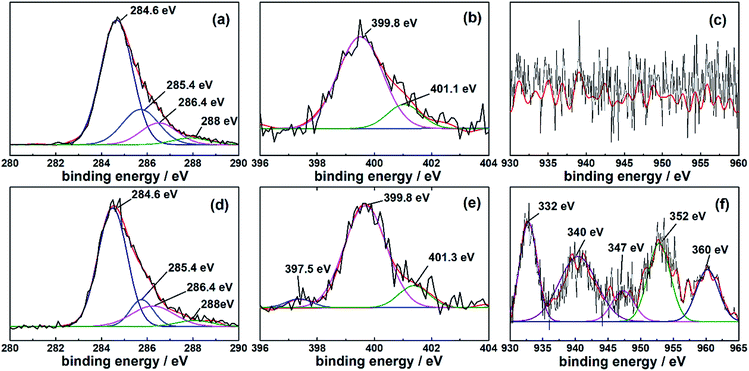 | ||
| Fig. 5 Partial scan of AL before Cu2+ adsorption: (a) C1s, (b) N1s, (c) Cu2p; partial scan of AL after Cu2+ adsorption: (d) C1s, (e) N1s, (f) Cu2p. | ||
3.4 Elements analysis
The nitrogen element content in AL shown in Table 2 was as high as 3.94%, which increased by 282.5% compared to SL (1.03%), indicating that diethylenetriamine monomers could be grafted onto the lignin after two-step modification.15,32 It was consistent with results of FT-IR spectra analysis.| Samples | Element mass (%) | ||
|---|---|---|---|
| Nitrogen | Carbon | Hydrogen | |
| EHR | 0.87 | 44.14 | 5.18 |
| SL | 1.03 | 42.04 | 4.71 |
| AL | 3.94 | 47.53 | 6.50 |
3.5 Effect of the pH of Cu2+ solution on Cu2+ adsorptione
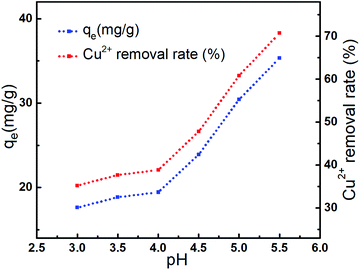
The effect of the pH on the metal ion adsorption capacity of AL was shown in Fig. 6. Results indicated that Cu2+ adsorption was strongly pH-dependent.14 The adsorption capacity enhanced slightly when pH value ranged from 3 to 4, because the H+ could make the active functional groups such as –NH2 and –O− protonated, weakened the Cu2+ adsorption process, decreased the Cu2+ adsorption capacity.23 When pH value increased from 4 to 5.5, the adsorption capacity of AL remarkably raised from 19.43 mg g−1 to 35.36 mg g−1, and Cu2+ removal rate increased from 38.86% to 70.71%. The pH-dependence11 of adsorption suggested that Cu2+ were adsorbed according to the ion-exchange mechanism.23,25 These results indicated that aqueous solution system with pH 5.5 was the optimal condition.313.6 Effect of the reaction temperature on Cu2+ adsorption
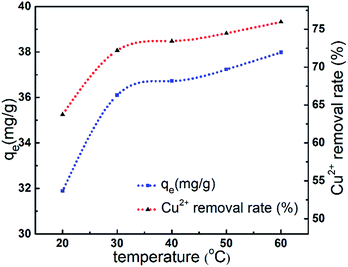
As illustrated in Fig. 7, the adsorption capacity of Cu2+ onto AL increased 4.84%, and Cu2+ removal rate increased 9.68% when the temperature raised from 20 °C to 40 °C. However, the adsorption capacity and Cu2+ removal rate increased slowly in the range of 40–60 °C. It could be due to the fact that the interaction between Cu2+ and active groups such as hydroxyl and amino groups of AL was weaker at high temperatures.10 Apparently, high reaction temperature indicated the enhancement of the adsorption capacity of Cu2+.15 The results indicated that the adsorption was endothermic in nature and mainly by chemisorption rather than physisorption.183.7 Adsorption kinetics and isotherms
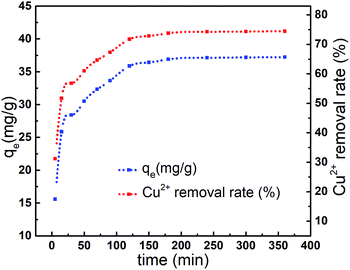
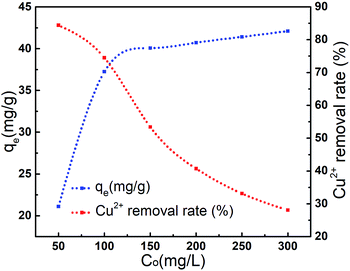
The adsorption capacity of Cu2+ onto AL was investigated by a batch equilibrium technique for reaction time varying between 5 min and 360 min. Results was showed in Fig. 8, the adsorption capacity of Cu2+ onto AL raised from 15.59 mg g−1 to 37.14 mg g−1 when reaction time increased from 5 min to 240 min. However, the adsorption capacity slowed down after 240 min. Results indicated that adsorption equilibrium could be achieved within 240 min.15,23 The spontaneously high rate of Cu2+ uptake at short reaction time was associated with initial large number of vacant surface active sites available on AL.18 Afterward the filling of vacant sites became difficult due to repulsive forces between Cu2+ adsorbed on AL surface and Cu2+ from solution.29The effect of initial concentration of Cu2+ on the adsorption was illustrated in Fig. 9. The adsorption capacity increased sharply to 37.14 mg g−1 (at 100 mg L−1) with the increase of initial concentration of Cu2+, and adsorption equilibrium could be achieved.10 At low concentration, the ratio of available binding sites to the total Cu2+ was high and Cu2+ could be bound to the active sites of AL.15 Whereas, at high concentration, the ratio was lower and consequently binding sites were dependent on the initial concentration.23
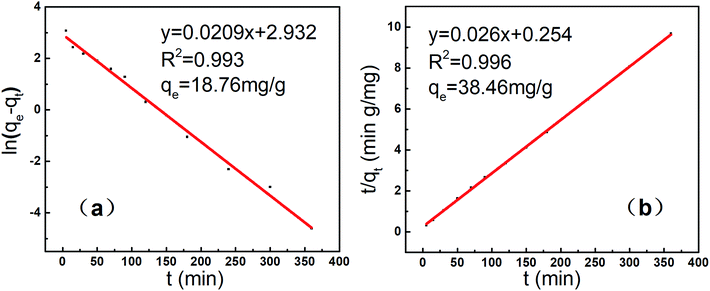
On the basis of the time profiles above-mentioned, the pseudo-first-order and pseudo-second-order kinetic models were fitted and set up in Fig. 10. Clearly, the correlation coefficients R2 for the pseudo-second-order kinetic model was higher and closer to 1 than those of the pseudo-first-order kinetic model, and the equilibrium adsorption quantity were closer to the experimental value from the pseudo-second-order kinetic model,4 indicating that this adsorption system was a pseudo-second-order kinetic adsorption process.10
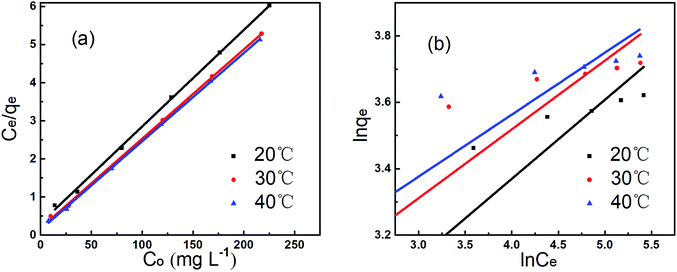
Experimental data were fitted to the Langmuir and Freundlich isotherm models as illustrated in Fig. 11, and parameters were presented in Table 3. Langmuir isotherm model fitted the experimental equilibrium data reasonably well with high correlation coefficients (R2 > 0.99 at 40 °C). However, results of Freundlich isotherm model were not desirable with smaller R2 values between 0.7858 and 0.7997. The qf,cal values calculated from the Langmuir isotherm model were close to the experimental data qf,exp.23 Therefore, Langmuir isotherm model provided the better fit for experimental data of AL, and could describe the adsorption of Cu2+ onto AL.18
| Temperature (°C) | Langmuir isotherm | Freundlich isotherm | ||||
|---|---|---|---|---|---|---|
| R2 | qf (mg g−1) | KL | R2 | n | KF | |
| 20 | 0.9988 | 39.47 | 0.0802 | 0.7997 | 4.2017 | 11.22 |
| 30 | 0.9993 | 42.66 | 0.1260 | 0.7680 | 4.8277 | 14.73 |
| 40 | 0.9996 | 43.18 | 0.1602 | 0.7858 | 5.3022 | 16.71 |
3.8 Control experiment and regeneration
Table 4 exhibited that the adsorption capacity of AL, SL and EHR were 37.22, 23.50 and 10.93 mg g−1, respectively, without regeneration. Additionally, the recovery efficiency of AL was high up to 87.51%, larger than that of SL and EHR in the third cycle. Results presented that AL had a better performance than SL and EHR in the adsorption capacity and regeneration.| Adsorbents | Cycle 0 | Cycle 1 | Cycle 2 | Cycle 3 | |||
|---|---|---|---|---|---|---|---|
| qe (mg g−1) | qe (mg g−1) | R (%) | qe (mg g−1) | R (%) | qe (mg g−1) | R (%) | |
| AL | 37.22 | 36.15 | 97.12 | 35.37 | 95.03 | 32.57 | 87.51 |
| SL | 23.50 | 21.78 | 92.68 | 19.55 | 83.19 | 16.27 | 74.70 |
| EHR | 10.93 | 9.81 | 89.75 | 9.12 | 83.44 | 7.84 | 71.73 |
4. Conclusion
Amino group can be grafted onto lignin separated from cellulosic ethanol enzymolysis residues well with epoxidation and amination modification. Aminated lignin put up a good performance for the removal of the metal Cu2+ with an efficient and environmentally friendly approach.In addition, the adsorption kinetic has been studied and fitted the pseudo-second-order kinetic model well. Adsorption mechanism is consistent with the experimental data of Langmuir isotherm model. Under the optimum adsorption conditions, aminated lignin exhibits a good property that adsorption capacity could reach up to 37.14 mg g−1. In summary, aminated lignin from cellulosic ethanol enzymolysis residue in consideration of their abundant supply makes them a potential and promising material for heavy metal ions removal for water treatment industries in the future.
Conflicts of interest
There are no conflicts to declare.Acknowledgements
We gratefully acknowledge the financial support from the Special Support Plan of Guangdong Province (2014TQ01N603), Key Laboratory of Pulp and Paper Science & Technology of Ministry of Education of China (KF201508), Science & technology plan projects of Guangdong province (2015B020241001) and National Major Science and Technology Program for Water Pollution Control and Treatment (2014ZX07213).References
- C. H. Lai, M. B. Tu, Q. Yong and S. Y. Yu, RSC Adv., 2015, 5, 97966–97974 RSC.
- D. Sud, G. Mahajan and M. P. Kaur, Bioresour. Technol., 2008, 99, 6017–6027 CrossRef CAS PubMed.
- H. N. M. Ekramul Mahmud, A. K. O. Huq and R. B. Yahya, RSC Adv., 2016, 6, 14778–14791 RSC.
- A. M. Garcíaa, M. G. Corzoa, M. A. Domíngueza, M. A. Francob and J. M. Naharro, J. Hazard. Mater., 2017, 328, 46–55 CrossRef PubMed.
- Y. C. Chang, S. W. Chang and D. H. Chen, React. Funct. Polym., 2006, 66, 335–341 CrossRef CAS.
- X. Zeng and E. Ruckenstein, J. Membr. Sci., 1998, 148, 195–205 CrossRef CAS.
- L. Lv, N. Chen, C. P. Feng, J. Zhang and M. Li, RSC Adv., 2017, 7, 27992–28000 RSC.
- S. S. Ahluwalia and D. Goyal, Eng. Life Sci., 2005, 5, 158–162 Search PubMed.
- G. Aragay, J. Pons and A. Merkoçi, Chem. Rev., 2011, 111, 3433–3458 CrossRef CAS PubMed.
- D. G. Liu, Z. H. Li, W. Li, Z. G. Zhong, J. Q. Xu, J. J. Ren and Z. S. Ma, Ind. Eng. Chem. Res., 2013, 52, 11036–11044 CrossRef CAS.
- W. S. Wan Ngah and S. Fatinathan, Chem. Eng. J., 2008, 143, 62–72 CrossRef.
- F. F. Menezes, F. R. H. de Silva, M. G. J. de Rocha and R. M. Filho, Ind. Crops Prod., 2016, 94, 463–470 CrossRef.
- T. Tana, Z. Y. Zhang, L. Moghaddam, D. W. Rackemann, J. Rencoret, A. Gutiérrez, J. Del Río and W. O. S. Doherty, ACS Sustainable Chem. Eng., 2016, 4, 5483–5494 CrossRef CAS.
- X. Y. Guo, S. Z. Zhang and X. Q. Shan, J. Hazard. Mater., 2008, 151, 134–142 CrossRef CAS PubMed.
- Q. F. Lu, Z. K. Huang, B. Liu and X. S. Cheng, Bioresour. Technol., 2011, 104, 111–118 CrossRef PubMed.
- X. H. Wang, Y. K. Zhang, C. Hao, X. H. Dai, Z. L. Zhou and N. C. Si, RSC Adv., 2014, 4, 28156–28164 RSC.
- Y. M. Hao, M. Chen and Z. B. Hu, J. Hazard. Mater., 2010, 184, 392–399 CrossRef CAS PubMed.
- Y. S. Ho, Water Res., 2003, 37, 2323–2330 CrossRef CAS PubMed.
- S. M. Xu, S. Feng, F. Yue and J. D. Wang, J. Appl. Polym. Sci., 2004, 92, 728–732 CrossRef CAS.
- K. Kadirvelu, C. F. Brasquet and P. L. Cloirec, Langmuir, 2000, 16, 8404–8409 CrossRef CAS.
- X. Luo, J. Zeng, S. Liu and L. Zhang, Bioresour. Technol., 2015, 194, 403–406 CrossRef CAS PubMed.
- R. H. Crist, J. R. Martin and D. R. Crist, Environ. Sci. Technol., 2002, 36, 1485–1490 CrossRef CAS PubMed.
- X. W. Peng, L. X. Zhong, J. L. Ren and R. C. Sun, J. Agric. Food Chem., 2012, 60, 3909–3916 CrossRef CAS PubMed.
- N. F. Ma, S. X. Chen, X. L. Liu and Y. Yang, J. Appl. Polym. Sci., 2010, 117, 2854–2861 CrossRef CAS.
- Y. Wu, S. Z. Zhang, X. Y. Guo and H. L. Huang, Bioresour. Technol., 2008, 99, 7709–7715 CrossRef CAS PubMed.
- Y. S. Ho and G. McKay, Water Res., 2000, 34, 735–742 CrossRef CAS.
- S. N. C. Ramos, A. L. P. Xavier, F. S. Teodoro, L. F. Gil and L. V. A. Gurgel, Ind. Crops Prod., 2016, 79, 116–130 CrossRef CAS.
- Q. Li, J. P. Zhai, W. Y. Zhang, M. M. Wan and J. Zhou, J. Hazard. Mater., 2007, 141, 163–167 CrossRef CAS PubMed.
- T. V. J. Charpentier, A. Neville, J. L. Lanigan, R. Barker, M. J. Smith and T. Richardson, ACS Omega, 2016, 1, 77–83 CrossRef CAS.
- R. C. Sun, J. Tomkinson, X. F. Sun and N. J. Wang, Polymer, 2000, 41, 8409–8417 CrossRef CAS.
- B. Rezaei, E. Sadeghi and S. Meghdadi, J. Hazard. Mater., 2009, 168, 787–792 CrossRef CAS PubMed.
- Y. Zhang, R. J. Qu, C. M. Sun, C. H. Wang, C. N. Ji, H. Chen and P. Yin, Appl. Surf. Sci., 2009, 255, 5818–5826 CrossRef CAS.
- K. Mandel, F. Hutter, C. Gellermann and G. Sextl, ACS Appl. Mater. Interfaces, 2012, 4, 5633–5642 CAS.
- K. Mandel, F. Hutter, C. Gellermann and G. Sextl, ACS Appl. Mater. Interfaces, 2012, 4, 5633–5642 CAS.
- H. Y. Yu, A. Fisher, D. J. Cheng and D. P. Cao, ACS Appl. Mater. Interfaces, 2016, 8, 21431–21439 CAS.
- S. Deng and Y. P. Ting, Water Res., 2005, 39, 2167–2177 CrossRef CAS PubMed.
- I. Platzman, R. Brener, H. Haick and R. Tannenbaum, J. Phys. Chem. C, 2008, 112, 1101–1108 CAS.
| This journal is © The Royal Society of Chemistry 2017 |


