 Open Access Article
MoO3 subnanoclusters on ultrasmall mesoporous silica nanoparticles: an efficient catalyst for oxidative desulfurization†
Jiasheng Wang ,
Wenpei Wu,
Hongyang Ye,
Yahong Zhao,
Wan-Hui Wang and
Ming Bao*
State Key Laboratory of Fine Chemicals, School of Petroleum and Chemical Engineering, Dalian University of Technology, Panjin, 124221, China. E-mail: mingbao@dlut.edu.cn
First published on 19th September 2017
Abstract
Subnano-MoO3 supported on ultrasmall mesoporous silica nanoparticles (UMSN, ca. 14 nm) has been successfully synthesized by a reverse microemulsion method. The obtained subnano-MoO3/UMSN exhibited superior catalytic activity for the oxidative desulfurization of model diesel. The dibenzothiophene can be oxidized to dibenzothiophene sulfone and removed simultaneously by adsorbing on the catalyst. The superiority in catalytic performance of subnano-MoO3/UMSN can be attributed to the subnanometer size and the mesoporosity of the ultrasmall support. The origin of the unusual catalytic properties of the subnanoclusters was also explored preliminarily.
Introduction
Subnanoclusters are particles with diameters smaller than 1.0 nm (>0.1 nm).1 As an intermediate size regime between nanoparticles and molecules, subnanoclusters have exhibited some new properties which are different from their nano-counterparts.2 The metal subnanoclusters have been widely studied in the past decades.3,4 However, metal oxide subnanoclusters have just been emerging very recently.5,6 Both CoOx (ref. 5) and FeOx (ref. 6) subnanoclusters have exhibited superiority in catalytic performance for Fischer–Tropsch synthesis due to their featured atomic scale size compared to common nanoparticles. The promising catalytic performance of metal oxide subnanoclusters has evoked us to develop more active catalysts for more reaction types.Ultra-deep desulfurization of fuels has attracted great attention because of the serious environmental problems and harsh legal requirements. Usually high temperature (>300 °C) and high pressure (>3 MPa) are needed for the traditional hydrodesulfurization (HDS).7,8 While the sulfur compounds which are difficult to remove in HDS, such as benzothiophene (BT), dibenzothiophene (DBT), and 4,6-dimethyldibenzothiophene (4,6-DMDBT), can be removed efficiently under mild conditions (low temperature and ambient pressure) without hydrogen through oxidative desulfurization (ODS).9,10 Therefore, the ODS has become a promising desulfurization method at present.11–16 However, the catalytic activity of the catalysts now available cannot meet the needs for the industrialization of ODS.
MoO3 is a commonly used ODS catalyst.17,18 However, as far as we know, though some MoO3 clusters in sub nanoscale have been studied,19,20 not much amazing activity has been reported. And no subnano-MoO3 has been tested for ODS catalysts. Therefore, the research for the application of subnano-MoO3 for ODS is fueled.
On the other hand, mesoporous silica materials as excellent supports have been widely applied due to their high specific surface area and tunable channel.21 It is well known that decreasing the particle size of porous support to shorten the channel length could reduce the mass transfer resistance and improve the catalytic activity.22 Ultrasmall mesoporous silica nanoparticles (UMSN, <25 nm),23 have more advantages over the conventional mesoporous silica nanoparticles (MSN) as support because the decrease of their particle size shortens the access path and increases the specific area. In addition, the mesopores of UMSN make the internal active sites accessible to some big molecules, like DBT, which are difficult to enter microporous channels due to size limitation. Thus we chose to prepare UMSN as support to improve the efficiency of mass transfer.
In this work, we synthesized subnano-MoO3 supported on UMSN (ca. 14 nm) with “raisin-bun structure”22 by reverse microemulsion. The UMSN is among the minimal sizes of the reported UMSNs.23 Then we used the subnano-MoO3/UMSN for catalyzing oxidative desulfurization. The subnano-MoO3/UMSN exhibited better catalytic activity compared to nano-MoO3/UMSN and subnano-MoO3/ultrasmall microporous silica. The sulfur-containing products can also be removed simultaneously via sorption and separation.
Experimental section
Materials
n-Octadecyltrimethoxysilane (C18TMS) was purchased from Sigma-Aldrich. Dibenzothiophene (DBT), dibenzothiophene sulfone (DBTO2), biphenyl and decalin were purchased from Shanghai Macklin Biochemical Co., Ltd. Isopropanol and methanol were purchased from Tianjin Fuyu Fine Chemical Co., Ltd. Cyclohexane, n-butanol, ammonia, ammonium molybdate, tetraethyl orthosilicate (TEOS), and tert-butyl hydroperoxide (TBHP) were all purchased from Sinopharm Chemical Reagent Co., Ltd. of analytical grade. All chemicals were used as received without further purification.Preparation of subnano-MoO3/UMSN
In a typical experiment, 0.01 mol of CTAB was added into a 50 mL two-necked round-bottomed flask with 17 mL of cyclohexane and 5 mL of n-butanol at 35 °C under stirring. Then 0.8 mL of NH3·H2O and 50 μL of 0.1 mol L−1 (NH4)6Mo7O24 aqueous solution were added to the system with stirring until the solution was transparent to form a reverse microemulsion. 30 min later, 1.8 mL of TEOS![[thin space (1/6-em)]](https://www.rsc.org/images/entities/char_2009.gif) :
:![[thin space (1/6-em)]](https://www.rsc.org/images/entities/char_2009.gif) C18TMS (mole ratio 30
C18TMS (mole ratio 30![[thin space (1/6-em)]](https://www.rsc.org/images/entities/char_2009.gif) :
:![[thin space (1/6-em)]](https://www.rsc.org/images/entities/char_2009.gif) 1) mixture was added. The hydrolysis process was kept for 2 h, after which 15 mL of IPA was added to demulsificate the reverse microemulsion. After ultrasonication for 3 min, the solution was centrifuged at 6000 rpm for 10 min. The precipitate was washed with IPA twice, dried at 100 °C for 10 h, and calcined at 500 °C for 2 h under air stream to get the subnano-MoO3/UMSN, designated as C-1.
1) mixture was added. The hydrolysis process was kept for 2 h, after which 15 mL of IPA was added to demulsificate the reverse microemulsion. After ultrasonication for 3 min, the solution was centrifuged at 6000 rpm for 10 min. The precipitate was washed with IPA twice, dried at 100 °C for 10 h, and calcined at 500 °C for 2 h under air stream to get the subnano-MoO3/UMSN, designated as C-1.
To obtain nano-MoO3/UMSN (designated as C-2), the protocol was the same as above. The only difference was the replacement of the 50 μL of 0.1 mol L−1 (NH4)6Mo7O24 aqueous solution with 200 μL of 0.2 mol L−1 (NH4)6Mo7O24 ammonia solution.
The subnano-MoO3/ultrasmall microporous silica (designated as C-3) was also prepared under the same procedure of C-1 except the absence of C18TMS, i.e., pure TEOS was used instead of the TEOS![[thin space (1/6-em)]](https://www.rsc.org/images/entities/char_2009.gif) :
:![[thin space (1/6-em)]](https://www.rsc.org/images/entities/char_2009.gif) C18TMS mixture.
C18TMS mixture.
Pure SiO2 without Mo were made by removing MoO3 with aqua regia. Typically, 150 mg of C-1 or C-3 were added into a beaker. 20 mL of aqua regia was added and stirred for 10 h. After centrifugation at 6000 rpm for 10 min, the precipitate was washed to neutral with deionized water and dried at 100 °C for 10 h. The obtained SiO2 from C-1 and C-3 were designated as meso-SiO2 and micro-SiO2, respectively.
Catalysis of oxidative desulfurization
The model diesel with DBT content of 1000 ppm was prepared by dissolving 100 mg of DBT in 100 mL of decalin (1 ppm is defined as 1 mg of DBT molecular per liter of decalin). 50 mg of biphenyl was added as the internal standard of GC-FID. The mole ratios of the catalyst (MoO3) and the oxidant (TBHP) to the substrate (DBT) were abbreviated as [cat.]/[S] and [O]/[S], respectively.In a typical run, 2 mL of model diesel was added into a 10 mL reaction tube and heated to 70 °C under stirring. Then a certain amount of catalyst was added to the system to make the [cat.]/[S] was 0.075 (e.g., 38 mg of C-1 with a Mo content of 0.20 wt%). After stirring for 10 min, 2 mL of decalin containing 485 μL of TBHP ([O]/[S] = 6) was added. The reaction was run at 70 °C for 15 minutes. Then the reaction system was filtered to separate the catalyst. The filtrate was analyzed by GC. The conversion of DBT was investigated by GC chromatography (Agilent Technologies, 7820A GC system FID) with capillary column (HP-5, 30 m × 0.320 mm × 0.25 μm). TOF was calculated as mole of DBT converted per mole of MoO3 per hour at the end of the reaction.
The separated catalyst can be recycled by methanol washing and drying at 100 °C for 10 h. DBTO2 can be washed down by methanol and crystallized out when methanol was removed through rotary evaporation.
Different reaction conditions (catalyst, [cat.]/[S], [O]/[S], temperature, and time) were tested and listed in Table 2.
Characterization
The morphology and size of the solid samples were attained from field-emission transmission electron microscopy (FETEM, FEI Tecnai G2 F30). Aberration-corrected high-angle annual dark-filed scanning transmission electron microscopy (HAADF-STEM) images were obtained on a JEOL JEM-ARM200F equipped with a CEOS probe corrector. XRD was performed on the X-ray diffractometer (XRD, Shimadzu Corp. XRD – 7000S) with Cu-Kα radiation (λ = 1.542 Å), scanning from 10° to 70° at a speed of 5° min−1. The pore channel information was gained from N2 sorption by automatic physical adsorption analyzer (Quantachrome Instruments, Autosorb-iQ-C) at 77 K. The pore size was studied by Barrett–Joyner–Halenda (BJH) method and Horvath–Kawazoe (HK) method for mesopores and micropores, respectively. The composition was detected by X-ray photoelectron spectroscopy (XPS, Thermo Fisher, ESCALAB™ 250Xi) with Al-Kα X-ray source. The binding energies were calibrated using the adventitious carbon contamination C 1s peak at 284.6 eV. And the curve fitting was performed with the software CasaXPS. The distributions of elements were attained from mapping on field-emission scanning electron microscope (FESEM, FEI, Nova NanoSEM 450). The dried samples were directly used for observation without any further treatment. The content of Mo was detected by an inductively coupled plasma atomic emission spectrometry (ICP-AES, PerkinElmer, Optima 2000 DV). 1H NMR spectra were recorded on a Bruker Avance II 400 spectrometer using tetramethylsilane as an internal standard.Results and discussion
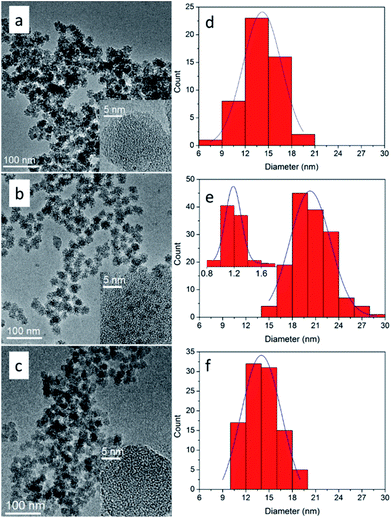
Under the aforementioned synthesis process, subnano-MoO3/UMSN was successfully prepared with uniform morphology by reverse microemulsion. The sizes of MoO3/UMSN nanocomposites and MoO3 clusters were shown in Fig. 1 and Table 1. According to the results of TEM image and particle size distribution histogram, the particle diameter of UMSN of C-1 was only 14.2 ± 4.9 nm and MoO3 was unable to be seen under HRTEM. Since MoO3 particles of 1 nm were observable,22 the MoO3 size of C-1 was supposed to be less than 1 nm, i.e., subnanometer. With the increasing amount of ammonium molybdate, the MoO3 size was raised from subnanometer to nanometer (1.2 ± 0.2 nm, C-2).| Catalyst | Particle size/nm | MoO3 size/nm | SBET/m2 g−1 | Pore size/nm |
|---|---|---|---|---|
| C-1 | 14.2 ± 4.9 | 0.6 ± 0.1 | 525 | 2.6 |
| C-2 | 18.8 ± 5.3 | 1.2 ± 0.2 | 480 | 2.4 |
| C-3 | 14.0 ± 5.2 | 0.6 ± 0.1 | 404 | 0.7, 0.8 |
For direct observation of the subnanoclusters, we characterized C-1 and C-3 with aberration-corrected high-angle annular dark-field scanning transmission electron microscopy (HAADF-STEM). The results were shown in Fig. 2. As can be seen, there are subnanoclusters in both samples. The size of the bright dots, as marked by red circles, is 0.6 ± 0.1 nm. Thus the existence of subnano-MoO3 was confirmed directly.
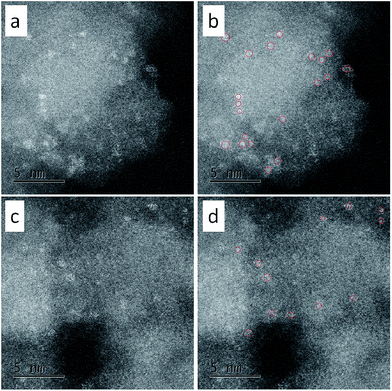 | ||
| Fig. 2 The HAADF-STEM images of (a, b) C-1 and (c, d) C-3. (a) and (c) were original, (b) and (d) showed the subnanoclusters marked with red circles. | ||
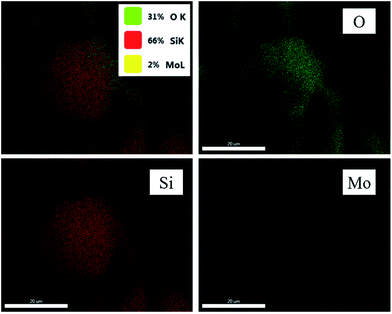
The missing of the characteristic peaks of MoO3 in XRD (Fig. S1†) can further support the tiny size of MoO3. However, it is still doubtful that whether the MoO3 does exist or not. Therefore, element mapping was performed for C-1 (Fig. 3). The results showed the distributions of O, Si, and Mo elements. The high dispersity of Mo on silica was thus confirmed undoubtedly.
But whether Mo does exist as MoO3 is still uncertain. To prove our assumption, XPS was performed and shown in Fig. 4. In accordance with the mapping results (Fig. 3), Mo, Si, and O elements were detected again in the survey spectrum. The appearance of carbon was caused by air contamination. Fig. 4b showed the narrow scan spectrum of Si 2p with 102.9 eV which belonged to the binding energy of SiO2. The spectrum of Mo (Fig. 4c) had two peaks of 237.1 eV and 234.0 eV, which were fitted to the binding energy of Mo 3d3/2 and 3d5/2 of MoO3, respectively. The O 1s peaks (Fig. 4d) with 531.9 eV and 534.3 eV were matched with the O 1s of MoO3 and SiO2, respectively. Hence the composition of the subnano-MoO3/UMSN can be ascertained.
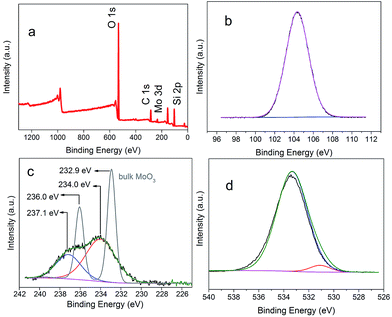 | ||
| Fig. 4 Survey XPS spectrum of nano-MoO3/UMSN (a), and narrow scan spectra of the elements of Si (b), Mo (c), and O (d). The grey line in (c) was the Mo spectra of bulk MoO3. | ||
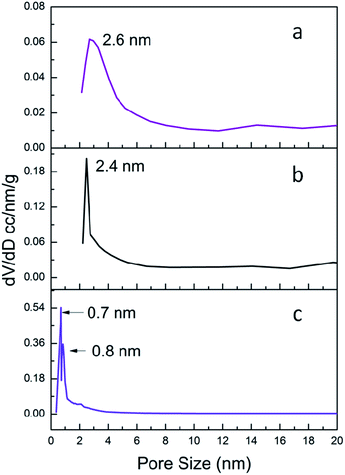
The pore size is quite important for heterogeneous catalysts. So the N2 sorption measurements were carried out. The N2 sorption isotherms of C-1/2/3 were shown in Fig. S2† and the pore size distribution curves were shown in Fig. 5. The specific surface area (SBET) and pore size data were listed in Table 1. The subnano-MoO3/UMSN (C-1) owns highest specific surface area of 525 m2 g−1 and the pore size is 2.6 nm. C-2 is also mesoporous with pore size at 2.4 nm and its specific surface area decreases to 480 m2 g−1. While C-3 has no mesopores, its pore sizes of 0.7 nm and 0.8 nm belong to micropore range. Meanwhile the specific surface area decreases to 404 m2 g−1. Obviously the specific surface area decreases with the reduction of the pore size.
The results of the N2 sorption measurements can also help us solve another question which cannot be answered by TEM: are the MoO3 subnanoclusters dispersed inside the UMSN or on the surface of UMSN? When subnano-MoO3 of C-1 was removed (i.e., only UMSN left), the surface area and pore size increased to 550 m2 g−1 and 2.7 nm, respectively (Fig. S3†). From the comparison of the specific surface area and the pore size of the UMSN, C-1, and C-2, we can conclude that the MoO3 subnanoclusters are dispersed inside the UMSN instead of the surface. If the MoO3 dispersed on the surface, their appearance and growth would not cause obvious shrinking of the pore size and decrease of the specific area. Besides, the synthesis principle is similar to our former works where the same structure with multi-cores dispersed inside SiO2 was obtained.22,24
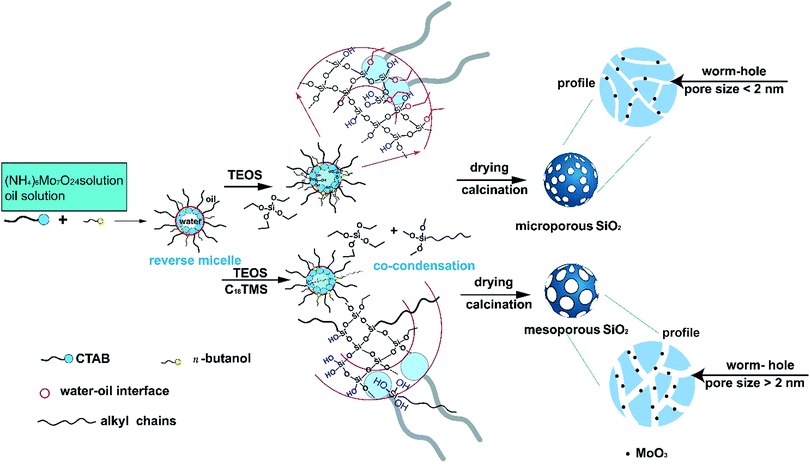
The formation mechanism of the subnano-MoO3/UMSN was shown in Scheme 1. The spherical reverse micelles consist of surfactant (CTAB), cosurfactant (n-butanol), oil phase (cyclohexane), and aqueous phase (ammonia and ammonium molybdate solution).25 When TEOS was added, it started hydrolyzing at the oil/water interface, forming Si–OH. Si–OH is hydrophilic so the hydrolyzed TEOS could enter the core of the reverse micelles. Then TEOS condensed in the core to form Si–O–Si framework and the spherical silica particles emerged. After the removal of CTAB, porous silica was formed. However, without a porogen, no mesopores can be formed in silica because the alkyl chains of CTAB lie outside the core. While TEOS and C18TMS (porogen) were added together, the silica particles formed based on their co-hydrolysis and co-condensation process. The hydrolyzed C18TMS with three hydrophilic Si–OH can pull the hydrophobic long alkyl chains into the core of reverse micelles. After calcination, the alkyl chains were removed, leaving the wormhole-like mesopores. Based on this procedure, it seemed that a porogen is indispensable to form mesoporous silica in reverse microemulsion. The mechanism also explains why we cannot reproduce the paper forming mesopores without porogen.26
The MoO3 was formed in situ from the pyrolysis of the ammonium molybdate encapsulated in silica during the sol–gel process.22 The size of MoO3 can be easily controlled through changing the precursor concentration. Subnanoclusters would form with low precursor concentration. With the increase of the addition amount of ammonium molybdate, nanoclusters would form. The size control principle is similar with our previous study on CuO in silica.24
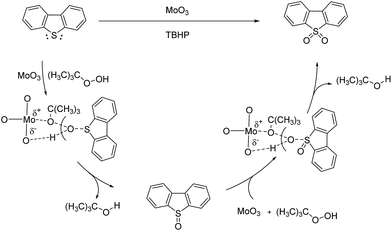
The catalytic mechanism of oxidative reaction of DBT could be described as Scheme 2. DBT is oxidized by TBHP to DBT sulfoxide then to DBTO2. During the process, the formation of metal peroxide intermediate state is involved. According to the crystal structure analysis, the distance between the Mo atoms and the O atoms of MoO3 is exactly matched with the distance between the tertiobutyl group and the terminal hydrogen atom of TBHP.27 Therefore, the metal peroxides intermediate state is easily formed with the help of MoO3 and the oxidation of DBT could quickly happen. The polarization of Mo–O bond also promotes the formation of metal peroxide intermediate state. Moreover, the empty 3d orbital and high electronic density of S atom of DBT also made the S atom easily attacked by the O atom of hydroxyl group of TBHP.
The subnano-MoO3/UMSN was used to catalyze oxidative desulfurization of model diesel. The results were shown in Table 2. As we can see, the reaction will not happen at all without catalyst (entry 10). The DBT conversion increased significantly with increasing catalyst amount, reaction time, and reaction temperature. While the amount of oxidant was not very critical. Based on the results of entries 1–7, an optimum condition ([cat.]/[S] = 0.075, [O]/[S] = 6, 70 °C, 15 min) was established. Under the optimum condition (entry 7), the conversion of DBT could reach 100% and the TOF was 53.3 h−1.
| Entry | Catalyst | [cat.]/[S] | [O]/[S] | T/°C | t/min | DBT conversion% | TOF/h−1 |
|---|---|---|---|---|---|---|---|
| 1 | C-1 | 0.05 | 4 | 70 | 30 | 82.6 | 33 |
| 2 | C-1 | 0.075 | 4 | 70 | 30 | 100 | 27 |
| 3 | C-1 | 0.075 | 2 | 70 | 15 | 94.0 | 50 |
| 4 | C-1 | 0.075 | 4 | 70 | 15 | 94.1 | 50 |
| 5 | C-1 | 0.075 | 6 | 50 | 15 | 60.2 | 32 |
| 6 | C-1 | 0.075 | 6 | 60 | 15 | 96.8 | 52 |
| 7 | C-1 | 0.075 | 6 | 70 | 15 | 100 | 53 |
| 8 | C-2 | 0.075 | 6 | 70 | 15 | 25.7 | 10 |
| 9 | C-3 | 0.075 | 6 | 70 | 15 | 12.3 | 7 |
| 10 | — | — | 6 | 70 | 15 | 0 | — |
| 11 | Meso-SiO2 | — | 6 | 70 | 15 | 11.6 | — |
| 12 | Micro-SiO2 | — | 6 | 70 | 15 | 7.6 | — |
The catalytic activity of nano-MoO3/UMSN (C-2, entry 8) was tested under the optimum condition for comparison. The conversion of DBT was 25.7% and the TOF was 10.2 h−1 (decreased by 80%). Since the surface area was of less difference (decreased by 8%), it can be concluded that subnano-MoO3 is more active than nano-MoO3 (>1 nm).
Then the catalytic activity of subnano-MoO3/ultrasmall microporous silica (C-3, entry 9) was also tested under the optimum condition. The conversion of DBT was only 12.3% and the TOF was 6.6 h−1, obviously inferior to entry 7 (C-1). Though the particle size of MoO3 were both on subnanometer level, the micropores may significantly block the mass transfer and thus disable the activity of the subnanoclusters.
It is worth noting that without MoO3 subnanoclusters, both meso-SiO2 and micro-SiO2 exhibited low activity (entry 11, 12) even under the optimum condition. The DBT conversion data were 11.6% and 7.6% for the mesoporous silica and microporous silica, respectively. Though mesoporous silica has been reported to be active for ODS,28 most of the surface silanol groups (reported active sites) in our meso-SiO2 have been removed during the calcination process. Thus we can safely attribute the superior catalytic activity of C-1 to the existence of MoO3 subnanoclusters.
Besides DBT, more different sulfur-containing compounds, including thiophene, benzothiophene (BT), and 4,6-dimethyldibenzothiophene (4,6-DMDBT) were also tested with C-1 under the optimum condition. The results were shown in Table S1.† The catalyst C-1 performed well in all cases.
Why is the subnano-MoO3 more active than nano-MoO3? It is well accepted that the catalytic activity usually increases with decreasing size of the particles.29 The smaller the size is, the higher ratio of surface-to-bulk atoms (coordinatively unsaturated and normally function as active sites) becomes. However, such a significant difference between C-1 and C-2 cannot be just attributed to the little size discrepancy. The electron structure variation should be taken into account. Let us revisit the XPS narrow scan of Mo in Fig. 3c. While the nano-MoO3 (≥1 nm) has a binding energy very close to the bulk,22 the binding energy of subnano-MoO3 showed a shift of 1.1 eV higher than that of the bulk MoO3 (the grey line), the same trend as that observed for small gold clusters.30 This phenomenon might be attributed to the reduced core-hole screening in smaller clusters.31 It seems that the electronic properties of the subnanoclusters are significantly different from those of the nanoclusters. Thus the size-dependent alteration of electronic structure may be the primary reason for the unusual catalytic properties.17,32 The exact mechanism remains unclear and will likely fuel new research activities.
Then the system after the reaction was analyzed. To our surprise, neither DBT nor DBTO2 could be detected in the solution after the separation of the catalyst. Then we found that the resultant DBTO2 was adsorbed on the catalyst surface, just like what have been reported in Dou and Zeng's work.33 Then methanol was used to wash the spent catalyst adequately. After removing methanol by rotary evaporation, white crystal was obtained, which was identified as DBTO2 by 1H-NMR (Fig. S4†). Isolated yield was 98.3% for C-1 under the optimal conditions, which means almost all of the DBTO2 had been removed with the separation of the catalyst. This could be explained by the similarity–intermiscibility theory. While DBT as a nonpolar substance is easily soluble in nonpolar decalin, polar DBTO2 tends to separate from decalin and adsorb on silica, which has some polarity due to the existence of residual silanol groups. While methanol with strong polarity can wash DBTO2 out easily.
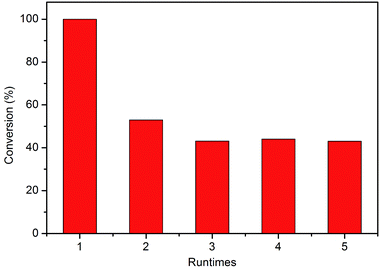
Finally, the stability of C-1 was studied. If the subnano-MoO3 is not structured but supported in silica, which means the MoO3 subnanoclusters were held by van der Waals forces, MoO3 may have leached out into solution during the reaction. The catalyst was recycled by methanol washing and drying. Totally 5 cycles were performed and the results were shown in Fig. 6. As expected, the conversion decreased significantly from nearly 100% to 52.9% when regenerated once. The Mo content decreased from 0.20 wt% to 0.09 wt% according to ICP-AES for the first regeneration. This could also confirm that the subnano-MoO3 is not structured in silica. The poor stability of C-1 remains a problem to be solved, which is underway in our lab and some preliminary results have been obtained. Anyhow, the high activity of subnanoclusters still presents promising perspectives.
For comparison, the stability properties of C-2 and C-3 were also studied. The results were shown in Fig. S5.† Both catalysts exhibited the same trend as C-1, indicating the existence of leaching.
Conclusions
To sum up, the subnano-MoO3/UMSN was synthesized successfully by reverse microemulsion. The size of MoO3 was affected by the amount of ammonium molybdate. The subnano-MoO3/UMSN was used to catalyze the oxidative desulfurization of DBT. The DBT conversion to DBTO2 was up to 100% within 15 min and the TOF of oxidative desulfurization was 53.3 h−1. The subnano-MoO3/UMSN can also serve as effective adsorbents for removal of DBTO2. The subnano-MoO3/UMSN exhibited higher activity than nano-MoO3/UMSN and subnano-MoO3/ultrasmall microporous silica, which demonstrated the superiority of both the subnano size of MoO3 and the mesoporosity of the ultrasmall support. The size-dependent alteration of electronic structure was believed to be the primary reason for the unusual catalytic properties.Conflicts of interest
There are no conflicts of interest to declare.Acknowledgements
The authors gratefully acknowledge the financial support of National Natural Science Foundation of China (No. 21506026), Doctoral Scientific Research Foundation of Liaoning Province (No. 201501171), and the China Postdoctoral Science Foundation funded project (No. 2016M601311).References
- B. Ni and X. Wang, Chem. Sci., 2016, 7, 3978–3991 RSC.
- Y. Lu and W. Chen, Chem. Soc. Rev., 2012, 41, 3594–3623 RSC.
- S. Vajda, M. J. Pellin, J. P. Greeley, C. L. Marshall, L. A. Curtiss, G. A. Ballentine, J. W. Elam, S. Catillon-Mucherie, P. C. Redfern, F. Mehmood and P. Zapol, Nat. Mater., 2009, 8, 213–216 CrossRef CAS PubMed.
- B. Vilhanová, J. Václavík, L. Artiglia, M. Ranocchiari, A. Togni and J. A. van Bokhoven, ACS Catal., 2017, 7, 3414–3418 CrossRef.
- S. Lee, B. Lee, S. Seifert, R. E. Winans and S. Vajda, J. Phys. Chem. C, 2015, 119, 11210–11216 CAS.
- Q. Yang, X.-P. Fu, C.-J. Jia, C. Ma, X. Wang, J. Zeng, R. Si, Y.-W. Zhang and C.-H. Yan, ACS Catal., 2016, 6, 3072–3082 CrossRef CAS.
- X. F. Zhou, A. J. Duan, Z. Zhao, Y. J. Gong, H. D. Wu, J. M. Li, Y. C. Wei, G. Y. Jiang, J. Liu and Y. Zhang, J. Mater. Chem. A, 2014, 2, 6823–6833 CAS.
- S. T. Song, X. F. Zhou, A. J. Duan, Z. Zhao, K. B. Chi, M. H. Zhang, G. Y. Jiang, J. Liu, J. M. Li and X. L. Wang, Microporous Mesoporous Mater., 2016, 226, 510–521 CrossRef CAS.
- J. M. Fraile, C. Gil, J. A. Mayoral, B. Muel, L. Roldán, E. Vispe, S. Calderón and F. Puente, Appl. Catal., B, 2016, 180, 680–686 CrossRef CAS.
- C. Shi, W. Wang, N. Liu, X. Xu, D. Wang, M. Zhang, P. Sun and T. Chen, Chem. Commun., 2015, 51, 11500–11503 RSC.
- C. Shen, Y. J. Wang, J. H. Xu and G. S. Luo, Green Chem., 2016, 18, 771–781 RSC.
- Q. Gu, G. Wen, Y. Ding, K.-H. Wu, C. Chen and D. Su, Green Chem., 2017, 19, 1175–1181 RSC.
- S.-x. Lu, H. Zhong, D.-m. Mo, Z. Hu, H.-l. Zhou and Y. Yao, Green Chem., 2017, 19, 1371–1377 RSC.
- X.-S. Wang, Y.-B. Huang, Z.-J. Lin and R. Cao, Dalton Trans., 2014, 43, 11950–11958 RSC.
- D. Juliao, A. C. Gomes, M. Pillinger, R. Valenca, J. C. Ribeiro, I. S. Goncalves and S. S. Balula, Dalton Trans., 2016, 45, 15242–15248 RSC.
- Y. Xu, W. Xuan, M. Zhang, H. N. Miras and Y.-F. Song, Dalton Trans., 2016, 45, 19511–19518 RSC.
- J. Chang, A. J. Wang, J. Liu, X. Li and Y. K. Hu, Catal. Today, 2010, 149, 122–126 CrossRef CAS.
- X. H. Han, A. J. Wang, X. S. Wang, X. Li, Y. Wang and Y. K. Hu, Catal. Commun., 2013, 42, 6–9 CrossRef CAS.
- Z. Li, Z. Fang, M. S. Kelley, B. D. Kay, R. Rousseau, Z. Dohnalek and D. A. Dixon, J. Phys. Chem. C, 2014, 118, 4869–4877 CAS.
- X. Tang, D. Bumueller, A. Lim, J. Schneider, U. Heiz, G. Ganteför, D. H. Fairbrother and K. H. Bowen, J. Phys. Chem. C, 2014, 118, 29278–29286 CAS.
- S. H. Wu, C. Y. Mou and H. P. Lin, Chem. Soc. Rev., 2013, 42, 3862–3875 RSC.
- J. Wang, X. Li, S. Zhang and R. Lu, Nanoscale, 2013, 5, 4823–4828 RSC.
- H. Zheng, C. W. Tai, J. Su, X. Zou and F. Gao, Dalton Trans., 2015, 44, 20186–20192 RSC.
- Y. Ge, Z. H. Shah, C. Wang, J. Wang, W. Mao, S. Zhang and R. Lu, ACS Appl. Mater. Interfaces, 2015, 7, 26437–26444 CAS.
- J. Wang, Z. H. Shah, S. Zhang and R. Lu, Nanoscale, 2014, 6, 4418–4437 RSC.
- Y. Wang, Y. Zhai, D. Pierre and M. Flytzani-Stephanopoulos, Appl. Catal., B, 2012, 127, 342–350 CrossRef CAS.
- A. Ishihara, D. Wang, F. Dumeignil, H. Amano, E. W. Qian and T. Kabe, Appl. Catal., A, 2005, 279, 279–287 CrossRef CAS.
- D. Wang, N. Liu, J. Zhang, X. Zhao, W. Zhang and M. Zhang, J. Mol. Catal. A: Chem., 2014, 393, 47–55 CrossRef CAS.
- X. Yang, A. Wang, B. Qiao, J. Li, J. Liu and T. Zhang, Acc. Chem. Res., 2013, 46, 1740–1748 CrossRef CAS PubMed.
- M. Turner, V. B. Golovko, O. P. Vaughan, P. Abdulkin, A. Berenguer-Murcia, M. S. Tikhov, B. F. Johnson and R. M. Lambert, Nature, 2008, 454, 981–983 CrossRef CAS PubMed.
- A. K. Santra and D. W. Goodman, J. Phys.: Condens. Matter, 2003, 15, R31 CrossRef CAS.
- X. Li, L. Liu, A. Wang, M. Wang, Y. Wang and Y. Chen, Catal. Lett., 2013, 144, 531–537 CrossRef.
- J. Dou and H. C. Zeng, ACS Catal., 2014, 4, 566–576 CrossRef CAS.
Footnote |
| † Electronic supplementary information (ESI) available: XRD pattern, 1H NMR, and N2 sorption isotherms. See DOI: 10.1039/c7ra08566d |
| This journal is © The Royal Society of Chemistry 2017 |

