
 Open Access Article
 This Open Access Article is licensed under a Creative Commons Attribution-Non Commercial 3.0 Unported Licence
Simultaneous determination of selected veterinary antibiotics in Nile tilapia (Orechromis niloticus) and water samples by HPLC/UV and LC-MS/MS†
Aziza E. Mostafaa,
Randa A. Abdel Salam *a,
Ghada M. Hadada and
Ismail A. Eissab
*a,
Ghada M. Hadada and
Ismail A. Eissab
aDepartment of Pharmaceutical Analytical Chemistry, Faculty of Pharmacy, Suez Canal University, Ismailia 41522, Egypt. E-mail: dr_rasalam@yahoo.com; randa_mousa@pharm.suez.edu.eg; Fax: +20 64 3561877; Tel: +20 01229446465
bDepartment of Fish Diseases and Management, Faculty of Veterinary Medicine, Suez Canal University, Ismailia, Egypt
First published on 28th September 2017
Abstract
A method was optimized and validated for simultaneous estimation of some antibiotics such as chlortetracycline (CTC), doxycycline (DOX), florfenicol (FF), flumequine (FLU), nalidixic acid (NAL), sulfadiazine (SDI), sulfathiazole (STZ) and trimethoprim (TMP) in fish muscle and water samples. The method is based on solid phase extraction (SPE) and simple extraction followed by high performance liquid chromatography with ultraviolet detection (HPLC-UV). The HPLC method was optimized using experimental design. The optimum conditions for separation determined with the aid of central composite design were: (1) initial mobile phase concentration: 0.1% formic acid in water/acetonitrile (90/10, v/v), (2) column temperature 25 °C and (3) mobile phase flow rate (1.2 ml min−1). The optimized method was validated according to ICH guidelines. The detection and quantification limits were between 0.2–0.4 and 0.3–0.6 μg kg−1, respectively, for fish and between 0.005–0.02 and 0.01–0.08 μg ml−1, respectively, for water. The procedure was also applied to the analysis of spiked Nile tilapia samples. Three antibiotics (SDI, CTC and FF) were orally administered and the residue was analyzed using liquid chromatography-electro spray ionization-mass spectrometry with positive ion mode (LC-ESI/MS).
1. Introduction
Many classes of antibiotics are commonly used in aquaculture worldwide to treat infections caused by a variety of bacterial pathogens of fish1 and also as growth promoting agents.Tetracyclines are broad-spectrum antibiotics widely used in human and veterinary medicine and feed additives to treat and prevent diseases. They are also used for promoting growth in the farming industry. Chlortetracycline (CTC) and doxycycline (DOX) are the most widely used tetracyclines with food-producing animals. The intensive culture of aquatic organisms involves the risk of outbreaks of infectious diseases, because of uncontrolled application of several antibiotic agents, with special emphasis on tetracycline derivatives.
Quinolones and fluoroquinolones are an important family of synthetic antibacterial used in both human and veterinary medicine. In the veterinary field, they are used for the prophylaxis and for treatment of veterinary diseases in most types of farmed animals; they are also used in aquaculture, such as flumeqine (FLU) and nalidixic acid (NAL).
Sulfonamides (SAs, synthetic derivatives of sulfanilamide (SAD)) represent one of the most important families of antibiotics used worldwide to treat both human and animal diseases. In veterinary medicine they are commonly administered in feed at sub-therapeutic doses during growth to prevent diseases, to promote growth, to increase weight gain and to reduce the amount of feed per animal,2,3 as sulfadiazine (SDI) and sulfathiazole (STZ).
Florfenicol (FF), a fluorinated analogue of chloramphenicol, is an antibacterial used in veterinary medicine.4 Florfenicol is a broad-spectrum, primarily bacteriostatic, antibiotic with a range of activity similar to that of chloramphenicol.
Trimethoprim (TMP) is a dihydrofolate reductase inhibitor. It inhibits the conversion of bacterial dihydrofolic acid to tetrahydrofolic acid which is necessary for the synthesis of certain amino acids, purines, thymidine, and ultimately DNA. It acts in the same metabolic pathway as the sulfonamides.
By asking veterinarians, it was found that the previously mentioned group of drugs are the most used in Egyptian fish farming especially SDI, CTC and FF.
These drugs were determined separately using various techniques and in combination with other drugs in fish and water samples. These methods include: (a) high performance liquid chromatography (HPLC) with several detection techniques,5–18 liquid chromatography-tandem mass spectrometry (LC-MS/MS),8–25 capillary electrophoresis (CE)26,27 and spectrophotometry.28 On the other hand the simultaneous determination of TMP, SDI, STZ, CTC, DOX, FF, NAL and FLU in fish (Nile tilapia) and water samples was not reported.
The aim of this work is to simultaneously separate and accurately determine TMP, SDI, STZ, CTC, DOX, FF, NAL and FLU by HPLC-UV using experimental design where the studied factors were evaluated with the aid of fractional factorial design while optimum chromatographic conditions were estimated by a central composite design. Samples from fish and water containing SDI, CTC and FF were analyzed by LC-MS/MS to determine the amount of residue remained in fish after adding these drugs by oral administration and to study the withdrawal time.
2. Experimental
2.1. Materials and reagents
All experiments were performed using pharmaceutical grade authentic standards of TMP, SDI, STZ, CTC, DOX and FLU (ADWIA Pharmaceuticals company, Egypt), NAL and FF (Sigma-Aldrich Pharmaceuticals company, Egypt), and all standards was certified to have a purity of (99.2–99.9%) (w/w), on dried basis, acetonitrile and methanol used were HPLC grade (LAB-Scan, Poland), Water used was double distilled and filtered through (0.45 μm) cellulose membrane filters (Chem. lab, Spain), formic acid, 33% ammonia solution and dichloromethane used were analytical grade. Oasis® HLB 60 mg/3 cm3 solid phase extraction (SPE) cartridges were obtained from Waters (Milford, Mass, USA).2.2. Preparation of standard and working calibration solutions
Stock standard solutions were prepared by dissolving (25 mg) of TMP, SDI, STZ, CTC, DOX and FF separately in (50 ml) with methanol and (25 mg) of NAL and FLU in (50 ml) with acetonitrile. The dissolution of SDI was made with the help of ultrasonic bath for about (2 min). These stock solutions were stored at 4 °C.The working standard solution at a concentration of 10 mg l−1 of each compound was prepared by dilution of the stock standard solutions with methanol. From these standard solution, calibration curve were carried out with blank fish samples spiked in the range 30–300 μg kg−1. On the other hand mixtures of working standard solution were prepared by dilution of stock solution with water to reach concentration ranges of 2–30 μg ml−1 for TMP, DOX, and CTC, 2–25 μg ml−1 for SDI, STZ, and FLU, 5–40 μg ml−1 for FF, and 2–20 μg ml−1 for NAL. These working standards were then stored at −20 °C until determination. Triplicate 5 μl injections were made for each drug concentration level and chromatographed under the conditions described above. The peak area of each drug concentration level was plotted against the corresponding concentration to obtain the calibration graph of each drug.
2.3. Sample preparation
2.3.1.1. First method. The pH of water sample was adjusted to 1.8–2 using formic acid. 25 ml water sample was extracted through 60 mg/3 cm3 Oasis® HLB extraction cartridges. The cartridges were preconditioned with 2 ml of methanol followed by 2 ml of water. The samples were then passed through the cartridges at a flow rate of approximately 1 ml min−1. The analytes were eluted by 3 ml of methanol, 1.5 ml of acetonitrile and 0.5 ml of dichloromethane. The eluate was evaporated to dryness using nitrogen stream and the eluate was reconstituted again with 1 ml of methanol.
2.3.1.2. Second method. The pH of water sample was adjusted to 3 using formic acid. 25 ml water sample was extracted through 60 mg/3 cm3 Oasis® HLB extraction cartridges. The cartridges were preconditioned with 2 ml of methanol, 2 ml of water, 2 ml 5% NH3 in methanol and 2 ml 0.1% formic acid. The samples were then passed through the cartridges at a flow rate of approximately 1 ml min−1 and then rinsed with 2 ml water. The analytes were eluted by 3 ml of methanol and 2 ml 5% NH3 in methanol. The eluate was evaporated to dryness using nitrogen stream and the eluate was reconstituted again with 1 ml of methanol.
2.3.2.1. Tissue sample fortification. A fortified Nile tilapia muscle sample was prepared by spiking 5 g of minced blank of tilapia, in the range of 30–300 μg kg−1, by the addition of an appropriate volume of the working solution of drugs. After the addition, the spiked tilapia samples were allowed to stand 25 min at room temperature, to allow the total interaction between the antibiotics and the tilapia sample prior to the extraction.
2.3.2.2. Preparation of CTC, FF and SDI medicated diets. Antibiotic was incorporated into feed during production or after production by using a binder, such as gelatin (up to 5%), fish or vegetable oil. In this study fish oil was used as binder between feed and antibiotics to provide either 50 mg CTC kg per fish per day, 50 mg SDI kg per fish per day or 15 mg FF kg per fish per day when fish are fed 3% of their body weight.
2.3.2.3. Preparation of incurred fish. Four groups of fish were used throughout the study. Each group consisted of 25 fish and stocked in tank. Three groups were fed with the medicated diets while the fourth group was used as control. The fish were allowed to acclimate in a 14 day period, which was followed by a 10 day drugs medication period (fish were orally dosed) and a 21 day withdrawal period.
2.3.2.4. Sampling of incurred fish. Immediately prior to the first feeding of medicated diet, four fish were randomly sampled as controls from each tank and the rest of the fish were weighed to determine the weight of medicated diet to be fed. This first sampling was followed by five samplings during the withdrawal period (after days 1, 3, 7, 14 and 21 post medication for all drugs-incurred fish). At each sampling, one fish was removed from each tank (three replicates per each drug sampling), and weighed. All fish sampled were filleted and the fillet was frozen at −80 °C. After each tank sampling, the amount of feed administered was adjusted to account for the new body weight of the group.
2.3.2.5. Extraction procedure. Fish muscle samples (5 g) after homogenization were placed into a 15 ml polypropylene centrifuge tube. 10 ml of 0.2% formic acid in acetonitrile was added, the mixture was vortexed for 10 min and sonicated for 15 min then the mixtures were centrifuged for 10 min at 3000 rpm at room temperature, the supernatant was transferred to a 25 ml volumetric flask, then 10 ml of methanol was added to the residue, the mixture was vortexed for 10 min and sonicated for 15 min then the mixtures were centrifuged for 10 min at 3000 rpm at room temperature, the supernatant was transferred to the same flask. The two supernatants mixed and evaporated to 1.5 ml using nitrogen stream and centrifuged for 10 min at 4500 rpm at 4 °C (cold centrifugation) then the supernatant syringe filtered (0.2 μm, nylon) into amber vials analysis.
2.4. Chromatographic conditions
HPLC separation and quantitation were made on a 150 × 4.6 mm (i.d.) Phenomenex® (5 μm particle size) reversed-phase C18 analytical column. The best composition of the mobile phase through gradient elution was prepared by 0.1% formic acid in water as mobile phase A – acetonitril as mobile phase B, the mobile phase B was initially started at 10% then it was gradient up to 20% over 8 min, then it was gradient up to 40% over 6 min, then it was isocratically held for 8 min. Finally, the column was equilibrated for 10 min at the initial mobile phase composition before each analysis. The flow rate was maintained at 1.2 ml min−1 at all phases of the gradient run. All determinations were performed at 25 °C. The injection volume was 5 μl. Quantitation was achieved with UV detection at 260 nm based on peak area. Data acquisition was performed on Class-VP software.2.4.1.1. Screening experiments with the aid of fractional factorial design (FFD). Before starting an optimization procedure, it is important to identify the crucial factors affecting the quality of the derived outcomes. In the present study the significance of four independent factors on the quality of the separation was investigated using a half FFD. Fractional factorial design involves 2k − p experiments, where k is the number of factors studied and p accounts for the degree of fractionality of the fractional factorial design (p < k),29, (p = 1 in the half FFD). The matrix for fractional factorial design is shown in Table 1. The mathematical model associated with design consists of main and possible interaction effects (eqn (2)).
| (a) | |||
|---|---|---|---|
| Independent factors | Levels | ||
| Level (−1) | Level (0) | Level (+1) | |
| A – ACN% start | 10 | 15 | 20 |
| B – ACN% end | 35 | 40 | 45 |
| C – column temperature (°C) | 25 | 30 | 35 |
| D – flow rate (ml min−1) | 0.8 | 1 | 1.2 |
| (b) | |||||||||
|---|---|---|---|---|---|---|---|---|---|
| Std order | Run order | Experimental design | Experimental set-up | ||||||
| Factor 1 | Factor 2 | Factor 3 | Factor 4 | ACN% start | ACN% end | Temp. °C | Flow rate (ml min−1) | ||
| 3 | 1 | −1 | 1 | −1 | 1 | 10 | 50 | 25 | 1.2 |
| 1 | 2 | −1 | −1 | −1 | −1 | 10 | 40 | 25 | 0.8 |
| 8 | 3 | 1 | 1 | 1 | 1 | 20 | 50 | 35 | 1.2 |
| 2 | 4 | 1 | −1 | −1 | 1 | 20 | 40 | 25 | 1.2 |
| 6 | 5 | 1 | −1 | 1 | −1 | 20 | 40 | 35 | 0.8 |
| 7 | 6 | −1 | 1 | 1 | −1 | 10 | 50 | 35 | 0.8 |
| 5 | 7 | −1 | −1 | 1 | 1 | 10 | 40 | 35 | 1.2 |
| 4 | 8 | 1 | 1 | −1 | −1 | 20 | 50 | 25 | 0.8 |
| 9 | 9 | 0 | 0 | 0 | 0 | 15 | 45 | 30 | 1 |
| (c) | ||||
|---|---|---|---|---|
| Run order | Respones | |||
| Rt (TMP) | Rt (FLU) | Rs (SDI–STZ) | Rs (NAL–FLU) | |
| 1 | 4.3 | 15.2 | 2.3 | 2.62 |
| 2 | 5.76 | 20.83 | 2.1 | 3.7 |
| 3 | 1.76 | 13.9 | 0 | 3.3 |
| 4 | 1.56 | 13.5 | 0 | 4.67 |
| 5 | 2.58 | 17.75 | 0 | 3.7 |
| 6 | 5.7 | 16.83 | 1.85 | 1.88 |
| 7 | 4.1 | 16.62 | 1.95 | 3.3 |
| 8 | 2.67 | 15.2 | 0 | 3.24 |
| 9 | 2.9 | 15.8 | 0.88 | 3.52 |
In the present study four factors (Table 1) were examined, namely the initial fraction of mobile phase B (%), the final fraction of mobile phase B (%), column temperature (°C) and flow rate (ml min−1). All experiments were conducted in a randomized order and in triplicate. The response factors chosen were the resolution of critically separated peaks SDI and STZ peaks (Rs (SDI–STZ)) and FLU and NAL peaks (Rs (NAL–FLU)), the retention time of the first eluted peak Rt (TMP) and the retention time of the last eluted peak Rt (FLU).
2.4.1.2. Optimization using central composite design (CCD). From the results of the FFD, a central composite design was built using only the variables that were found significant. CCD can be applied to optimize an HPLC separation by gaining better understanding of factor's main and interaction effects. The CCD was built from the full factorial design 2k to which star and center points were added. The length of the arms of the star determined the number of levels and the shape of the experimental design. The CCD was completed by addition of center points. The total number N of experiments with k factors is: N = 2k + 2k + c. The first term is related to the full factorial design, the second to the star points and the third to the center point. The length of the arms of the star (α) played a major role for the appearance of the CCD. If α ≠ 1, each variable will assume five levels (−α, −1, 0, +1, +α).30 In the present study, a rotatable CCD (RCCD) was used. In this type of design the star points are equal to ±(2k)1/4 (α = 1.68). The information is equally generated from all directions, i.e. the variance of the estimated responses is the same at all points on a sphere centered at the origin. Six center point replications were done to consider the experimental errors. Then, the 30 experiments (N = 16 + 8 + 6) were done in random order. All factors were found significant in the screening study. Table 2 summarizes the conducted experiments and responses. The quadratic mathematical model for the three independent factors is given in eqn (3).
| (a) | |||||||||
|---|---|---|---|---|---|---|---|---|---|
| Std order | Run order | Experimental design | Experimental set-up | ||||||
| Factor 1 | Factor 2 | Factor 3 | Factor 4 | ACN% start | ACN% end | Temp. °C | Flow rate (ml min−1) | ||
| 7 | 1 | −1 | 1 | 1 | −1 | 10 | 50 | 35 | 0.8 |
| 4 | 2 | 1 | 1 | −1 | −1 | 20 | 50 | 25 | 0.8 |
| 16 | 3 | 1 | 1 | 1 | 1 | 20 | 50 | 35 | 1.2 |
| 10 | 4 | 1 | −1 | −1 | 1 | 20 | 40 | 25 | 1.2 |
| 22 | 5 | 0 | 0 | 2 | 0 | 15 | 45 | 40 | 1 |
| 13 | 6 | −1 | −1 | 1 | 1 | 10 | 40 | 35 | 1.2 |
| 2 | 7 | 1 | −1 | −1 | −1 | 20 | 40 | 25 | 0.8 |
| 26 | 8 | 0 | 0 | 0 | 0 | 15 | 45 | 30 | 1 |
| 21 | 9 | 0 | 0 | 0 | 0 | 15 | 45 | 30 | 1 |
| 29 | 10 | 0 | 0 | 0 | 0 | 15 | 45 | 30 | 1 |
| 23 | 11 | 0 | 0 | 0 | −2 | 15 | 45 | 30 | 0.6 |
| 14 | 12 | 1 | −1 | 1 | 1 | 20 | 40 | 35 | 1.2 |
| 11 | 13 | −1 | 1 | −1 | 1 | 10 | 50 | 25 | 1.2 |
| 6 | 14 | 1 | −1 | 1 | −1 | 20 | 40 | 35 | 0.8 |
| 15 | 15 | −1 | 1 | 1 | 1 | 10 | 50 | 35 | 1.2 |
| 30 | 16 | 0 | 0 | 0 | 0 | 15 | 45 | 30 | 1 |
| 3 | 17 | −1 | 1 | −1 | −1 | 10 | 50 | 25 | 0.8 |
| 27 | 18 | 0 | 0 | 0 | 0 | 15 | 45 | 30 | 1 |
| 28 | 19 | 0 | 0 | 0 | 0 | 15 | 45 | 30 | 1 |
| 12 | 20 | 1 | 1 | −1 | 1 | 20 | 50 | 25 | 1.2 |
| 17 | 21 | −2 | 0 | 0 | 0 | 5 | 45 | 30 | 1 |
| 20 | 22 | 0 | 2 | 0 | 0 | 15 | 55 | 30 | 1 |
| 24 | 23 | 0 | 0 | 0 | 2 | 15 | 45 | 30 | 1.4 |
| 25 | 24 | 0 | 0 | 0 | 0 | 15 | 45 | 30 | 1 |
| 1 | 25 | −1 | −1 | −1 | −1 | 10 | 40 | 25 | 0.8 |
| 19 | 26 | 0 | −2 | 0 | 0 | 15 | 35 | 30 | 1 |
| 5 | 27 | −1 | −1 | 1 | −1 | 10 | 40 | 35 | 0.8 |
| 18 | 28 | 2 | 0 | 0 | 0 | 25 | 45 | 30 | 1 |
| 9 | 29 | −1 | −1 | −1 | 1 | 10 | 40 | 25 | 1.2 |
| 8 | 30 | 1 | 1 | 1 | −1 | 20 | 50 | 35 | 0.8 |
| (b) | ||||
|---|---|---|---|---|
| Run order | Respones | |||
| Rt (TMP) | Rt (FLU) | Rs (SDI–STZ) | Rs (NAL–FLU) | |
| 1 | 5.81 | 16.85 | 2.31 | 2.04 |
| 2 | 2.66 | 15.42 | 0 | 3.28 |
| 3 | 1.77 | 12.82 | 0 | 3.71 |
| 4 | 1.88 | 17.78 | 1.03 | 4.5 |
| 5 | 2.62 | 15.46 | 0.55 | 3.11 |
| 6 | 4.24 | 16.64 | 2.42 | 3.42 |
| 7 | 2.71 | 16.99 | 0 | 4.14 |
| 8 | 2.99 | 15.87 | 0.85 | 3.4 |
| 9 | 3.1 | 15.98 | 1.09 | 3.6 |
| 10 | 2.86 | 15.78 | 0.83 | 3.54 |
| 11 | 3.89 | 19.61 | 0.82 | 2.96 |
| 12 | 1.76 | 13.36 | 0 | 4.31 |
| 13 | 4.61 | 15.23 | 2.86 | 2.61 |
| 14 | 2.64 | 16.31 | 0 | 3.77 |
| 15 | 5.69 | 16.84 | 1.91 | 2.06 |
| 16 | 2.2 | 15.79 | 0.75 | 3.57 |
| 17 | 6.42 | 17.26 | 2.58 | 2.26 |
| 18 | 2.82 | 15.8 | 0.88 | 3.59 |
| 19 | 2.89 | 15.79 | 0.8 | 3.54 |
| 20 | 1.79 | 13.11 | 0 | 4.2 |
| 21 | 8.05 | 17.3 | 4.98 | 2.66 |
| 22 | 2.9 | 14.69 | 0.81 | 2.75 |
| 23 | 2.13 | 14.17 | 0.94 | 4.23 |
| 24 | 2.89 | 15.82 | 0.96 | 3.57 |
| 25 | 6.43 | 22.63 | 3.25 | 3.62 |
| 26 | 2.94 | 18.76 | 0.91 | 4.75 |
| 27 | 5.76 | 20.72 | 2.12 | 3.46 |
| 28 | 2 | 11.97 | 0 | 3.83 |
| 29 | 4.58 | 17.03 | 2.8 | 3.01 |
| 30 | 2.66 | 15.42 | 0 | 3.28 |
Surface plots were developed using the fitted quadratic polynomial equation and were used to locate the points of maximum HPLC response for each analyte in the considered domain. The optimal conditions were obtained by choosing the best optimum value for each the HPLC response.
2.5. Mass spectrometry
The residue from real samples were analyzed using ABSCIEX® plus ion trap mass spectrometer coupled to an Agilent 1100 capillary LC system. Samples and standard solutions were separated on an Agilent Zorbax® reversed-phase C8, 5 μm, 150 mm × 2.1 mm column at 30 °C using a mobile phase gradient of aqueous 0.1% formic acid solution and methanol at a flow rate of 0.3 ml min−1. Analytes were detected with electro spray ionization (ESI) in positive mode. The drying gas was operated at a flow rate of 10 ml min−1 at 350 °C. The nebulizer pressure was 45 psig, the capillary was set at 4000 V, and the fragmentor was set at 100 V. For each compound, the protonated molecular ion, [M + H]+, and at least one confirming ion were acquired.3. Results and discussion
3.1. Sample preparation
| No. | Method | Recovery% | |||||||
|---|---|---|---|---|---|---|---|---|---|
| TMP | SDI | STZ | CTC | DOX | FF | NAL | FLU | ||
| a Mean of three determinations. | |||||||||
| 1 | Condition: 2 ml MeOH + 2 ml H2O, washing: 2 ml H2O, elution: 5 ml MeOH | 18.45 | 0.43 | 1.88 | 64.26 | 64.14 | 12.35 | 30.22 | 39.80 |
| 2 | Condition: 2 ml MeOH + 2 ml H2O, washing: 2 ml H2O, elution: 5 ml ACN | 50.80 | 10.30 | 9.34 | 10.40 | 23.00 | 46.50 | 5.59 | 6.20 |
| 3 | Condition: 2 ml MeOH + 2 ml H2O, washing: 2 ml H2O, elution: 2.5 ml MeOH + 2.5 ml ACN | 22.24 | 9.80 | 10.90 | 29.73 | 97.00 | 55.58 | 12.04 | 19.77 |
| 4 | Condition: 2 ml MeOH + 2 ml H2O, washing: 2 ml H2O, elution: 3.5 ml MeOH + 1.5 ml DCM | 6.50 | 1.58 | 5.69 | 82.7 | 112.00 | 23.90 | 19.70 | 15.30 |
| 5 | Condition: 2 ml MeOH + 2 ml H2O, washing: 2 ml H2O, elution: 2.5 ml MeOH + 2 ml ACN + 0.5 ml DCM | 45.00 | 8.70 | 19.00 | 51.00 | 61.00 | 33.00 | 83.00 | 77.00 |
| 6 | Condition: 2 ml MeOH + 2 ml H2O, washing: 2 ml 1% formic acid, elution: 2.5 ml MeOH + 2 ml ACN + 0.5 ml DCM | 28.00 | 9.90 | 20.70 | 116.00 | 101.00 | 37.00 | 73.00 | 20.00 |
| 7 | Condition: 2 ml MeOH + 2 ml H2O, washing: 2 ml 1% NH3 + 2 ml 1% formic acid + 2 ml 2% MeOH, elution: 2 ml MeOH + 2 ml ACN + 1 ml DCM | 3.38 | — | — | 3.70 | 9.20 | 10.77 | 20.00 | 38.38 |
| 8 | Adjust pH = 3 by formic acid, condition: 2 ml MeOH + 2 ml H2O + 2 ml 5% NH3 in MeOH + 2 ml 0.1% formic acid, washing: H2O, elution: 3 ml MeOH + 2 ml 5% NH3 in MeOH | 12.20 | 7.00 | 7.90 | 9.60 | 61.70 | 51.30 | 92.00 | 96.00 |
| 9 | Adjust pH = 3 by formic acid, condition: 2 ml MeOH + 2 ml H2O + 2 ml 0.1% formic acid, washing: no, elution: 3 ml ACN + 2 ml 1% formic acid in MeOH | — | 2.30 | 1.60 | 3.30 | 5.50 | — | 25.40 | 28.70 |
| 10 | Adjust pH = 2 by formic acid, condition: 2 ml MeOH + 2 ml H2O, washing: no, elution: 5 ml 5% NH3 in MeOH | 56.90 | 81.30 | 82.60 | 55.30 | 105.00 | 96.20 | 19.4 | 18.70 |
| 11 | Condition: 2 ml MeOH + 2 ml H2O + 2 ml 0.1% formic acid, washing: 2 ml 0.1% formic acid, elution: 5 ml 0.1% formic acid in CAN | — | — | — | — | — | — | 42.80 | 42.80 |
| 12 | Adjust pH = 5 by 0.1 M acetic buffer, condition: 2 ml MeOH + 2 ml H2O + 2 ml acetic buffer, washing: 3 ml acetic buffer, elution: 5 ml CAN | — | 1.70 | 1.20 | 28.90 | 31.70 | — | 36.70 | 68.00 |
| 13 | Adjust pH = 1.8–2 by formic acid, condition: 2 ml MeOH + 2 ml H2O, washing: no, elution: 3 ml MeOH + 1.5 ml ACN + 0.5 ml DCM | 85.30 | 85.66 | 88.00 | 89.39 | 92.10 | 95.69 | 15.23 | 9.69 |
| 14 | Adjust pH = 1.8–2 by formic acid, condition: 2 ml MeOH + 2 ml H2O, washing: no, elution: 5 ml MeOH | 68.80 | 63.20 | 81.00 | 79.00 | 85.00 | 98.00 | 30.15 | 20.22 |
The results obtained in Table 3 show that flumequine and nalidixic acid had high percentage recovery in trail (no. 8), and trimethoprim, sulfadiazine, sulfathiazole, chlortetracycline, doxycycline and florfenicol had high percentage recovery in trail (no. 13), so that trails eight and thirteen used for the extraction of the studied compound from water.
3.2. Chromatographic conditions
| Factors | Rt (TMP) | Rt (FLU) | Rs (SDI–STZ) | Rs (NAL–FLU) | ||||
|---|---|---|---|---|---|---|---|---|
| F | pa | F | pa | F | pa | F | pa | |
| a p-Value should be less than 0.05 to be statistically significant. | ||||||||
| Model | 34.920 | 0.0023 | 6.940 | 0.0436 | 111.070 | 0.0002 | 27.66 | 0.0036 |
| A-ACN% start | 116.620 | 0.0004 | 8.720 | 0.0419 | 441.270 | <0.0001 | 35.29 | 0.0040 |
| B-ACN% end | 0.150 | 0.7154 | 5.550 | 0.0780 | 0.066 | 0.8105 | 56.89 | 0.0017 |
| C-temp | 0.0260 | 0.8789 | 0.049 | 0.8350 | 2.360 | 0.1991 | 12.75 | 0.0234 |
| D-flow rate | 22.880 | 0.0088 | 13.450 | 0.0215 | 0.590 | 0.4850 | 5.70 | 0.0755 |
| Radj2 | 0.9643 | 0.9882 | 0.9822 | 0.9702 | ||||
The results indicated that the initial fraction of mobile phase B (ACN% start) had the most significant effects on the all the selected responses, the final fraction of mobile phase B (ACN% end) and column temperature (°C) had the most significant effects on the resolution of critically separated peak NAL and FLU peak (Rs (NAL–FLU)) and flow rate (ml min−1) had the most significant effects on the retention time of the first eluted peak Rt (TMP) and the last eluted peak Rt (FLU). Radj2 was greater than 0.85 in all cases, revealing good fit of experimental data.29 In Fig. 1, perturbation plots are presented, this type of plots shows the effect of an independent factor on a specific response, with all factors held constant at a reference point, a steepest slope indicates sensitiveness to a specific factor.31
 | ||
| Fig. 1 Perturbation plots showing the effect of the examined factors on the responses (a) the retention time of the first eluted peak Rt (TMP), (b) the retention time of the last eluted peak Rt (FLU), (c) the resolution of critical pair peaks Rs (SDI–STZ) and (d) the resolution of critical pair peaks Rs (FLU–NAL), where A is the initial fraction of mobile phase B (ACN% start), B is the final fraction of mobile phase B (ACN% end), C is column temperature (°C) and D is flow rate (ml min−1). | ||
| Factors | Rt (TMP) | Rt (FLU) | Rs (SDI–STZ) | Rs (NAL–FLU) | ||||
|---|---|---|---|---|---|---|---|---|
| F | pa | F | pa | F | pa | F | pa | |
| a p-Value should be less than 0.05 to be statistically significant. | ||||||||
| Model | 38.91 | <0.0001 | 24.16 | <0.0001 | 61.66 | <0.0001 | 16.98 | <0.0001 |
| A – ACN% start | 417.01 | <0.0001 | 39.35 | <0.0001 | 724.81 | <0.0001 | 72.71 | <0.0001 |
| B – CAN% end | 0.52 | 0.4831 | 24.42 | <0.0001 | 3.97 | 0.0648 | 67.57 | <0.0001 |
| C – temp | 0.82 | 0.3698 | 1.98 | 0.1719 | 19.94 | 0.0005 | 3.86 | 0.0643 |
| D – flow rate | 44.15 | <0.0001 | 30.88 | <0.0001 | 0.85 | 0.3708 | 10.71 | 0.0040 |
| Radj2 | 0.9782 | 0.9516 | 0.9670 | 0.9664 | ||||
Obtaining an optimal procedure required different dependent and independent variables to be simultaneously set. Derringer's desirability function D (eqn (4)) was used to estimate the optimum conditions of separation.31
Derringer's desirability function D can take values from 0 to 1. For a value of D close to 1, response values are near the target value. The constraints in this study that were imposed on the responses included maximizing a resolution greater than 1.5, a retention time of TMP greater than 3 min and minimizing a retention time of FLU peak less than 20 min. Optimization was performed with the aid of Design Expert Version 7.1. The response surface obtained for the desirability function is presented in Fig. S7.† Therefore, the following conditions can be identified as optimal: 0.1% formic acid in water (mobile phase A) and acetonitrile (mobile phase B). The gradient program consisted of 0–8 min 10% mobile phase B; 8–14 min gradient up to 20% mobile phase B; 14–20 min gradient up to 40% mobile phase B. After 20 min, the gradient was returned to the initial condition and the analytical column was reconditioned for 10 min. The flow rate was maintained at 1.2 ml min−1 at all phases of the gradient run. The column temperature set at 25 °C. Chromatogram of blank water (Fig. 2a) showed no interfering peaks at the retention times of the analytes. Fig. 2b and c show a typical chromatograms for the spiked samples prepared from water, containing analytes where the drugs were well separated. The peaks obtained were sharp and have clear baseline separation. Chromatogram of blank fish sample (Fig. 3a) showed no interfering peaks at the retention times of the analytes. Fig. 3b shows a typical chromatograms for the blank fish sample spiked with the target antibiotics after the extraction procedure was applied. It can be observed the optimized extraction procedure provides a clean chromatogram without interferences. The system suitability results are given in Table S2.†
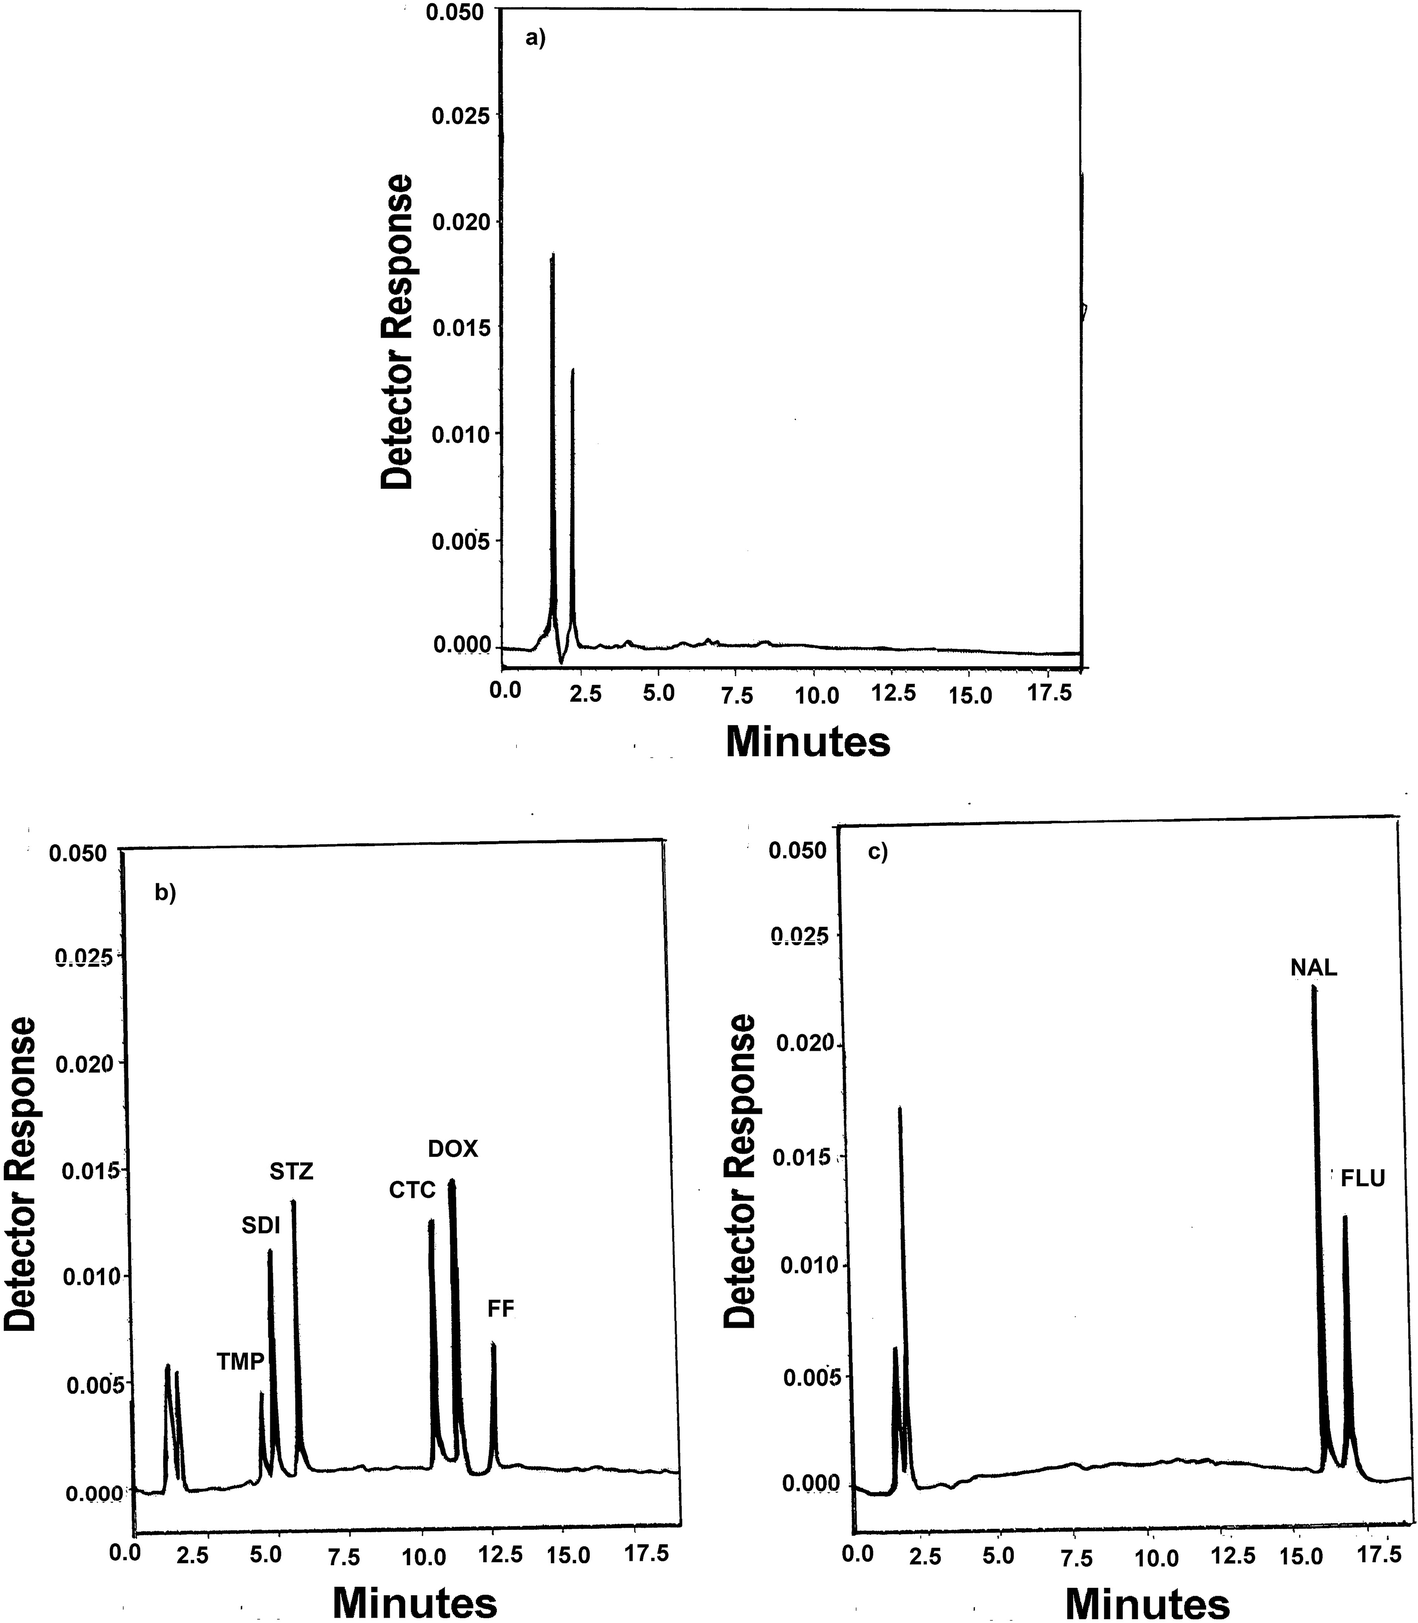 | ||
| Fig. 2 (a) A typical chromatogram of a blank water sample, (b) a typical chromatogram of a blank water sample spiked with 10 μg ml−1 of TMP, 5 μg ml−1 of SDI, 5 μg ml−1 of STZ, 10 μg ml−1 of CTC, 10 μg ml−1 of DOX, 15 μg ml−1 of FF and (c) a typical chromatogram of a blank water sample spiked with 3 μg ml−1 of NAL and 5 μg ml−1 of FLU. | ||
 | ||
| Fig. 3 (a) A typical chromatogram of a blank fish sample and (b) a typical chromatogram of a blank fish sample spiked with 300 μg kg−1 of the target antibiotics after the extraction procedure was applied. | ||
3.3. Mass spectrometry
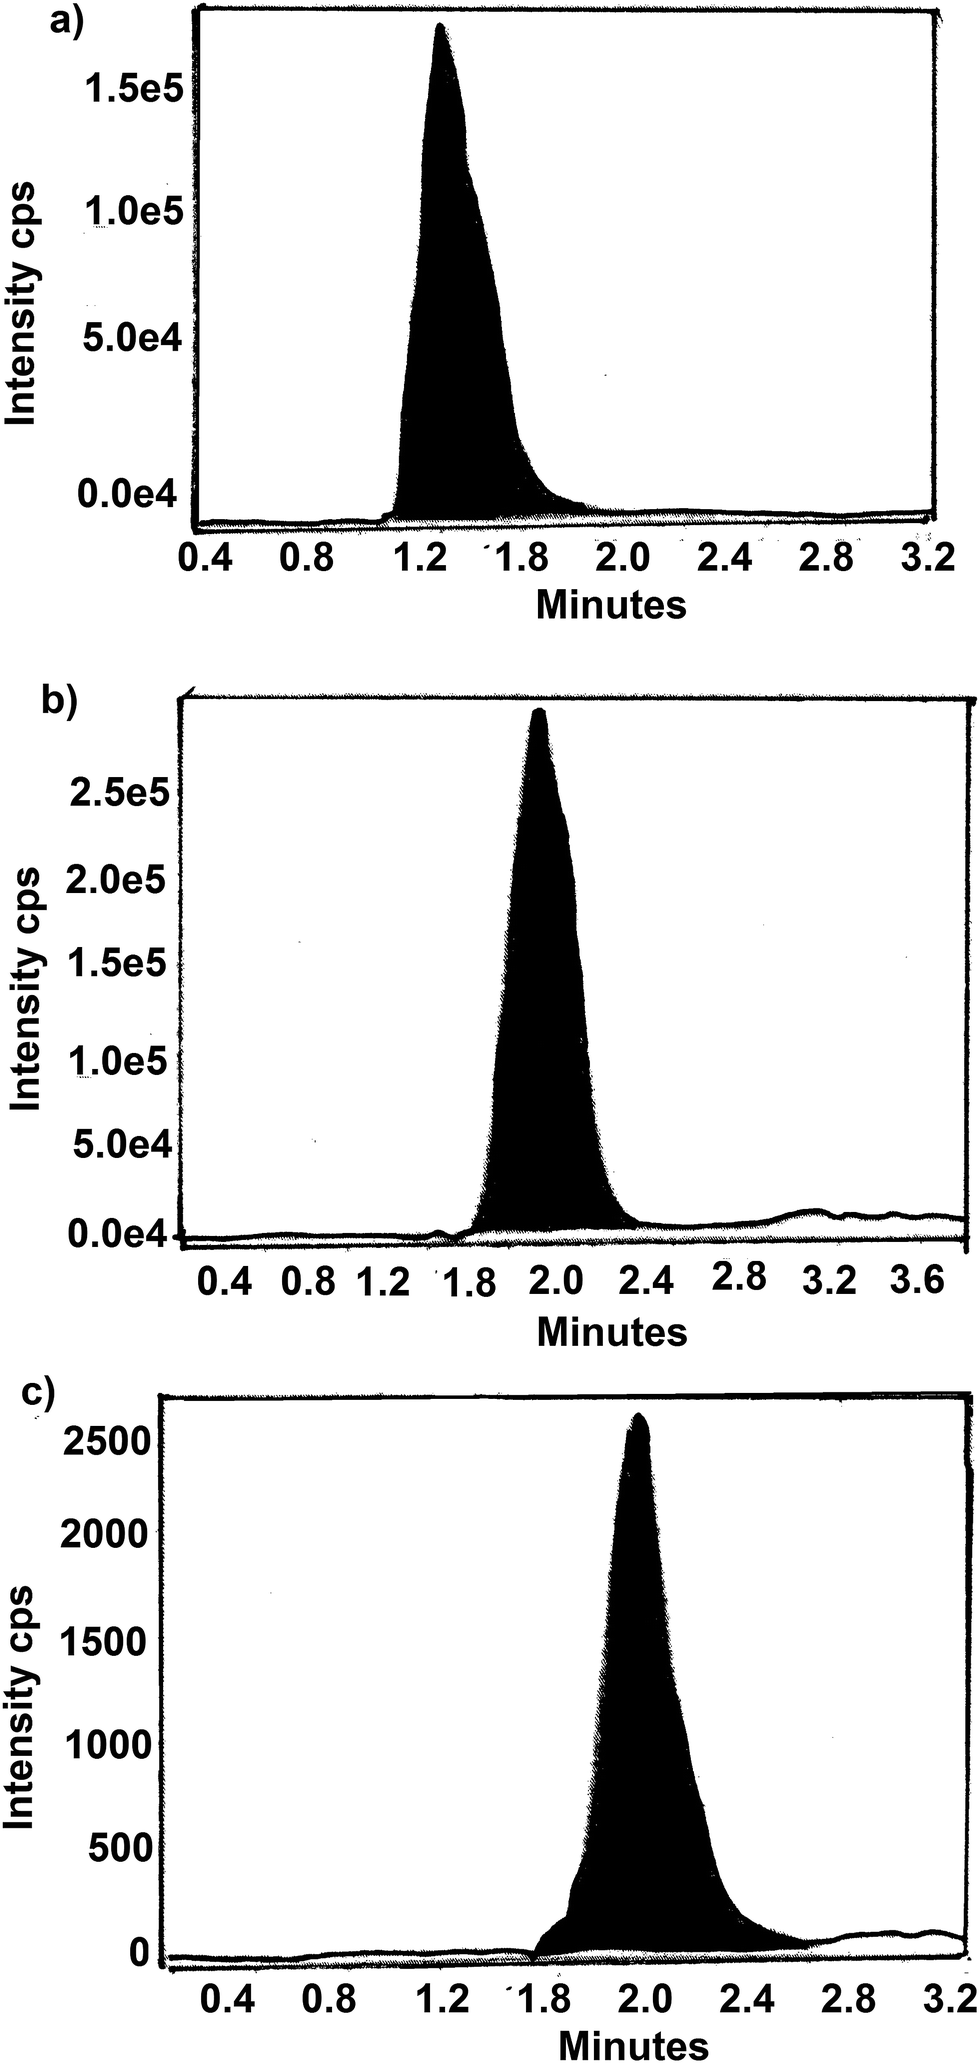
The residue present in fish after oral administration of drugs and water samples removed from water tanks of cultured incurred fish were analyzed by LC-MS method. The chromatogram of samples from day 1 of withdrawal period is shown in Fig. 4 and 5. Table 6 show the amount of residue of SDI, CTC and FF in fish muscle and water throughout the withdrawal period. | ||
| Fig. 4 A typical LC-MS/MS chromatogram of SDI, CTC and FF residues in fish in day 1 of withdrawal period, (a) SDI, (b) CTC and (c) FF. | ||
 | ||
| Fig. 5 A typical LC-MS/MS chromatogram of SDI, CTC and FF residues in water in day 1 of withdrawal period, (a) SDI, (b) CTC and (c) FF. | ||
| (a) | |||
|---|---|---|---|
| Withdrawal time (day) | Drug residue (μg kg−1) | ||
| SDI | CTC | FF | |
| 1 | 20.500 | 15.000 | 5.400 |
| 3 | 9.000 | 7.000 | 2.300 |
| 7 | 4.200 | 3.400 | 1.100 |
| 14 | 2.100 | 1.700 | 0.052 |
| 21 | Not detected | Not detected | Not detected |
| (b) | |||
|---|---|---|---|
| Withdrawal time (day) | Drug residue (μg L−1) | ||
| SDI | CTC | FF | |
| 1 | 0.005 | 0.280 | 0.010 |
| 2 | 0.001 | 0.050 | 0.008 |
| 3 | Not detected | Not detected | 0.002 |
The results obtained in Table 6 show that relatively high levels of SDI, CTC and FF are present in the muscle immediately after stopping of dosing period (day 1 post medication), these levels decrease during withdrawal, as might be expected. On the other hand there are trace levels of drugs concentration present in water sample which could be neglected with regard to the permitted limits.
3.4. Validation of the methods
The linearity of the calibration graphs was validated by the high value of the correlation coefficient and the intercept value, which was not statistically (p = 0.05) different from zero (Table S3) and (Table S4†). Characteristic parameters for regression equations of the HPLC method obtained by least squares treatment of the results are given in Tables S3 and S4.†
The linearity of the LC-MS method for determination of SDI, CTC and FF in water samples was evaluated by matrix-matched calibration curve which prepared by spiking blank water samples at different concentration levels. In this study seven concentrations were chosen, ranging between 0.001–100, 0.001–60, 0.001–20 ng ml−1 for SDI, CTC and FF, respectively. Also for fish sample the linearity was evaluated using matrix-matched calibration, spiking blank extracts at seven different concentration levels (from 10 to 150 μg kg−1). Each concentration was repeated three times; in order to provide information on the variation in peak area values between samples of same concentration.
The linearity of the calibration graphs was validated by the high value of the correlation coefficient and the intercept value. Characteristic parameters for regression equations of the LC-MS method obtained by least squares treatment of the results are given in Tables S5 and S6.†
The developed methods were found to be precise as R.S.D.% value for intra-day precision and inter-day precision studies were <2%, respectively for water. On the other hand. The developed method was found to be precise as R.S.D.% value for repeatability and intermediate precision studies were <5%, respectively for fish samples. While accuracy was expressed as relative error (RE%), the obtained results are within accepted criteria less than ±5%.
A linear relationship (eqn (5)) with no interaction effects was selected as a proper model, since interaction and quadratic effects were excluded. The effects of the examined factors were estimated by ANOVA.
The results are shown in Table S8.† All measurements were conducted in triplicate. Significant effects had a p-value < 0.05. From results it was concluded that the examined factors had no significant effect on the selected responses.
4. Conclusion
An efficient, fast gradient HPLC-UV method for the determination of TMP, SDI, STZ, CTC, DOX, FF, NAL and FLU simultaneously was achieved. Resolution and time of analysis were simultaneously optimized using experimental design which confirms that experimental design and response surface methodology is a flexible procedure, able to reduce the number of experiments needed. The method showed good precision and accuracy, high extraction recovery, wide linear range and robustness. The method has been applied successfully to fish muscle and water samples. The residue of SDI, CTC and FF present in SDI, CTC or FF-incurred fish and water samples obtained from cultured incurred fish farms were determined by LC-MS and from the result, it was found that all analyzed drugs levels are below MRLs established by the European Union for each antibiotic, so fish are safe for using by humans in production and eating purposes.Conflicts of interest
There are no conflicts to declare.References
- G. Rigos and G. M. Troisi, Rev. Fish Biol. Fish., 2005, 15, 53 CrossRef.
- M. J. García-Galán, M. S. Díaz-Cruz and D. Barceló, TrAC, Trends Anal. Chem., 2008, 27, 1008–1022 CrossRef.
- K. Hruska and M. Franek, Vet. Med., 2012, 57, 1–35 Search PubMed.
- S. C. Sweetman, Martindale, The Complete Drug Reference, Pharmaceutical Press, London, 35th edn, 2007 Search PubMed.
- F. Yang, L. ZL, Q. Shan and Z. L. Zeng, J. Vet. Pharmacol. Ther., 2014, 37, 388–393 CrossRef CAS PubMed.
- F. Tajabadi, M. Ghambarian, Y. Yamini and N. Yazdanfar, Talanta, 2016, 160, 400–409 CrossRef CAS PubMed.
- X. Li, Q. Li, A. Xue, H. Chen and S. Li, Anal. Methods, 2016, 8, 517–525 RSC.
- G. Fedorova, V. Nebesky, T. Randak and R. Grabic, Chem. Pap., 2014, 68, 29–36 CAS.
- I. Reinholds, I. Pugajevaa, I. Perkons and V. Bartkevics, J. Pharm. Biomed. Anal., 2016, 128, 126–131 CrossRef CAS PubMed.
- H. S. Chung, J.-H. Choi, A. M. Abd El-Aty, Y.-J. Lee, H. S. Lee, S. Kim, H.-J. Jung, T.-W. Kang, Ho-C. Shin and J.-H. Shim, J. Sep. Sci., 2016, 39, 4688–4699 CrossRef CAS PubMed.
- W. Jansomboon, S. Kitpati Boontanon, N. Boontanon, C. Polprasert and C. T. Da, Food Chem., 2016, 212, 635–640 CrossRef CAS PubMed.
- L. Rocha Guidia, F. Alves Santos, S. R. Ribeiro Ana Cláudia, C. Fernandesa, H. M. Silva Luiz and M. B. A. Gloriaa, Talanta, 2017, 163, 85–93 CrossRef PubMed.
- L. Yao, Y. Wang, L. Tong, Y. Deng, Y. Li, Y. Gana, W. Guo, C. Dong, Y. Duan and K. Zhao, Ecotoxicol. Environ. Saf., 2017, 135, 236–242 CrossRef CAS PubMed.
- A. Serra-Compte, D. Alvarez-Mu noz, S. Rodríguez-Mozazm and D. Barcel, Food Chem. Toxicol., 2016, 3, 1–11 Search PubMed.
- W. Deng, N. Li, H. Zheng and H. Lin, Ecotoxicol. Environ. Saf., 2016, 125, 121–127 CrossRef CAS PubMed.
- N. Dorival-García, C. Labajo-Recio, A. Zafra-Gómez, B. Juárez-Jiménez and J. L. Vílchez, Talanta, 2015, 138, 247–257 CrossRef PubMed.
- H. Wu, Y. Shi, X. Guo, S. Zhao, J. Du, H. Jia, L. He and L. Du, J. Sep. Sci., 2016, 39, 4398–4440 CrossRef CAS PubMed.
- N. Liang, P. Huang, X. Hou, Z. Li, L. Tao and L. Zhao, Anal. Bioanal. Chem., 2016, 408, 1701–1713 CrossRef CAS PubMed.
- H. Feng-Yang, H. Li-Min, J.-W. Yang, K. Bian, Z.-N. Wang, H.-C. Yang and Ya-H. Liu, J. Chromatogr. B: Anal. Technol. Biomed. Life Sci., 2014, 949–950, 79–86 Search PubMed.
- C. Robert, N. Gillard, P.-Y. Brasseur, N. Ralet, M. Dubois and P. Delahaut, Food Control, 2015, 50, 509–515 CrossRef CAS.
- A. Freitas, S. Leston, J. Rosa, C. Castilho Mda, J. Barbosa, P. Rema, M. Â. Pardal and F. Ramos, Food Addit. Contam., Part A: Chem., Anal., Control, Exposure Risk Assess., 2014, 31, 817–826 CrossRef CAS PubMed.
- Y. Tao, F. Zhu, D. Chen, H. Wei, Y. Pan, X. Wang, Z. Liu, L. Huang, Y. Wang and Z. Yuan, J. Food Chem., 2014, 150, 500–506 CrossRef CAS PubMed.
- J. Rossmann, S. Schubert, R. Gurke, R. Oertel and W. Kirch, J. Chromatogr. B: Anal. Technol. Biomed. Life Sci., 2014, 969, 162–170 CrossRef CAS PubMed.
- W. E. Yimei, Y. Zhang, X. Jian, G. Changsheng, L. Lei and F. Wenhong, Fronter. Environmental. Science. Eng., 2014, 8, 357–371 CrossRef.
- K. Škrášková, L. H. Santos, D. Šatínský, A. Pena, M. C. Montenegro, P. Solich and L. Nováková, J. Chromatogr. B: Anal. Technol. Biomed. Life Sci., 2013, 927, 201–208 CrossRef PubMed.
- P. Kowalsk, J. Pharm. Biomed. Anal., 2008, 47, 487–493 CrossRef PubMed.
- M. A. García-Campaña, L. G. Gracia, J. Francisco Lara, M. del Olmo Iruela and C. Cruces-Blanco, J. Anal Bioanal Chem., 2009, 395, 967–986 CrossRef PubMed.
- S. Sadeghi and M. Jahani, Food Chem., 2013, 141, 1242–1251 CrossRef CAS PubMed.
- E. Seifert, L. Abramo and T. Lundstedt, et al., Chemom. Intell. Lab. Syst., 1998, 42, 3–40 CrossRef.
- M. Nowak and A. Seubert, J. Chromatogr. A, 1999, 855, 91–109 CrossRef CAS PubMed.
- T. Sivakumar, R. Manavalan, C. Muralidharan and K. Valliappan, J. Pharm. Biomed. Anal., 2007, 43, 1842–1848 CrossRef CAS PubMed.
- International Conference on Harmonization (ICH), Topic Q2 (R1): Validation of analytical procedures: Text and Methodology, Geneva, Nov 2005, http://http:www.ich.org Search PubMed.
- B. Dejaegher and Y. V. Heyden, J. Chromatogr. A, 2007, 1158, 138–157 CrossRef CAS PubMed.
Footnote |
| † Electronic supplementary information (ESI) available. See DOI: 10.1039/c7ra08398j |
| This journal is © The Royal Society of Chemistry 2017 |