
 Open Access Article
 This Open Access Article is licensed under a
 Creative Commons Attribution 3.0 Unported Licence
Preparation of porous TiO2 photocatalyts with different crystal phases and high catalytic activity by simple calcination of titanate nanofibers†
Yulan Peng‡
a,
Xiaojun Shen‡b,
Lingzhi Wang a,
Baozhu Tiana,
Yongdi Liuc,
Haijun Chend,
Juying Lei*c and
Jinlong Zhang*a
a,
Baozhu Tiana,
Yongdi Liuc,
Haijun Chend,
Juying Lei*c and
Jinlong Zhang*a
aKey Lab for Advanced Materials and Institute of Fine Chemicals, School of Chemistry and Molecular Engineering, East China University of Science and Technology, 130 Meilong Road, Shanghai 200237, P. R. China. E-mail: jlzhang@ecust.edu.cn
bState Environmental Protection Key Laboratory of Environmental Risk Assessment and Control on Chemical Process, East China University of Science and Technology, 130 Meilong Road, Shanghai 200237, P. R. China. E-mail: leijuying@ecust.edu.cn
cFaculty of Chemistry & Material Engineering, Wenzhou University, 276 Xueyuan Road, Wenzhou 325027, Zhejiang Province, P. R. China
dDepartment of Electronics and Tianjin Key Laboratory of Photo-Electronic Thin Film Device and Technology, Nankai University, Tianjin, 300071, China
First published on 25th September 2017
Abstract
A simple method has been developed to prepare porous TiO2 photocatalysts with different crystal phases and large surface area by calcining titanate nanofibers under different temperatures. All the products exhibited excellent photocatalytic activity for RhB degradation under ultraviolet light irradiation.
Introduction
As a common inorganic semiconductor material, titanium dioxide (TiO2) has become the most interesting, and in-depth studied semiconductor material because of its good photocatalytic activity, fine photoelectric effect, high photostability, low toxicity to humans and so on.1–3 However, its crystal composition and microstructure have a great influence on its photocatalytic activity. So far, intense studies have focused on how to efficiently control these affecting factors to achieve a coordinated effect to promote its photocatalytic performance. There are four main crystalline phases of TiO2: anatase, rutile, brookite and TiO2 (B). Among them, rutile with excellent stability is widely applied in paints4 and dye-sensitized solar cells.5 The anatase phase is preferred for applications in photocatalysis, due to its high potential conduction band edge energy.6 Thus, when designing TiO2 as a photocatalyst, phase control must be deeply considered. At the same time, it is also expected that designing TiO2 with a porous microstructure that provides more surface active sites will also result in promoting the photocatalytic performance.Meanwhile, in recent years, a great number of studies have been done on titanate nanostructures,7 particularly, nanotubes,8 and nanowires,9 which have reported that one-dimensional titanate nanostructures have potential applications in many ways, such as can be applied for photocatalysis,10 hydrogen storage,11 lithium-ion battery,12 and solar cells.13 What's more, several studies reported that titanate can be converted to TiO2, under certain reaction conditions.14,15 Therefore, the research on titanate and TiO2 nano-materials possesses both theoretical and practical significance. To date, several methods have been developed to transform titanate into nano-TiO2 with different phases and morphology such as hydrothermal treatment with the assistance of urea16 and direct anodization of titanate in different electrolytes at room temperature.17 But the product is always not separated from each other in regular manner and the process is complicated and considered not environmentally friendly.
In this work, we developed a simple method to transform titanate nanofiber into different phase of porous nano-TiO2. In details, the titanate nanofiber was firstly prepared through hydrothermal at 180 °C for 12 h in a low alkali concentration. After calcinated at different temperatures, the titanate nanofiber transformed into porous TiO2 with different crystalline phases which were then applied in the photocatalytic degradation of RhB. The experimental results demonstrated that the catalysts with anatase phases and mesoporous microstructure have the best photocatalytic activities. Our work reveals that both crystalline phases and microstructure have great influence on the photocatalytic activity, and by controlling the annealing temperature we can get the best performance of the samples. Along with many advantages of the synthesis process, such as being surfactant-free and easy to operate, the synthesis method developed in this study provides a new inspiration for further investigation to the preparation of TiO2 catalysts with advanced structures and high photocatalytic activity.
Results and discussion
The crystal structure and the average grain size of different samples were studied by X-ray diffraction (XRD). Fig. 1 shows the XRD patterns of the samples before and after 2 h of calcination of the titanate nanofibers at different temperatures. It can be found that after calcining at 350 °C for 2 h, the titanate nanofibers were transformed into TiO2-B phase, which is a metastable status of TiO2.18 With increasing the temperature to 450 °C, the sample become mainly anatase TiO2 with a small amount of TiO2-B phase. In the XRD patterns of products calcined from 550 °C to 750 °C, each diffraction peak coincides with that of anatase TiO2,19,20 obviously indicating the products were pure anatase TiO2. When the calcination temperature was increased from 450 °C to 750 °C, the peak intensity of anatase in the XRD spectra for the products increased significantly, indicating that the degree of crystallinity of anatase increases with the increase of the calcination temperature. Meanwhile, the width of the anatase (101) diffraction peak becomes narrower and narrower, suggesting that the TiO2 grain grows and becomes larger in size. When the temperature reached 850 °C, there were both diffraction peaks of rutile and anatase, clearly demonstrating that the transition temperature of anatase to rutile was about 850 °C. As the calcination temperature up to 950 °C, the product transformed to pure rutile, which demonstrated that there is a narrow temperature range from anatase to rutile. A lot of researches reported the occurrence of the phase transition temperature and the temperature range of phase transition depend on the particle size, morphology of crystals, and other additives.21 Particularly, in this experiment, phase transition temperature from anatase to rutile has a narrow range (about 850–950 °C), which may be due to the formation of TiO2 was dehydrated by titanate-H. Therefore, it can be concluded that with the increase of the calcination temperature, the products experienced phase changing process as “Titanate → TiO2-B → TiO2-B + Anatase → Anatase → Anatase + Rutile → Rutile”.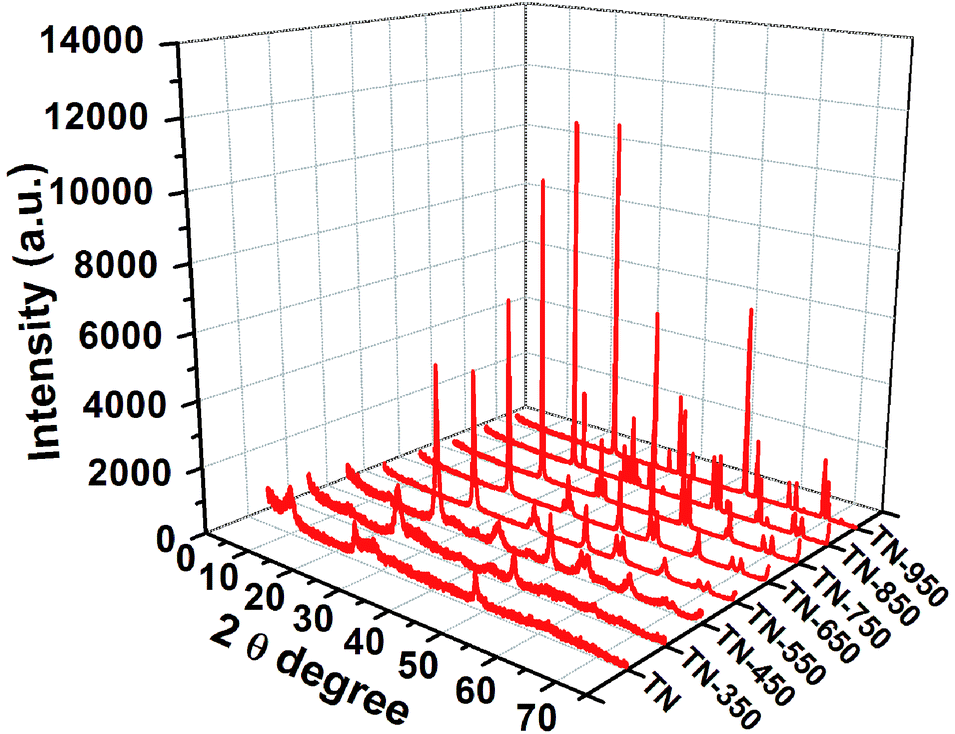 | ||
| Fig. 1 XRD patterns of the titanate nanofiber and its calcined products at different temperatures. | ||
The average particle sizes of TiO2 in the calcined products were obtained by the formula of Scherrer, referring to Table S1.† During the increase of calcination temperature from 450 °C to 750 °C, the average grain size of anatase particles increases from 12.9 nm to 31.6 nm. When the temperature reached 850 °C, rutile occurred, which also resulted in a significant increase in grain size. If the calcination temperature exceeded 850 °C, the rutile grains reached 105 nm, due to the transformation of anatase to rutile with the sintering and growth of rutile.
The surface area and pore-size distribution of the samples were investigated by N2 adsorption–desorption measurements (Fig. 2). According to BDDT (Brunauer–Deming–Deming–Teller) classification criteria, the isotherms of the samples are typical IV curves, and H3 hysteresis loops can be observed for the samples under different calcination temperature; these are typical isotherms of mesoporous materials.22–24 With the increasing of calcination temperature, adsorption–desorption isotherm hysteresis loop of the products shifts to the area with relatively higher pressure, and the area of hysteresis loop is gradually reduced. When the calcination temperature is higher than 750 °C, the hysteresis loop almost disappeared, indicating that mesoporous structure was destroyed at a higher temperature. The specific surface area, pore volume and pore size of different products were calculated which is presented in Table S2.† It can be seen that with the calcination temperature increases, the surface area and pore volume decrease. When the titante nanofibers were calcined at 750 °C, the BET surface area and pore volume both decreased respectively to 21.0 m2 g−1 and 0.098 cm3 g−1, which was because the collapse of the pore structure and the growth of TiO2 grains. With further increase of the calcination temperature, the growth of rutile TiO2 grains led to larger pores between grains and the BET surface area, pore volume and pore size further decreased. The BET surface area of TN-850 was only 3.8 m2 g−1 and its corresponding pore volume was only 0.006 cm3 g−1. For pure rutile TiO2, the BET surface area is only 1.2 m2 g−1 and the pore volume is only 0.006 cm3 g−1.
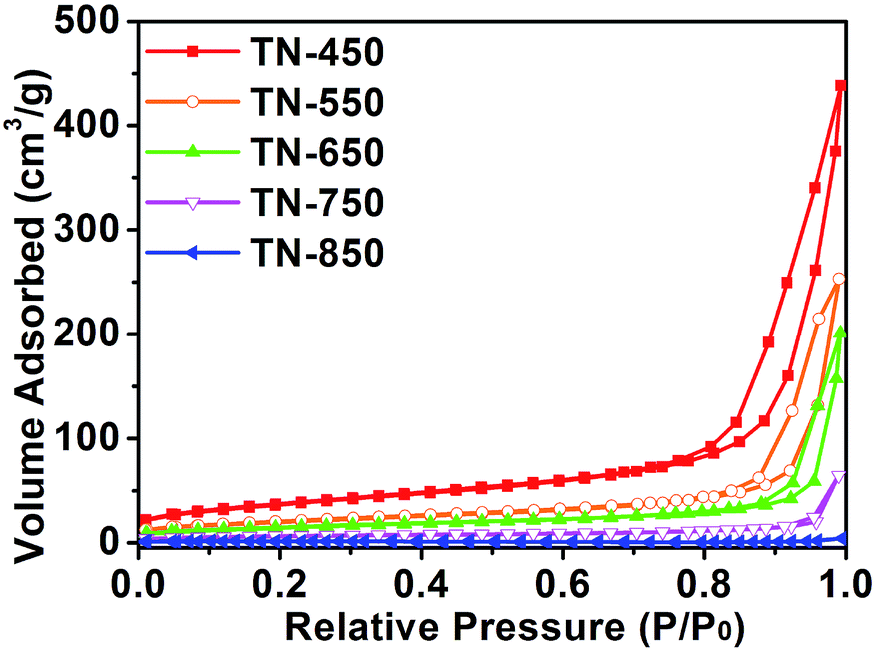 | ||
| Fig. 2 N2 adsorption–desorption isotherms of different samples. | ||
The morphology of different samples are got from SEM images (Fig. 3). Fig. 3A presents the titanate nanofiber before calcination treatment, in which it can be found that the precursor nanofibers are intertwined structure. After calcined under different temperatures, the end of the nanofibers were sintered (Fig. 3B–E), so the morphology has little differences in different temperatures, even though they all derived from the porous nanofibers' accumulation. If the calcination temperature further increased, we found that the structures of the nanofibers were heavily destroyed. When the calcination temperatures were up to 850 °C and 950 °C, along with the process of phase conversion, the structure of the nanofibers were completely destroyed. In addition, the size of TiO2 particles increased significantly as shown in Fig. 3G and H, which is consistent with the XRD and BET datas.
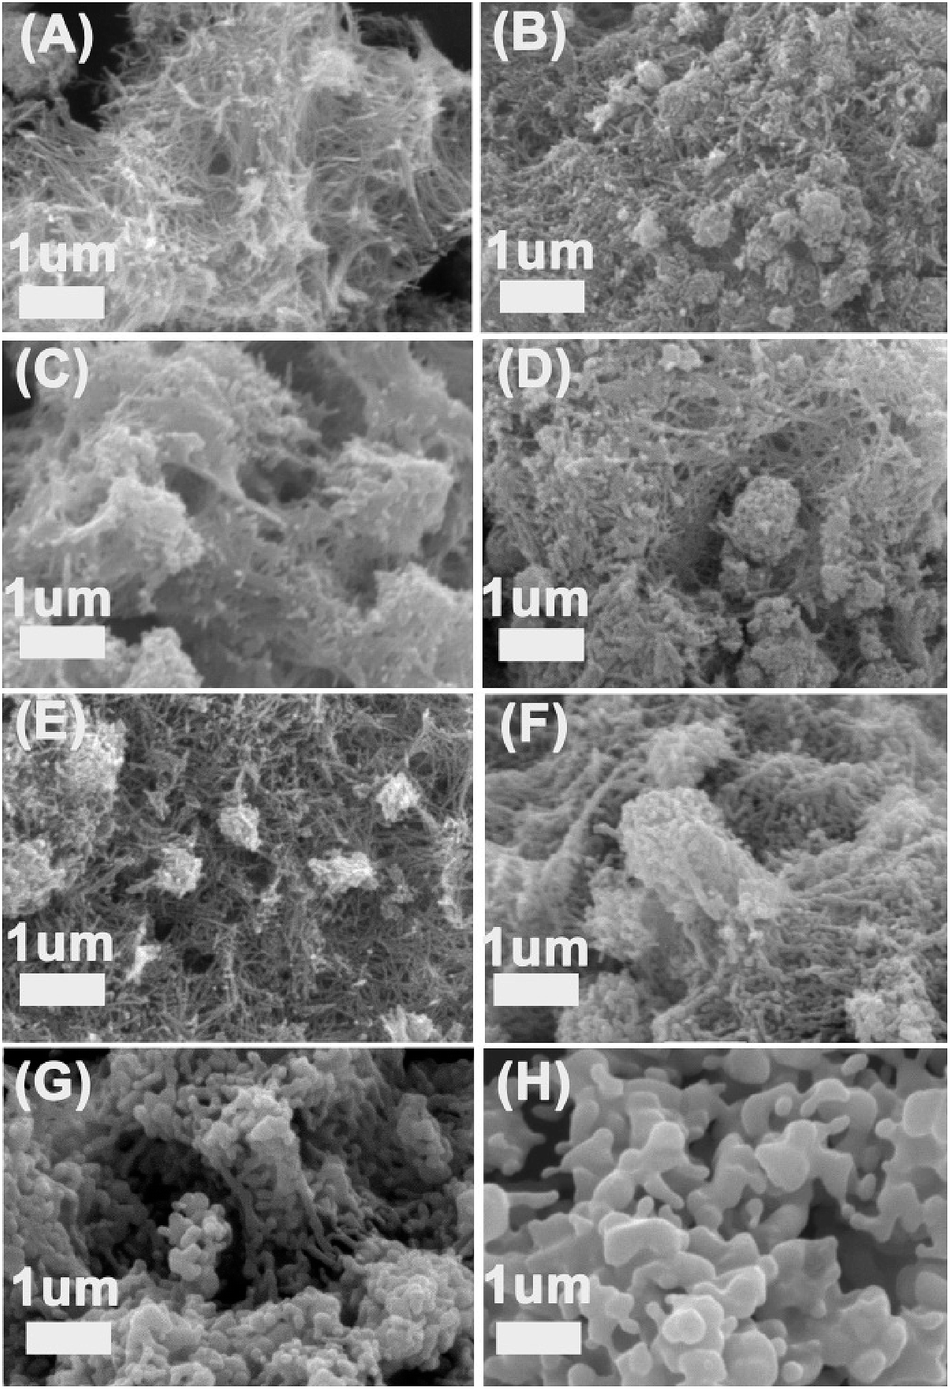 | ||
| Fig. 3 SEM images of the titanate nanofiber and its calcined products: (A) TN, (B) TN-350, (C) TN-450, (D) TN-550, (E) TN-650, (F) TN-750, (G) TN-850, (H) TN-950. | ||
The photoactivity of different samples are test through photodegrade RhB under UV-light. As we can see from the Fig. 4, whether in a low concentration (10 mg L−1) or a higher concentration (20 mg L−1) of RhB solution, the sample which calcined at 650 °C performed best. Proved by the XRD figure, the phase of TiO2 is pure anatase, and anatase is regarded as the more active phase for photocatalysis due to its surface chemistry and potentially high conduction band edge energy.5 Although samples calcinatd from 550–750 °C all exhibits pure anatase phase, but the TN-650 has retained the mesoporous structure and has the biggest pore size among those samples, which may be the reason why the sample has the best performance for degradation RhB. In the degradation of 10 mg L−1 of RhB aqueous solution, almost all the RhB was removed in 50 minutes, while in the degradation of 20 mg L−1 of RhB, the time was 80 minutes, which was both better than the photocatalytic activity of P25. Fig. 4 also shows after calcination at 350–850 °C, the photocatalytic activity was significantly increased compared with the titanate nanofiber. This can be attributed to that TiO2 with good crystallinity (according to XRD figures) could be obtain after the calcination treatments. With the increasing the temperature between 350–650 °C, the photocatalytic activity of the product increases, despite BET specific surface and pore volume of samples decreases, increasing anatase crystallinity of products much more better increases the performance of photocatalyst. When the calcination temperature was higher than 650 °C, the BET surface area and pore volume of the products had significant decrease, which is the main reason for the decreased photocatalytic activity. As the temperature further increasing, phase of rutile arose. The sample TN-850 has a BET surface area of only 3.8 m2 g−1 and a pore volume of only 0.006 cm3 g−1, but its photocatalytic activity was significantly higher than that of TN-350, which can be attributed to its mixture phase of anatase and rutile. It was previously reported25–28 that mixed phase structure of TiO2 can effectively improve the photocatalytic activity. Obviously, the photocatalytic activity of the product TN-950 behaved extremely bad, due to TN-950 is pure rutile TiO2, and the BET surface and pore volume are extremely low. Collectively, the photocatalytic activity is intimately related to the degree of crystallinity, the phase composition and its microstructure.
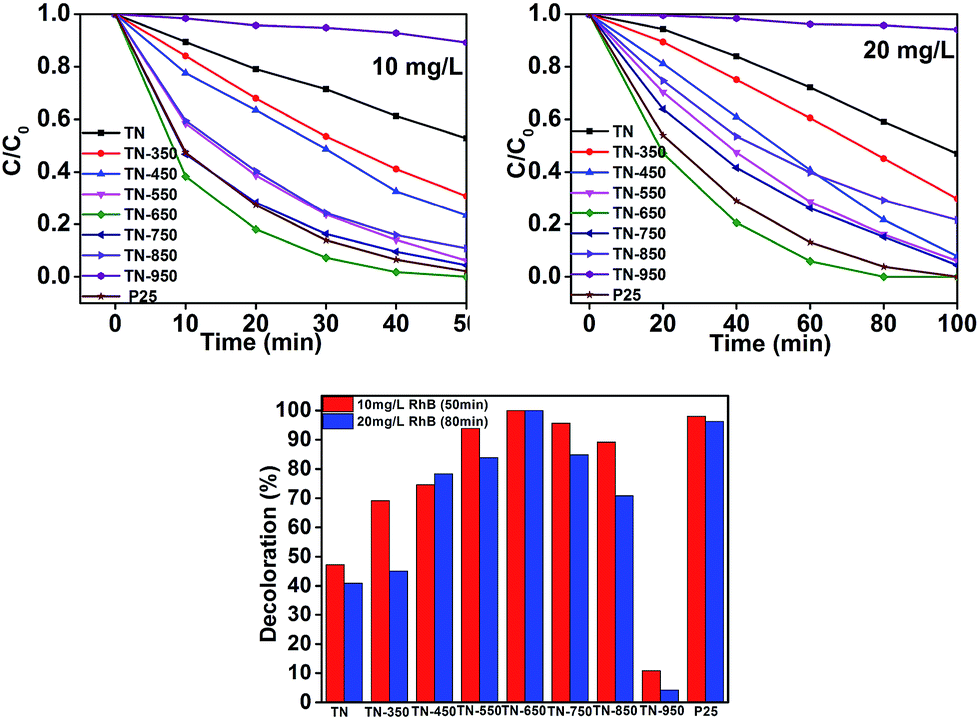 | ||
| Fig. 4 Photocatalytic degradation of 10 mg L−1 and 20 mg L−1 RhB aqueous solution with different catalysts. | ||
Conclusions
In summary, by simply calcining titanate nanofibers at different temperatures, porous TiO2 photocatalysts with different crystal phases and photocatalytic activity were successfully obtained. With the increase of the calcination temperature, the product experiences phase changing process of “Titanate → TiO2-B → TiO2-B + Anatase → Anatase → Anatase + Rutile → Rutile”. The photocatalytic activity of the samples showed a first increasing and then decreasing trend, in which TN-650 prepared by calcination of the titante nanofibers at 650 °C showed the best photocatalytic degradation activity, even higher than the commercial P25, due to its mesoporous microstructure and well crystalline phase of anatase. Furthermore, it is entirely possible that this preparation method can be used to get other photocatalysts which can withstand high temperature.Conflicts of interest
There are no conflicts to declare.Acknowledgements
This work was financially supported by National Nature Science Foundation of China (21407049, 21377038, 21237003, 21677048), Science and Technology Commission of Shanghai Municipality (16JC1401400, 17520711500), China Postdoctoral Science Foundation (2015T80409).Notes and references
- J. Zhang, Y. Wu, M. Xing, S. A. K. Leghari and S. Sajjad, Energy Environ. Sci., 2010, 3, 715–726 CAS.
- L. Hu, Y. Zhang, S. Zhang and B. Li, RSC Adv., 2016, 6, 43098–43103 RSC.
- W. Wang, Y. Liu, J. Qu, Y. Chen and Z. Shao, RSC Adv., 2016, 6, 40923–40931 RSC.
- R. Verma and S. Samdarshi, J. Alloys Compd., 2015, 629, 105–112 CrossRef CAS.
- N.-G. Park, J. Van de Lagemaat and A. Frank, J. Phys. Chem. B, 2000, 104, 8989–8994 CrossRef CAS.
- O.-O. Prieto-Mahaney, N. Murakami, R. Abe and B. Ohtani, Chem. Lett., 2009, 38, 238–239 CrossRef CAS.
- Y. Zhang, Z. Jiang, J. Huang, L. Y. Lim, W. Li, J. Deng, D. Gong, Y. Tang, Y. Lai and Z. Chen, RSC Adv., 2015, 5, 79479–79510 RSC.
- Y. Tang, Z. Jiang, Q. Tay, J. Deng, Y. Lai, D. Gong, Z. Dong and Z. Chen, RSC Adv., 2012, 2, 9406–9414 RSC.
- M. H. A. Rehim, A. M. Youssef, H. Al-Said, G. Turky and M. Aboaly, RSC Adv., 2016, 6, 94556–94563 RSC.
- D. K. Chacko, A. A. Madhavan and T. A. Arun, et al., RSC Adv., 2013, 3, 24858–24862 RSC.
- Z. Weng, H. Guo and X. Liu, et al., RSC Adv., 2013, 3, 24758–24775 RSC.
- Q. Wang, Z. Wen and J. Li, Inorg. Chem., 2006, 45, 6944–6949 CrossRef CAS PubMed.
- J. Qiu, Y. Qiu and K. Yan, et al., Nanoscale, 2013, 5, 3245–3248 RSC.
- X. Shen, J. Zhang and B. Tian, J. Mater. Sci., 2012, 47, 3855–3866 CrossRef CAS.
- H. Li, X. Shen, Y. Liu, L. Wang, J. Lei and J. Zhang, J. Alloys Compd., 2016, 687, 927–936 CrossRef CAS.
- K. Kobayakawa, Y. Murakami and Y. Sato, J. Photochem. Photobiol., A, 2005, 170, 177–179 CrossRef CAS.
- D. Gong, C. A. Grimes, O. K. Varghese, W. Hu, R. Singh, Z. Chen and E. C. Dickey, J. Mater. Res., 2001, 16, 3331–3334 CrossRef CAS.
- B. Zhao, F. Chen, W. Qu and J. Zhang, J. Solid State Chem., 2009, 182, 2225–2230 CrossRef CAS.
- A. A. Ashkarran, M. Ghavamipour, H. Hamidinezhad and H. Haddadi, Res. Chem. Intermed., 2015, 41, 7299–7311 CrossRef CAS.
- H. Li, L. Zhou, L. Wang, Y. Liu, J. Lei and J. Zhang, Phys. Chem. Chem. Phys., 2015, 17, 17406–17412 RSC.
- Q. Sheng, S. Yuan, J. Zhang and F. Chen, Microporous Mesoporous Mater., 2006, 87, 177–184 CrossRef CAS.
- M. Pudukudy, Z. Yaakob and R. Rajendran, Mater. Lett., 2014, 136, 85–89 CrossRef CAS.
- C. Cheng, D. Lu, B. Shen, Y. Liu, J. Lei, L. Wang, J. Zhang and M. Matsuoka, Microporous Mesoporous Mater., 2016, 226, 79–87 CrossRef CAS.
- J. Lei, L. Yang, D. Lu, X. Yan, C. Cheng, Y. Liu, L. Wang and J. Zhang, Adv. Opt. Mater., 2015, 3, 57–63 CrossRef CAS.
- J. Zhu, J. Zhang, F. Chen and M. Anpo, Mater. Lett., 2005, 59, 3378–3381 CrossRef CAS.
- H. Li, X. Shen, Y. Liu, L. Wang, J. Lei and J. Zhang, J. Alloys Compd., 2015, 646, 380–386 CrossRef CAS.
- M. Morozova, P. Dytrych, L. Spacilova and O. Solcova, Res. Chem. Intermed., 2015, 41, 9307–9318 CrossRef CAS.
- J. Lei, H. Li, J. Zhang and M. Anpo, in Low-Dimensional and Nanostructured Materials and Devices, Springer, 2016, pp. 423–460 Search PubMed.
Footnotes |
| † Electronic supplementary information (ESI) available. See DOI: 10.1039/c7ra08381e |
| ‡ These authors contributed equally to this work. |
| This journal is © The Royal Society of Chemistry 2017 |