 Open Access Article
Water uptake and hygroscopicity of perchlorates and implications for the existence of liquid water in some hyperarid environments
Wenjun Guac,
Yongjie Lib,
Mingjin Tang *a,
Xiaohong Jiaac,
Xiang Dinga,
Xinhui Bia and
Xinming Wangad
aState Key Laboratory of Organic Geochemistry, Guangdong Key Laboratory of Environmental Protection and Resources Utilization, Guangzhou Institute of Geochemistry, Chinese Academy of Sciences, Guangzhou 510640, China. E-mail: mingjintang@gig.ac.cn
bDepartment of Civil and Environmental Engineering, Faculty of Science and Technology, University of Macau, Avenida da Universidade, Taipa, Macau, China
cUniversity of Chinese Academy of Sciences, Beijing 100049, China
dCenter for Excellence in Regional Atmospheric Environment, Institute of Urban Environment, Chinese Academy of Sciences, Xiamen 361021, China
First published on 5th October 2017
Abstract
The existence of liquid water is a prerequisite for habitability. Deliquescence of perchlorates under subsaturated conditions has been proposed to explain the occurrence of liquid water in some hyperarid environments on the earth and on the Mars. However, the amount of liquid water associated with perchlorates under different conditions is not well understood yet. In this work, we have measured deliquescence relative humidity (DRH) of three perchlorates at different temperatures from 278 to 303 K. DRH decreases from (42.8 ± 0.6)% at 278 K to (40.5 ± 0.5)% at 303 K for Mg(ClO4)2·6H2O, and from (18.5 ± 0.5)% at 278 K to (15.5 ± 0.5)% at 303 K for Ca(ClO4)2·4H2O; in contrast, deliquescence of KClO4 did not occur even when RH (relative humidity) was increased to 95%. In addition, we have determined the amount of water taken up by Ca(ClO4)2·4H2O and Mg(ClO4)2·6H2O as a function of RH (0–90%) and temperatures (278–298 K). It is found that when both salts are deliquesced, more water (∼10% on average) is associated with Mg(ClO4)2·6H2O than Ca(ClO4)2·4H2O on the per mole ClO4− base. Overall, this work would significantly improve our knowledge in hygroscopicity of perchlorates, and thus may provide fundamental insights into the hydrologic cycles in some hyperarid regions on the earth and on the Mars.
1 Introduction
As we currently understand, liquid water is a prerequisite for the occurrence of life. In hyperarid environments on the earth such as the Atacama Desert in Chile, pure liquid water is not stable due to extremely low water vapor concentrations in the atmosphere.1–3 Deliquescence of soluble minerals, such as chlorates and perchlorates, could lead to the formation of stable aqueous solution (and thus liquid water) in these hyperarid regions.2,4–6 Deliquescence is the phenomenon that under subsaturated conditions a soluble component takes up water vapor and forms a stable aqueous solution.7 Indeed, perchlorates have been found in soils in many arid and/or semi-arid regions on the earth, including the Antarctic Dry Valleys, Southwest US, and the Atacama Desert.8–12 Perchlorates may be formed photochemically from chlorides and emitted by anthropogenic activities,8,11,13–15 but their sources are not entirely clear.The deliquescence of perchlorates is also relevant for the Martian environment. One important question in research of the Mars is whether liquid water exists or existed on the Mars. Evidence which supports the existence of liquid water on the Mars is mounting,16–18 though pure liquid water is not stable on the Mars due to its extremely dry and cold environment as well as low atmospheric pressure. It has been proposed that the presence of perchlorates in Martian soil, which have been detected at a number of sites on the Mars,19,20 can lower the freezing temperature of liquid water and form stable aqueous solutions by absorbing water vapor from the atmosphere even under subsaturated conditions.21–25
Several laboratory and theoretical studies have investigated the deliquescence and efflorescence of perchlorates at different temperatures.22,23,25–28 For example, a laboratory study by Zorzano et al.23 found that sodium perchlorate could absorb water vapor and form aqueous solutions under Martian conditions at temperatures as low as 225 K. The deliquescence relative humidity (DRH) decreases from 64% at 223 K to 42% at 273 K for Mg(ClO4)2·6H2O, and decreases from 64% at 228 K to 51% at 273 K for NaClO4·H2O.25 The DRH of calcium perchlorate varies between 5% and 55% for the temperature range of 223–273 K,22 probably because the hydration state of calcium perchlorate changes at different temperatures. It has not been clearly stated in the two original studies22,25 whether the RH was respected to liquid water or ice, though RH with respect to liquid water is commonly used for DRH.7 In another study using a Raman scattering lidar,26 Mg(ClO4)2·6H2O was found to deliquesce when the temperature is only ∼4 K higher than the frost point. Phase transition of chloride–perchlorate binary mixtures and the salt analog, which closely replicates the composition and relative concentrations of common cations and anions found at the Phoenix landing site on Mars, has also been explored.29,30 While previous studies support the possible occurrence of liquid water in some hyperarid regions on the earth (as well as on the Mars) from a fundamental point of view, a better understanding of hydrologic cycles in these hyperarid environments requires quantitative knowledge of water partitioning between the gas phase and perchlorates under different conditions. However, to our knowledge such information is not available yet.
In this work we have quantitatively measured the amount of water associated with Ca(ClO4)2·4H2O, Mg(ClO4)2·6H2O and KClO4 in equilibrium with water vapor as a function of RH (0–90%) at different temperatures (278–298 K). In addition, we have also determined the DRH of Ca(ClO4)2·4H2O and Mg(ClO4)2·6H2O as a function of temperature (278–303 K) in a very accurate manner. Our results provide quantitative knowledge of deliquescence properties of perchlorates, and thus may help better understand the hydrologic cycles in some hyperarid environments on the earth and on the Mars.
2 Experimental section
The interaction of perchlorates with water vapor under subsaturated conditions was investigated using a commercial vapor sorption analyzer (model no. Q5000SA; manufacturer: TA Instruments, New Castle, DE, USA). The instrument has been detailed in our previous study,31 and here we only briefly describe experimental procedures that are important for this study. High purity N2 was used in this work unless otherwise stated.2.1 Vapor sorption analyzer
The schematic diagram of the vapor sorption analyzer used in this work is shown in Fig. 7 in the Appendix. The principle of this instrument lies on accurate and precise measurements of the absolute mass of the sample under investigation at well controlled temperature and RH. A humidity chamber was used to control the temperature and RH under which the sample was exposed to water vapor. RH was regulated by mixing a dry N2 flow with a humidified N2 flow, both controlled using mass flow controllers (MFC), and the total flow delivered into the humidity chamber was set to 200 mL min−1. Temperature (278–353 K) and RH (0–98%) to which perchlorates were exposed could be programmed and were monitored in real time as well. Temperature stability of ±0.1 K and RH stability of ±1% could be achieved. In this work all the experiments were conducted under isothermal conditions, i.e. during each experiments temperature was kept constant while RH was varied.Two semispherical metalized quartz crucibles, connected to a high-precision balance via hang-down wires, were located in the humidity chamber. These crucibles, each with a volume of 180 μL, were provided by the instrument manufacturer. One crucible contained perchlorate powder and the other one was empty, and therefore water uptake by the empty crucible could be simultaneously measured and subtracted. The balance used to measure sample mass has a dynamic range of 0–100 mg, a stated sensitivity of <0.1 μg, and a weighing accuracy of ±0.1 μg. The baseline drift in mass measurement was found to be <5 μg within 24 h at 20% RH and 298 K when no sample was used for the sample crucible. A small N2 flow (10 mL min−1) was used to purge the balance continuously in order to prevent moisture condensation. In this work the initial mass of perchlorate samples was typically in the range of 1–5 mg, and in each experiments fresh perchlorate samples were used. Since only data under equilibrium were used, the amount of sample should not impact our results; however, it affected the time to reach the equilibrium (i.e. it took longer to reach the equilibrium if the initial mass of the sample was larger).
2.2 Water uptake measurements
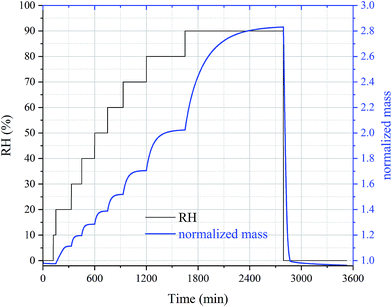
In the first type of experiments, the amounts of water associated with perchlorates were determined as a function of RH at different temperatures. The following experimental procedures were used: (i) temperature was set to a given value; (2) after the temperature was stabilized, the sample was dried at 0% RH (the actual RH was measured to be <5% under “dry” conditions) until the mass change was <0.05% within 30 min; (3) RH was increased stepwise to 90% with an increment of 10% per step, and at each RH the sample was equilibrated with water vapor until its mass became stable (i.e. the sample mass change was <0.1% within 30 min); (4) the sample was dried again at 0% RH until its mass change was <0.1% within 30 min.Fig. 1 shows the dataset for a typical experiment designed to measure the amount of water taken up by Ca(ClO4)2·4H2O as a function of RH at 298 K. Significant increase in sample mass was observed when RH was increased from 10% to 20%, suggesting that the deliquescence of Ca(ClO4)2·4H2O occurred at a RH between 10% and 20% at 298 K. Further increase in RH caused additional increase in sample mass. After RH was returned to 0%, the sample mass was equal to the initial value within the experimental uncertainty, suggesting that after the humidification–dehumidification process, the sample had the same hydration state as the unprocessed one. The data shown in Fig. 1 could be used to derive the amounts of water taken up by Ca(ClO4)2·4H2O as a function of RH.
2.3 DRH determination
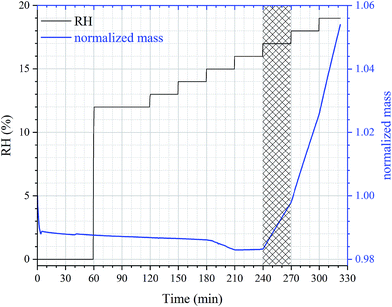
Accurate DRH values were measured in the second set of experiments as a function of temperature for perchlorates, and the following experimental procedures were used: (1) temperature was set to a given value; (2) after the temperature was stabilized, the sample was dried at 0% RH until the mass change was <0.05% within 30 min; (3) RH was then increased to a value which was at least 5% lower than the expected DRH (which could be roughly estimated from experiments described in Section 2.2) and kept at this level for 60 min; (4) RH was increased stepwise with an increment of 1% per step until a significant increase in sample mass occurred, and at each RH the sample was equilibrated with the environment for 30 min. DRH is equal to the RH at which a significant increase in sample mass was observed (i.e. the mass increase was significant compared to the noise level and baseline drift).Fig. 2 shows the time series of sample mass and RH in an experiment to measure DRH of Ca(ClO4)2·4H2O at 298 K. As shown in Fig. 2, a slow and small decrease in sample mass was observed when RH was increased from 0% to 16%, suggesting that gradual loss of residual water, which may be adsorbed by the powdered Ca(ClO4)2·4H2O sample, occurred before it was deliquesced. When RH was increased from 16% to 17% (shadowed region in Fig. 2), a significant increase in sample mass was observed, suggesting that the DRH of Ca(ClO4)2·4H2O was measured to be (16.5 ± 0.5)% (strictly speaking, between 16% and 17%). Fig. 2 also reveals that when RH was above the DRH, further increase in RH would lead to quicker increase in sample mass, as expected.
3 Results and discussion
In this work we have studied water uptake by Ca(ClO4)2·4H2O, Mg(ClO4)2·6H2O and KClO4, because previous studies suggested22,32–35 that they are the most stable forms of Ca(ClO4)2, Mg(ClO4)2 and KClO4 for the temperature range (278–303 K) covered by our work. Ca(ClO4)2·4H2O, Mg(ClO4)2·6H2O and KClO4 were provided by Aldrich with stated purity of >99%. All the chemicals were used as received without any pretreatment.3.1 DRH of perchlorates
DRH values were determined as a function of temperature from 278 to 303 K for Ca(ClO4)2·4H2O and Mg(ClO4)2·6H2O, and the results are summarized in Table 1. The DRH of Mg(ClO4)2·6H2O was found to slightly decrease with increasing temperature, from (42.8 ± 0.6)% at 278 K to (40.5 ± 0.5)% at 303 K. DRH of Mg(ClO4)2·6H2O was measured to be 42% at 273 K by a previous study by Gough et al.,25 and it increased to 64% when temperature decreased to 223 K. The DRH measured at 273 K by Gough et al.25 is in good agreement with that measured at 278 K in our work. In addition, our measured DRH values and their dependence on temperature are also consistent with those calculated using a thermodynamic model25 for temperature in the range of 278–303 K. The thermodynamic model used by Gough et al.25 and Nuding et al.22 was developed by Chevrier et al.24 In brief, this thermodynamic model, in which the Pitzer ion interaction model36 was used to calculate activities of water and different ions, calculated the stability diagram of perchlorates as a function of solute concentration and temperature.24| T (K) | DRH (%) | DRH (%) |
|---|---|---|
| Ca(ClO4)2·4H2O | Mg(ClO4)2·6H2O | |
| 278 | 18.5 ± 0.5 | 42.8 ± 0.6 |
| 283 | 17.5 ± 0.5 | 42.2 ± 0.6 |
| 288 | 17.5 ± 0.5 | 41.5 ± 0.5 |
| 293 | 16.5 ± 0.5 | 41.2 ± 0.6 |
| 298 | 16.5 ± 0.5 | 40.5 ± 0.5 |
| 303 | 16.5 ± 0.5 | 40.5 ± 0.5 |
For comparison, DRH of Ca(ClO4)2·4H2O is much lower than that of Mg(ClO4)2·6H2O at the same temperature. In addition, a weak negative dependence of DRH on temperature was also observed for Ca(ClO4)2·4H2O, with DRH increasing from (15.5 ± 0.5)% to (18.5 ± 0.5)% when temperature decreases from 303 to 278 K. The DRH of calcium perchlorate was measured to be (10 ± 4)% at 273 K and (55 ± 4)% at 223 K by Nuding et al.,22 and the large variation in DRH at different temperatures was suggested to result from the formation of different hydrates at different temperatures. Our measured DRH (∼18.5%) at 278 K is slightly higher than that measured at 273 K (∼10%) by Nuding et al.22 Furthermore, it appears that compared to DRH measured by Nuding et al.,22 our reported values agree better with those predicted by their thermodynamic model.
It is suggested that the dependence of DRH on temperature can be approximated by the Clausius–Clapeyron equation:37–39
 | (1) |
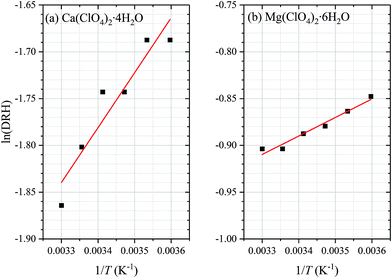 | ||
| Fig. 3 Dependence of deliquescence relative humidities (DRH) of (a) Ca(ClO4)2·4H2O and (b) Mg(ClO4)2·6H2O on temperature in the range of 278–303 K. As suggested by eqn (1), plotting ln(DRH) versus 1/T would generate a straight line, and the two red lines represent the fitted linear lines. | ||
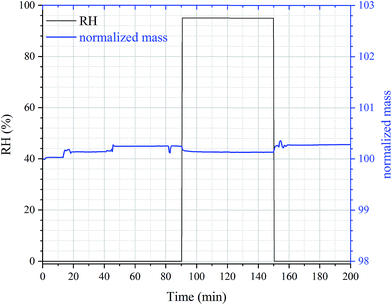
The interaction of water vapor with KClO4 was also explored at 278 and 298 K. As shown in Fig. 4, KClO4 did not take up significant amount of water even when RH was increased from 0% to 95%. This observation suggests that the DRH of KClO4 is above 95% for the temperature range (278–303 K) covered in our work. This is qualitatively consistent with the low solubility of KClO4 in water (∼2.1 g KClO4 in 100 g water) at 298 K reported by Willard and Smith.40
3.2 Mass hygroscopic growth factors of perchlorates
We have further measured the mass hygroscopic growth factors (defined as the ratio of sample mass at a given RH to that at 0% RH) as a function of RH at three different temperatures (278, 288 and 298 K). The results are compiled in Table 2. To our knowledge, the amount of water associated with Ca(ClO4)2·4H2O under well controlled conditions has never been reported, and quantitative information for Mg(ClO4)2·6H2O is also very limited.| RH (%) | Ca(ClO4)2·4H2O | Mg(ClO4)2·6H2O | ||||
|---|---|---|---|---|---|---|
| 298 K | 288 K | 278 K | 298 K | 288 K | 278 K | |
| 0 | 1.0000 ± 0.0001 | 1.0000 | 1.0000 | 1.0000 ± 0.0001 | 1.0000 | 1.0000 |
| 10 | 0.9998 ± 0.0002 | 0.9998 | 0.9997 | 0.9996 ± 0.0001 | 0.9995 | 0.9996 |
| 20 | 1.1573 ± 0.0326 | 1.1988 | 1.2122 | 0.9991 ± 0.0003 | 0.9991 | 0.9993 |
| 30 | 1.2434 ± 0.0355 | 1.2872 | 1.3021 | 0.9988 ± 0.0003 | 0.9988 | 0.9990 |
| 40 | 1.3352 ± 0.0377 | 1.3830 | 1.4001 | 0.9990 ± 0.0009 | 0.9985 | 0.9988 |
| 50 | 1.4419 ± 0.0406 | 1.4942 | 1.5148 | 1.4407 ± 0.0070 | 1.4473 | 1.4631 |
| 60 | 1.5778 ± 0.0436 | 1.6364 | 1.6585 | 1.5788 ± 0.0074 | 1.5868 | 1.6085 |
| 70 | 1.7714 ± 0.0463 | 1.8392 | 1.8664 | 1.7767 ± 0.0081 | 1.7902 | 1.8132 |
| 80 | 2.1004 ± 0.0499 | 2.1895 | 2.2325 | 2.1184 ± 0.0094 | 2.1401 | 2.1852 |
| 90 | 2.9241 ± 0.0349 | 3.0777 | 3.2687 | 2.9876 ± 0.0132 | 3.0677 | 3.2277 |
As shown in Table 2 and Fig. 5, Ca(ClO4)2·4H2O undergoes deliquescence when RH was increased from 10% to 20%, and deliquescence occurred for Mg(ClO4)2·6H2O when RH was increased from 40% to 50%. This is consistent with their measured DRH values (see Section 3.1). After deliquesced, both Ca(ClO4)2·4H2O and Mg(ClO4)2·6H2O could take up significant amount of water under subsaturated conditions. For example, due to absorption of water vapor from the gas phase at 298 K, the mass of Ca(ClO4)2·4H2O was increased by ∼44% at 50% RH, ∼77% at 70% RH, and ∼190% at 90% RH, respectively, compared to the initial mass at 0% RH. It is also observed that at a given RH, decrease in temperature will increase the amounts of water associated with deliquesced Ca(ClO4)2·4H2O and Mg(ClO4)2·6H2O. Toner et al.41 showed that from a thermodynamic point of view, for a given solute concentration, decrease in temperature would lead to decrease in water activity; in other words, for the same water activity (i.e. at a given RH), decrease in temperature would cause decrease in solute concentration, and thus increase in mass ratio of water to solute ratio and increase in mass growth factors. Therefore, our experimental measurement is consistent with theoretical prediction by Toner et al.41
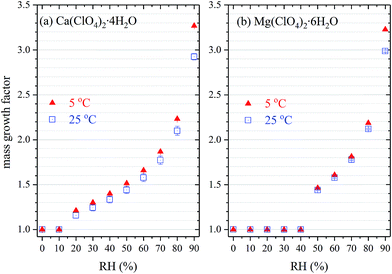 | ||
| Fig. 5 Mass hygroscopic growth factors of (a) Ca(ClO4)2·4H2O and (b) Mg(ClO4)2·6H2O as a function of RH at 278 (triangles) and 298 K (squares). Measurements were also carried out at 288 K, and the results are not displayed in this figure for better readability (but included in Table 2). | ||
Water to solute ratio (WSR), defined as the molar ratio of H2O to ClO4−, can be calculated from the measured mass hygroscopic growth factors, and the results are displayed in Fig. 6. Note that RH in Fig. 6 is plotted on the scale of 0–1 instead of 0–100%. Aqueous water in the solution formed due to deliquescence of Mg(ClO4)2·6H2O or Ca(ClO4)2·4H2O comes from two sources: (i) water absorbed from the gas phase and (ii) water released by Mg(ClO4)2·6H2O or Ca(ClO4)2·4H2O once dissolved. It can be concluded that after both salts were deliquesced (for RH at 50% and above), more water (∼10% on average) was associated with Mg(ClO4)2·6H2O than Ca(ClO4)2·4H2O on the per mole ClO4− base. A recent thermodynamic model study42 suggests that for a given perchlorate concentration in molality (mol kg−1), water activity of Mg(ClO4)2 solution is slightly larger than that for Ca(ClO4)2. Since water activity decreases with solute concentration, this implies that for a given water activity, the molality concentration is smaller for Mg(ClO4)2. In other words, the theoretical work by Toner et al.42 also suggested that at a given RH more water is associated with Mg(ClO4)2 than Ca(ClO4)2 on the per mole ClO4− base.
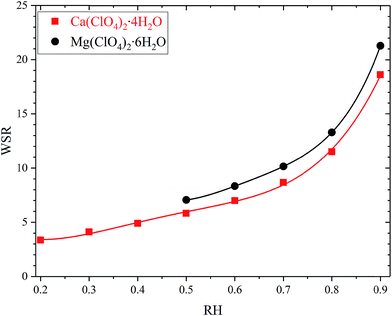 | ||
| Fig. 6 Water to solute ratio (WSR), defined as the molar ratios of H2O to ClO4−, as a function of RH for Ca(ClO4)2·4H2O and Mg(ClO4)2·6H2O after deliquescence at 298 K. The two curves show the polynomial fittings to the experimental data, as described by eqn (2). | ||
As shown in Fig. 6, the dependence of WSR on RH at 298 K for both Ca(ClO4)2·4H2O and Mg(ClO4)2·6H2O can be fitted using the following polynomial equation:43
| WSR = k0 + k1RH + k2RH2 + k3RH3 + k4RH4 | (2) |
It is further found that the WSR data at 288 and 278 K can also be fitted using eqn (2), and the polynomial coefficients obtained are summarized in Table 3 for both salts at three different temperatures.
| T (K) | k0 | k1 | k2 | k3 | k4 | Valid RH range |
|---|---|---|---|---|---|---|
| Ca(ClO4)2·4H2O | ||||||
| 298 | 8.982 | −68.613 | 280.385 | −431.422 | 241.907 | 0.2–0.9 |
| 288 | 10.027 | −76.214 | 309.064 | −474.868 | 265.622 | 0.2–0.9 |
| 278 | 12.644 | −102.880 | 406.286 | −619.776 | 341.669 | 0.2–0.9 |
![[thin space (1/6-em)]](https://www.rsc.org/images/entities/char_2009.gif) |
||||||
| Mg(ClO4)2·6H2O | ||||||
| 298 | 174.765 | −1103.441 | 2676.955 | −2855.798 | 1147.936 | 0.5–0.9 |
| 288 | 207.530 | −1309.148 | 3157.012 | −3349.155 | 1336.810 | 0.5–0.9 |
| 278 | 228.714 | −1455.690 | 3534.575 | −3775.969 | 1515.893 | 0.5–0.9 |
At 20% RH Ca(ClO4)2·4H2O was deliquesced to form a solution with WSR of ∼3.82, which should be slightly larger than that for saturated solution (a saturated solution should be formed at the RH equal to DRH, which was determined to be ∼16.5% at 298 K). Similarly, when RH increased from 40% to 50%, Mg(ClO4)2·6H2O underwent deliquescence and formed a solution with n(H2O)/n(ClO4−) of ∼7.26, which should also be slightly larger than that for saturated solution. The solubility was determined to be 188.6 g per 100 g H2O for anhydrous Ca(ClO4)2 and 99.6 g per 100 g H2O for anhydrous Mg(ClO4)2 at 298 K,40 corresponding to WSR of 3.52 for saturated Ca(ClO4)2 solution and 6.22 for saturated Mg(ClO4)2 solution. Therefore, our measured WSR values are consistent with those derived from solubility measurements. Zhang and Chan et al.27 utilized an electrodynamic balance coupled with Raman spectroscopy to determine water to solute molar ratios as a function of RH at room temperature. Comparison of our results at 298 K with those presented graphically by Zhang and Chan27 suggests a reasonably good agreement.
4 Conclusions and implications
The deliquescence behaviors of perchlorates under subsaturated conditions are suggested to be the reason why liquid water can exist in some hyperarid regions on the earth. In this study we have measured the DRH of Ca(ClO4)2·4H2O, Mg(ClO4)2·6H2O and KClO4 in the temperature range of 278–303 K. While the DRH of KClO4 is above 95%, Ca(ClO4)2·4H2O and Mg(ClO4)2·6H2O are found to deliquesce at much lower RH. More specifically, the DRH of Mg(ClO4)2·6H2O decreases from (42.8 ± 0.6)% at 278 K to (40.5 ± 0.5)% at 303 K, and it decreases from (18.5 ± 0.5)% at 278 K to (15.5 ± 0.5)% at 303 K for Ca(ClO4)2·4H2O, both exhibiting a slightly negative dependence on temperature. Therefore, our work confirms that liquid water can exist as perchlorate solutions at temperatures relevant for the earth even when RH is much lower than 100%.More importantly, we have quantitatively measured the amount of water associated with Ca(ClO4)2·4H2O and Mg(ClO4)2·6H2O as a function of RH at 278–298 K. It is found that when both salts are deliquesced, under the same condition more water (∼10% on average) is associated with Mg(ClO4)2·6H2O than Ca(ClO4)2·4H2O on the per mole ClO4− base. Our work would significantly improve our knowledge in hygroscopic properties of perchlorates, and therefore could help us better understand the hydrological cycles in some hyperarid environments on the earth, such as the Atacama Desert in Chile.
Most of the time the Mars is extremely cold with typical temperature at 200–220 K; however, the temperature around the Martian equator in the summer can reach >280 K,21 overlapping with the temperature range our current work covers. Therefore, our work may also be relevant for the possible existence of liquid water on the Mars. In addition, experiments at Martian relevant temperatures are difficult and thermodynamic models are widely used for prediction and interpretation;9,24,25 as a result, the comprehensive and systematical dataset obtained at 278–303 K for Mg(ClO4)2·6H2O, Ca(ClO4)2·4H2O and KClO4 in our work could be used to constrain and verify these thermodynamic models. We are also developing a new instrument which would be able to measure hygroscopicity of perchlorates at much lower temperatures.
Conflicts of interest
There are no conflicts to declare.Appendix
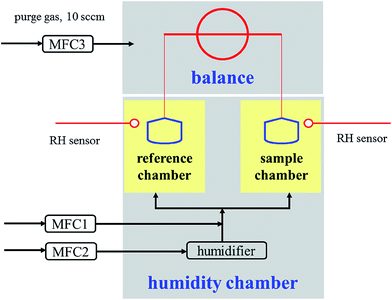 | ||
| Fig. 7 Schematic diagram of the vapor sorption analyzer used in this work. MFC1, MFC2 and MFC3 were mass flow controllers. | ||
Acknowledgements
This work is financially supported by Chinese National Science Foundation (grant No. 91644106 and 41675120), the Chinese Academy of Sciences international collaborative project (grant No. 132744KYSB20160036), the Science and Technology Development Fund of Macau (136/2016/A3), and State Key Laboratory of Organic Geochemistry (grant No. SKLOGA201603A). Mingjin Tang would like to thank the CAS Pioneer Hundred Talents program for providing a starting grant. This is contribution No. IS-2443 from GIGCAS.References
- R. Navarro-Gonzalez, F. A. Rainey, P. Molina, D. R. Bagaley, B. J. Hollen, J. de la Rosa, A. M. Small, R. C. Quinn, F. J. Grunthaner, L. Czaceres, B. Gomez-Silva and C. P. McKay, Science, 2003, 302, 1018–1021 CrossRef CAS PubMed.
- A. F. Davila, B. Gómez-Silva, A. de los Rios, C. Ascaso, H. Olivares, C. P. McKay and J. Wierzchos, J. Geophys. Res.: Biogeosci., 2008, 113, G01028, DOI:10.1029/2007JG000561.
- C. P. McKay, E. I. Friedmann, B. Gomez-Silva, L. Caceres-Villanueva, D. T. Andersen and R. Landheim, Astrobiology, 2003, 3, 393–406 CrossRef CAS PubMed.
- J. Levy, A. Fountain, W. B. Lyons and K. Welch, Antarct. Sci., 2015, 27, 163–171 CrossRef.
- R. V. Gough, V. F. Chevrier and M. A. Tolbert, Planet. Space Sci., 2016, 131, 79–87 CrossRef CAS.
- A. F. Davila, I. Hawes, C. Ascaso and J. Wierzchos, Environ. Microbiol. Rep., 2013, 5, 583–587 CrossRef CAS PubMed.
- S. T. Martin, Chem. Rev., 2000, 100, 3403–3453 CrossRef CAS PubMed.
- D. C. Catling, M. W. Claire, K. J. Zahnle, R. C. Quinn, B. C. Clark, M. H. Hecht and S. Kounaves, J. Geophys. Res.: Planets, 2010, 115, E00E11, DOI:10.1029/2009je003425.
- S. P. Kounaves, S. T. Stroble, R. M. Anderson, Q. Moore, D. C. Catling, S. Douglas, C. P. McKay, D. W. Ming, P. H. Smith, L. K. Tamppari and A. P. Zent, Environ. Sci. Technol., 2010, 44, 2360–2364 CrossRef CAS PubMed.
- B. Rao, T. A. Anderson, G. J. Orris, K. A. Rainwater, S. Rajagopalan, R. M. Sandvig, B. R. Scanlon, D. A. Stonestrom, M. A. Walvoord and W. A. Jackson, Environ. Sci. Technol., 2007, 41, 4522–4528 CrossRef CAS PubMed.
- D. R. Parker, Environ. Chem., 2009, 6, 10–27 CrossRef CAS.
- P. K. DasGupta, J. V. Dyke, A. B. Kirk and W. A. Jackson, Environ. Sci. Technol., 2006, 40, 6608–6614 CrossRef CAS PubMed.
- B. L. Carrier and S. P. Kounaves, Geophys. Res. Lett., 2015, 42, 3739–3745 CrossRef CAS.
- S. P. Kounaves, B. L. Carrier, G. D. O'Neil, S. T. Stroble and M. W. Claire, Icarus, 2014, 229, 206–213 CrossRef CAS.
- S. P. Kounaves, N. A. Chaniotakis, V. F. Chevrier, B. L. Carrier, K. E. Folds, V. M. Hansen, K. M. McElhoney, G. D. O'Neil and A. W. Weber, Icarus, 2014, 232, 226–231 CrossRef CAS.
- A. S. McEwen, L. Ojha, C. M. Dundas, S. S. Mattson, S. Byrne, J. J. Wray, S. C. Cull, S. L. Murchie, N. Thomas and V. C. Gulick, Science, 2011, 333, 740–743 CrossRef CAS PubMed.
- A. S. McEwen, C. M. Dundas, S. S. Mattson, A. D. Toigo, L. Ojha, J. J. Wray, M. Chojnacki, S. Byrne, S. L. Murchie and N. Thomas, Nat. Geosci., 2014, 7, 53–58 CrossRef CAS.
- L. Ojha, M. B. Wilhelm, S. L. Murchie, A. S. McEwen, J. J. Wray, J. Hanley, M. Masse and M. Chojnacki, Nat. Geosci., 2015, 8, 829–832 CrossRef CAS.
- L. A. Leshin, P. R. Mahaffy, C. R. Webster, M. Cabane, P. Coll, P. G. Conrad, P. D. Archer, S. K. Atreya, A. E. Brunner, A. Buch, J. L. Eigenbrode, G. J. Flesch, H. B. Franz, C. Freissinet, D. P. Glavin, A. C. McAdam, K. E. Miller, D. W. Ming, R. V. Morris, R. Navarro-Gonzalez, P. B. Niles, T. Owen, R. O. Pepin, S. Squyres, A. Steele, J. C. Stern, R. E. Summons, D. Y. Sumner, B. Sutter, C. Szopa, S. Teinturier, M. G. Trainer, J. J. Wray, J. P. Grotzinger and M. S. L. S. Team, Science, 2013, 341, 1238937, DOI:10.1126/science.1238937.
- D. W. Ming, P. D. Archer, D. P. Glavin, J. L. Eigenbrode, H. B. Franz, B. Sutter, A. E. Brunner, J. C. Stern, C. Freissinet, A. C. McAdam, P. R. Mahaffy, M. Cabane, P. Coll, J. L. Campbell, S. K. Atreya, P. B. Niles, J. F. Bell, D. L. Bish, W. B. Brinckerhoff, A. Buch, P. G. Conrad, D. J. Des Marais, B. L. Ehlmann, A. G. Fairen, K. Farley, G. J. Flesch, P. Francois, R. Gellert, J. A. Grant, J. P. Grotzinger, S. Gupta, K. E. Herkenhoff, J. A. Hurowitz, L. A. Leshin, K. W. Lewis, S. M. McLennan, K. E. Miller, J. Moersch, R. V. Morris, R. Navarro-Gonzalez, A. A. Pavlov, G. M. Perrett, I. Pradler, S. W. Squyres, R. E. Summons, A. Steele, E. M. Stolper, D. Y. Sumner, C. Szopa, S. Teinturier, M. G. Trainer, A. H. Treiman, D. T. Vaniman, A. R. Vasavada, C. R. Webster, J. J. Wray, R. A. Yingst and M. S. L. S. Team, Science, 2014, 343, 1245267, DOI:10.1126/science.1245267.
- F. J. Martin-Torres, M.-P. Zorzano, P. Valentin-Serrano, A.-M. Harri, M. Genzer, O. Kemppinen, E. G. Rivera-Valentin, I. Jun, J. Wray, M. Bo Madsen, W. Goetz, A. S. McEwen, C. Hardgrove, N. Renno, V. F. Chevrier, M. Mischna, R. Navarro-Gonzalez, J. Martinez-Frias, P. Conrad, T. McConnochie, C. Cockell, G. Berger, A. R. Vasavada, D. Sumner and D. Vaniman, Nat. Geosci., 2015, 8, 357–361 CrossRef CAS.
- D. L. Nuding, E. G. Rivera-Valentin, R. D. Davis, R. V. Gough, V. F. Chevrier and M. A. Tolbert, Icarus, 2014, 243, 420–428 CrossRef CAS.
- M. P. Zorzano, E. Mateo-Marti, O. Prieto-Ballesteros, S. Osuna and N. Renno, Geophys. Res. Lett., 2009, 36, L20201, DOI:10.1029/2009GL040315.
- V. F. Chevrier, J. Hanley and T. S. Altheide, Geophys. Res. Lett., 2009, 36, L10202, DOI:10.1029/2009GL037497.
- R. V. Gough, V. F. Chevrier, K. J. Baustian, M. E. Wise and M. A. Tolbert, Earth Planet. Sci. Lett., 2011, 312, 371–377 CrossRef CAS.
- G. Nikolakakos and J. A. Whiteway, Geophys. Res. Lett., 2015, 42, 7899–7906 CrossRef CAS.
- Y. H. Zhang and C. K. Chan, J. Phys. Chem. A, 2003, 107, 5956–5962 CrossRef CAS.
- E. Fischer, G. M. Martinez and N. O. Renno, Astrobiology, 2016, 16, 937–948 CrossRef CAS PubMed.
- R. V. Gough, V. F. Chevrier and M. A. Tolbert, Earth Planet. Sci. Lett., 2014, 393, 73–82 CrossRef CAS.
- D. L. Nuding, R. D. Davis, R. V. Gough and M. A. Tolbert, J. Geophys. Res.: Planets, 2015, 120, 588–598 CAS.
- W. J. Gu, Y. J. Li, J. X. Zhu, X. H. Jia, Q. H. Lin, G. H. Zhang, X. Ding, W. Song, X. H. Bi, X. M. Wang and M. J. Tang, Atmos. Meas. Tech., 2017 DOI:10.5194/amt-2017-5156.
- O. N. Pestova, L. A. Myund, M. K. Khripun and A. V. Prigaro, Russ. J. Appl. Chem., 2005, 78, 409–413 CrossRef CAS.
- T. A. Dobrynina, N. A. Akhapkina and V. Y. Rosolovskii, Russ. J. Inorg. Chem., 1984, 29, 1818–1822 CAS.
- K. Robertson and D. Bish, J. Geophys. Res.: Planets, 2011, 116, E07006, DOI:10.1029/2010JE003754.
- D. J. Devlin and P. J. Herley, Thermochim. Acta, 1986, 104, 159–178 CrossRef CAS.
- K. S. Pitzer, Activity Coefficients in Electrolyte Solutions, CRC Press, Boca Raton, Florida, USA, 1991 Search PubMed.
- A. S. Wexler and J. H. Seinfeld, Atmos. Environ., 1991, 25, 2731–2748 CrossRef.
- J. H. Seinfeld and S. N. Pandis, Atmospheric Chemistry and Physics: From Air Pollution to Climate Change, Wiley Interscience, New York, 2006 Search PubMed.
- G. Zeng, J. Kelley, J. D. Kish and Y. Liu, J. Phys. Chem. A, 2014, 118, 583–591 CrossRef CAS PubMed.
- H. H. Willard and G. F. Smith, J. Am. Chem. Soc., 1923, 45, 286–297 CrossRef CAS.
- J. D. Toner and D. C. Catling, Geochim. Cosmochim. Acta, 2016, 181, 164–174 CrossRef CAS.
- J. D. Toner, D. C. Catling and B. Light, Geochim. Cosmochim. Acta, 2015, 166, 327–343 CrossRef CAS.
- Y. Liu and A. Laskin, J. Phys. Chem. A, 2009, 113, 1531–1538 CrossRef CAS PubMed.
| This journal is © The Royal Society of Chemistry 2017 |

