 Open Access Article
Creative Commons Attribution 3.0 Unported Licence
A novel flexible sensor for respiratory monitoring based on in situ polymerization of polypyrrole and polyurethane coating
Yixia Zhaoa,
Yafang Liab,
Weimin Kanga,
Yin Heab,
Wei Liua,
Hao Liu*abc and
Bowen Cheng *a
*a
aSchool of Textiles, Tianjin Polytechnic University, Tianjin 300387, PR China. E-mail: liuhao_0760@163.com; bowen15@tjpu.edu.cn
bInstitute of Smart Wearable Electronic Textiles, Tianjin Polytechnic University, Tianjin 300387, China
cKey Laboratory of Advanced Textile Composite Materials, Ministry of Education of China, Tianjin 300387, China
First published on 25th October 2017
Abstract
Flexible conductive fabrics were made of knitted cotton fabric (KCF) based on in situ polymerization of polypyrrole and polyurethane coating. The properties of the conductive fabrics were investigated by a series of experiments such as SEM, FTIR, mechanics performance testing and washing fastness testing. The results showed that sensitivity, hysteresis, repeatability and washing fastness of knitted cotton fabrics with polypyrrole coating (KCF–P) greatly improved by surface polyurethane coating. Moreover, respiration monitoring data from volunteers also verified polyurethane coating to be thicker, with stronger output resistance variation. The knitted cotton fabrics with polypyrrole and polyurethane coating (KCF–PPU) have good application prospect in intelligent wearable fields.
Introduction
Flexible sensors are a key part of intelligent wearable devices and garments. Conducting polymers are widely used in sensors, electromagnetic shielding, energy technology, etc. due to their excellent physical and chemical properties.1–3 Since 1968, the amount of research on conductive polymers has increased.4–8 Polypyrrole and polyaniline can be combined with flexible materials such as yarns,9 textiles,10,11 sponges12,13 and flexible films14 to fabricate flexible sensors. Among the widely used flexible materials, fabrics and films are suitable substrate materials.15–18 As a kind of flexible sensor, conductive knitted fabrics have recently been studied.19,20 Polypyrrole has excellent sensitivity to strain and temperature and is a promising alternative conductive material. Liquid deposition in situ polymerization with FeCl3 as the oxidizing agent is often chosen to polymerize polypyrrole onto flexible substrates in studies.21–24 The polypyrrole tiny particles are deposited on the substrate surface. But the sensitivity and conductivity of polypyrrole are degenerated when exposed to air for a long time.25 Because of the low binding force of cotton fiber and polypyrrole particles, particles would dispatch from fabrics during the washing process, thus limiting the practical application of polypyrrole as a wearable sensor. Immobilizing polypyrrole particles onto the surface of flexible substrates is a way to solve this problem. Polyurethane films have excellent elasticity and are usually used as substrate materials of flexible sensors.26,27 However, the water repellency of polyurethane films make it difficult to absorb pyrrole on its surface by liquid deposition and would impede the polymerization of polypyrrole. Some research on conductive polyurethane/polypyrrole with porous polyurethane has been conducted.28 Vapor deposition has been used to polymerize pyrrole onto polyurethane film surface.13 Nevertheless, the approach is complex and expensive and has strict requirements. At present, the sensors for respiratory monitoring are fabricated of different materials.28–30 But the portability, price and comfort of wearing of flexible sensors are the important influencing factors. However, most of the wearable sensors showed poor performances in washability. In this paper, knitted cotton fabrics with polypyrrole coating (KCF–P) were prepared by liquid phase in situ polymerization. The knitted fabrics exhibited excellent comfort of wearing. The preparation cost of sensors reduced due to liquid phase in situ polymerization. KCF–P was coated with polyurethane to combine the advantages of polypyrrole and polyurethane. For example, the washability was improved by coating with polyurethane. Thus, the present study aims at manufacturing polyurethane coating on KCF–P and the evaluation of sensitivity of the obtained conductive flexible fabrics.Materials and methods
Materials
Rib knitted cotton fabrics fabricated by circular knitting machine were utilized as substrate. Pyrrole (98%) and FeCl3·6H2O (oxidant) were purchased from Shanghai Kefeng Company, China, and Tianjin Guangfu Company, China, respectively, without further purification. The polyurethane seal coat was purchased from CRC Company, U.S.Fabrication method of conductive fabrics
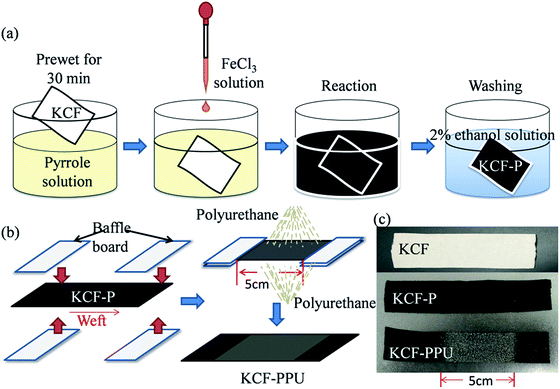
![[thin space (1/6-em)]](https://www.rsc.org/images/entities/char_2009.gif) :
:![[thin space (1/6-em)]](https://www.rsc.org/images/entities/char_2009.gif) 40. FeCl3 solution was added to the beaker (the molar ratio of FeCl3/pyrrole was 2
40. FeCl3 solution was added to the beaker (the molar ratio of FeCl3/pyrrole was 2![[thin space (1/6-em)]](https://www.rsc.org/images/entities/char_2009.gif) :
:![[thin space (1/6-em)]](https://www.rsc.org/images/entities/char_2009.gif) 1) with knitted cotton fabrics and the mixed solution was stirred for 2 h with a magnetic stirrer. Subsequently, the knitted cotton fabrics were taken out and washed by 2 wt% ethanol solution. The KCF–P samples were fabricated with different conditions (concentration of pyrrole: 0.4 M, reaction time: 2 h, reaction temperature: from 10 °C to 70 °C, interval of 10 °C; the concentration of pyrrole: 0.4 M, reaction temperature: room temperature, reaction time: from 5 min to 4 h) for investigating the effect of reaction temperature on surface resistivity and that of reaction time on surface resistivity.
1) with knitted cotton fabrics and the mixed solution was stirred for 2 h with a magnetic stirrer. Subsequently, the knitted cotton fabrics were taken out and washed by 2 wt% ethanol solution. The KCF–P samples were fabricated with different conditions (concentration of pyrrole: 0.4 M, reaction time: 2 h, reaction temperature: from 10 °C to 70 °C, interval of 10 °C; the concentration of pyrrole: 0.4 M, reaction temperature: room temperature, reaction time: from 5 min to 4 h) for investigating the effect of reaction temperature on surface resistivity and that of reaction time on surface resistivity.
| Name of sample | GSM of PU (g m−2) |
|---|---|
| KCF–P | 0 |
| KCF–PPU1 | 46.47 |
| KCF–PPU2 | 73.51 |
| KCF–PPU3 | 137.05 |
Experimental
SEM and FTIR characterization
The morphology images of samples were obtained using a scanning electron microscope (SEM), (S4800, Hitachi, Japan). All samples were first coated with a thin layer of gold by sputtering and then exposed in SEM for taking images. Fourier transform infrared (FTIR) (Bruker tensor 27, Bruker Corporation, Germany) spectra of samples were measured to characterize surface composition.Washing fastness testing
The washing fastness testing of all samples was performed according to the American Association of Textile Chemists and Colorists (AATCC) test method 150-2003. The washing temperature was 40 °C and the samples were dried by screen drying method. The resistivity of the samples was measured after each washing.Electrical and mechanics property testing
The surface resistivity of all samples was measured according to the American Association of Textile Chemists and Colorists (AATCC) test method 76-2000. The calculation equation of surface resistivity of the samples is as follows:
 | (1) |
The surface resistivity of each sample was measured five times. Their average and standard deviation were calculated.
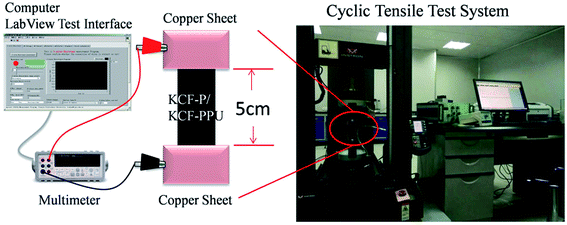
Fig. 2 shows the apparatus for testing the electrical and mechanical properties of samples. A digital multimeter (Agilent U3402A, Agilent Technologies, U.S.) and its measuring software developed on LabVIEW 2011 tool (NI, U.S.) by our group were utilized for measuring and recording the resistance curves of samples. A universal strength testing machine (Instron 5569, U.S.) was utilized for testing the stress–strain curves of all samples.
Two copper clamps were employed for holding the two ends of the samples. The size of the specimen was 25 mm × 100 mm and the extension area was 25 mm × 50 mm. The elongation percentages of the samples were set at 10%, 20%, 30%, and 40%. The stretching direction was along the weftwise of knitted cotton fabrics. The 5 prestretching cycles on samples were performed before stretching.
Surface resistance variation of KCF–P and KCF–PP samples was tested and recorded by a multimeter and a computer. The frequency of data collection was 5 Hz. The stress–strain curve and resistance–time curve was shown on real-time display by Instron and LabVIEW program.
Respiration monitoring of human body
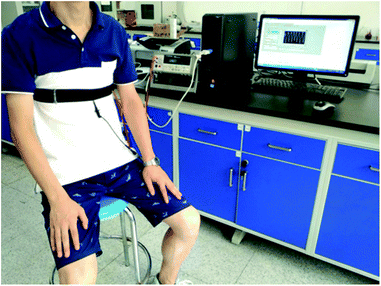
The respiration monitoring system was composed of three parts: a respiration monitoring belt (elastic belt with KCF–P or KCF–PPU), a resistance measurement device and a computer for recording the data. Respiration information of two healthy volunteers (their ages were 28 and 29 years, respectively) was measured by the respiration monitoring system, as shown in Fig. 3. The respiration monitoring belt was worn on the chest and waist. The volunteers were required to relax themselves and remain in a quiet and static state for 10 min before performing respiration monitoring. Subsequently, the respiration information of volunteers was recorded at 5 Hz for 1 min. Informed consent was obtained for any experimentation with human subjects.Results and discussion
The SEM images of KCF–P samples prepared by pyrrole solution with different concentrations are shown in Fig. 4. One can observe that the surface of cotton fibers in Fig. 4(a) is smooth and the polypyrrole particles on the surface of cotton fibers increase with pyrrole solution concentration enrichment and is shown in Fig. 4(b–f). Obviously, the high concentration of pyrrole in mixed solution favors the polymerization reaction according to SEM images. The amount of polypyrrole particles on cotton fibers is also positively correlated to concentration of pyrrole. More polypyrrole particles are polymerized by more reacting pyrrole in the fabrics due to higher concentration of pyrrole solution.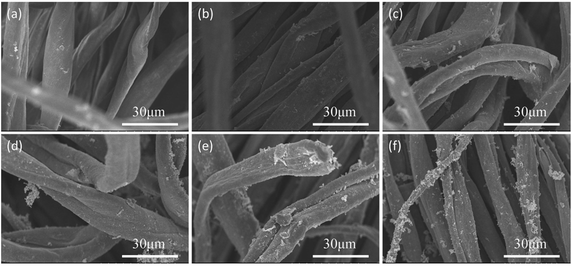 | ||
| Fig. 4 SEM images of KCF–P prepared using (a) 0 M, (b) 0.1 M, (c) 0.2 M, (d) 0.3 M, (e) 0.4 M, and (f) 0.5 M pyrrole solution. | ||
Fig. 5 shows SEM images of fibers in KCF, KCF–P and KCF–PPU. Some small grooves can be observed on the cotton fiber in KCF in Fig. 5(a), and on observing the magnified SEM image, the walls of the small grooves seem smooth. Some irregular large polypyrrole particles are on the surface of cotton fibers in KCF–P, as shown in Fig. 5(b), and some fine and evenly distributed polypyrrole particles on the surface of cotton fibers in KCF–P can be observed in the magnified SEM image of Fig. 5(b). Fig. 5(c) shows the irregular large polypyrrole particles on cotton fibers are covered by polyurethane film; the polypyrrole particles stoutly adhere to the surface of the cotton fibers because they are enclosed of polyurethane film, as shown in magnified SEM image of Fig. 5(c).
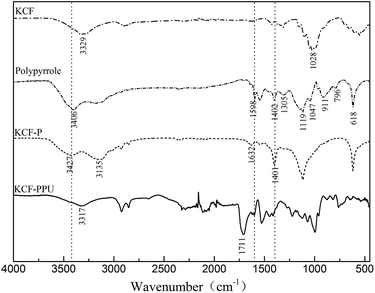
Fig. 6 shows the FTIR spectra of KCF, polypyrrole, KCF–P and KCF–PPU. The peaks at 1028 cm−1 and 3329 cm−1 are the characteristic absorption peaks of C–H stretching band and the O–H stretching band, respectively, which are the characteristic peaks of KCF on FTIR.
The characteristic peaks of polypyrrole are shown in the FTIR spectra. The characteristic peaks at 618 cm−1, 796 cm−1 and 911 cm−1 are attributed to C–H wagging. The ![[double bond, length as m-dash]](https://www.rsc.org/images/entities/char_e001.gif) C–H plane deformation vibration is shown by peaks at 1047 cm−1. The peak at 1119 cm−1 is attributed to C–H in and out of plane deformations. The N–C stretching band and
C–H plane deformation vibration is shown by peaks at 1047 cm−1. The peak at 1119 cm−1 is attributed to C–H in and out of plane deformations. The N–C stretching band and ![[double bond, length as m-dash]](https://www.rsc.org/images/entities/char_e001.gif) C–H in plane vibration are observed at 1402 cm−1 and 1305 cm−1, respectively. The peak at 1598 cm−1 is attributed to N–H bending vibration bands. The N–H stretching band is shown at the peak of 3406 cm−1.
C–H in plane vibration are observed at 1402 cm−1 and 1305 cm−1, respectively. The peak at 1598 cm−1 is attributed to N–H bending vibration bands. The N–H stretching band is shown at the peak of 3406 cm−1.
The characteristic peaks of polypyrrole and cotton are embodied in the FTIR spectra of KCF–P. The peak at 1401 cm−1 is attributed to N–C stretching band, and the peaks at 1632 cm−1 and 3427 cm−1 are attributed to N–H bending vibration band and N–H stretching band, respectively. These peaks do not appear in the FTIR spectra of cotton. The peak at 3135 cm−1 is attributed to O–H stretching band. Therefore, FTIR results confirm the formation of cotton–polypyrrole hybrid.
The characteristic peak at 1711 cm−1 is attributed to C![[double bond, length as m-dash]](https://www.rsc.org/images/entities/char_e001.gif) O stretching band. It is observed in the FTIR spectra of KCF–PPU but absent in other corresponding FTIR spectra. The polyurethane coated on KCF–P is proved by the results of FTIR spectra.
O stretching band. It is observed in the FTIR spectra of KCF–PPU but absent in other corresponding FTIR spectra. The polyurethane coated on KCF–P is proved by the results of FTIR spectra.
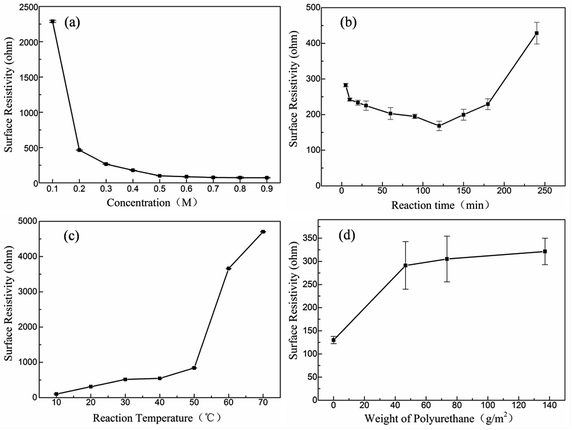
Fig. 7 shows the curve of surface resistivity vs. concentration of pyrrole, reaction time, reaction temperature of KCF–P samples, and gram per square meter (GSM) of polyurethane coating of KCF–PPU samples. One can observe from Fig. 7(a) that the surface resistivity of KCF–P decreases sharply from 2288.9 ohm to 464.2 ohm when the concentration of pyrrole increases from 0.1 M to 0.2 M. The surface resistivity of KCF–P decreases approximately linearly when the concentration of pyrrole increases from 0.2 M to 0.5 M, with an interval of 0.1 M. The surface resistivity of KCF–P samples prepared using 0.5 M pyrrole solution is 99.1 ohm. The result is consistent with the conclusions of Fig. 4(a). Higher pyrrole solution concentration enables the more reactive pyrrole to be polymerized into polypyrrole on the fabrics. According to the result, the resistivity of samples decreases slightly when the concentration is higher than 0.5 M. The surface resistivity of KCF–P samples prepared using 0.9 M pyrrole solution is 72.3 ohm. Pyrrole is a kind of volatile oily liquid and almost insoluble in water. The water solubility is 60 g L−1 (20 °C), and the maximum solution concentration of pyrrole is close to 0.89 mol L−1. In practice, it is difficult to dissolve when the concentration of pyrrole is too high. In addition, the resistance is not as low as possible as the sensor. Hence, the concentration of 0.4 M is selected in the process of sample preparation, which not only reduces the difficulty of solution preparation, but also reduces the cost.
Fig. 7(b) shows the curve of surface resistivity vs. reaction time of KCF–P samples. The surface resistivity of KCF–P decreases initially and increases afterwards with increasing reaction time. The reason is the incomplete oxidation in the initial stage. However, with further increase in reaction time, pyrrole is consumed completely; magnetic stirring leading to polypyrrole coating dispersing into the mix solution is the reason of surface resistivity increasing in the latter half of the curve.
Fig. 7(c) shows the curve of surface resistivity vs. reaction temperature of KCF–P samples. The surface resistivity of KCF–P increases slowly initially and sharply afterwards with increasing reaction temperature. When reaction temperature changes from 50 °C to 60 °C, the surface resistivity of KCF–P changes from 841.8 ohm to 3659.6 ohm, increasing by 334.8%. The lower resistivity can be obtained at lower reaction temperature. Reaction rate of polypyrrole's polymerization was reduced by the decrease of the temperature. Thus, the molecular ordered arrangement would be improved,31 resulting in good conductive performance as well as lower surface resistivity.
Fig. 7(d) shows the curve of surface resistivity vs. GSM of polyurethane coating of KCF–PPU samples. When the polyurethane solvent is sprayed one time on the surface of KCF–P, the surface resistivity of KCF–PPU1 increases sharply compared to that of KCF–P, and the increasing spraying amount leads to small increment in surface resistivity of KCF–PPU2 and KCF–PPU3. One can observe that the polypyrrole particles or pieces array closely on the surface of fibers in KCF. The conductive paths of KCF was composed of connective polypyrrole particles on cotton fibers. When polyurethane solvent is sprayed on the surface of the polypyrrole coating, the polyurethane solvent encloses the polypyrrole particles or pieces on the surface of the polypyrrole coating and a part of the conductive paths become the insulating path due to insulating polypyrrole particles or pieces in their middle segments. When the amount of polyurethane solvent reaches a certain threshold value, the polyurethane solvent cannot permeate into gaps between polypyrrole particles or pieces. Then surface resistivity of KCF–PPU also reaches a stable value. The extra polyurethane solvent contributes to the thickness increment in polyurethane coating.
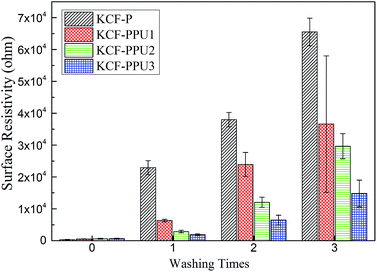
Fig. 8 shows the surface resistivity vs. washing times of KCF–P, KCF–PPU1, KCF–PPU2 and KCF–PPU3. The surface resistivity of all samples increases with increasing washing amount. However, the increment in surface resistivity of samples decreases with increasing GSM of polyurethane. The surface resistivity of KCF–P and KCF–PPU3 increases by 197.39 and 21.54, respectively times after washing 3 times. The reason is that the polyurethane film can improve the adhesive force of polypyrrole particles or pieces on cotton fibers.
Fig. 9 shows the curves of surface resistivity vs. time and load vs. time of KCF–PPU3 under different elongations. It is shown in the result that the variation range of resistivity increases with increase in elongation. The average variations of resistivity with elongation of 10%, 20%, 30% and 40% are 93.81 ohm, 161.11 ohm, 166.76 ohm, and 170.5 ohm, while the tensile loads were 2.56 N, 7.28 N, 10.7 N, and 17.69 N with different elongation, respectively. The result shows tensile load and resistivity variation increase with elongation increment. The curve for resistivity is similar. But the stability of KCF–PPU3 decreases with elongation of 40%. The recovery resistivity become higher with tensile times.
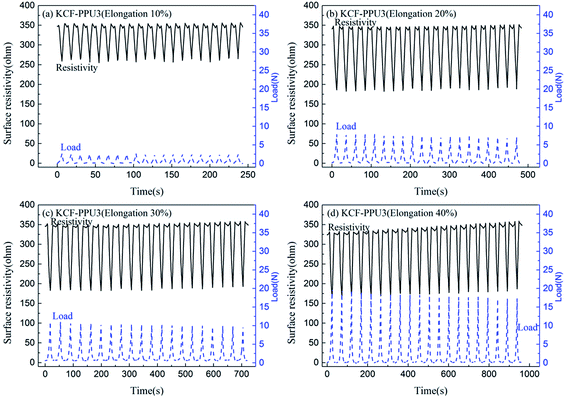 | ||
| Fig. 9 Curves of surface resistivity vs. time and load vs. time of KCF–PPU3 under different elongation of (a) 10%, (b) 20%, (c) 30%, and (d) 40%. | ||
Fig. 10 shows curves of surface resistivity vs. time and load vs. time of KCF–P, KCF–PPU1, KCF–PPU2 and KCF–PPU3 by performing cycle loading testing from 0% to 30% elongation. One can observe regular variation in load and surface resistivity of samples, and the amplitudes of load and surface resistivity of samples increase with increasing GSM of polyurethane coating. The average variations in surface resistivity of KCF–P, KCF–PPU1, KCF–PPU2 and KCF–PPU3 are 41.99 ohm, 105.92 ohm, 125.15 ohm and 166.76 ohm, respectively. The variations in load of KCF–P, KCF–PPU1, KCF–PPU2 and KCF–PPU3 are 1.4 N, 3.7 N, 7.6 N, and 10.7 N, respectively. The maximum input signal of percentage elongation is a constant value of 30% for 4 kinds of samples. Obviously, the larger the output signal of surface resistivity variation, the better the sensitivity of samples. The largest surface resistivity variation and load variation means that KCF–PPU3 has the maximum sensitivity and measuring range. The result shows that the increase in polyurethane coating results in enlargement of KCF–P resistivity.32
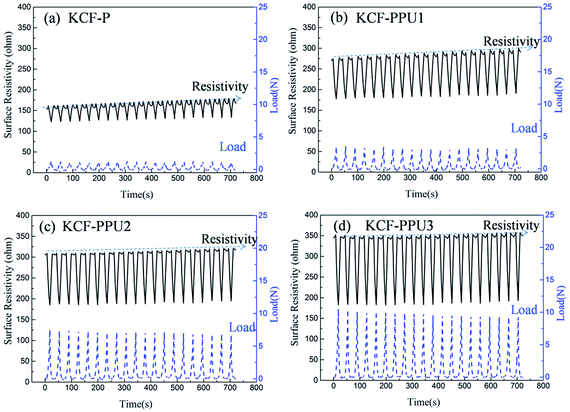 | ||
| Fig. 10 Curves of surface resistivity vs. time and load vs. time of (a) KCF–P, (b) KCF–PPU1, (c) KCF–PPU2, and (d) KCF–PPU3. | ||
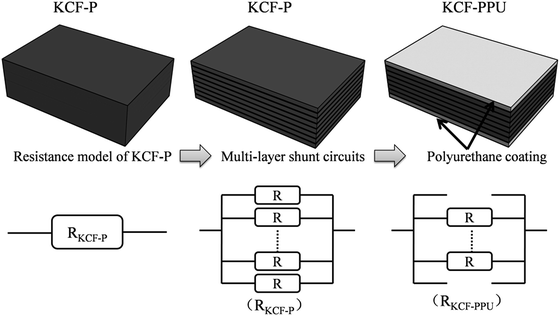
As it is shown in Fig. 11, we suppose KCF–P as a multi-layer shunt circuits, and the resistance of each circuit is the same. According to the ohm equation, the function of resistance is shown as follows.
 | (2) |
 | (3) |
 | (4) |
 | (5) |
 | (6) |
 | (7) |
| VKCF–PPU ≥ VKCF–P | (8) |
So, the higher resistivity variation is caused by more polyurethane sprayed onto KCF–P.
Fig. 12 shows the curves of surface resistivity vs. elongation percentage and load vs. elongation percentage for (a) KCF–P, (b) KCF–PPU1, (c) KCF–PPU2, and (d) KCF–PPU3. One can observe that amplitudes of load and surface resistivity increases with increasing GSM of polyurethane coating. When GSM of polyurethane coating is 137.05 g m−2, the surface resistivity and load average variation of KCF–PPU3 is 166.76 ohm and 10.7 N, respectively. The deviations in surface resistivity and load in multiple cycles also decrease with increasing GSM of polyurethane coating. The surface resistivity and load have slight variation with 11% elongation. The surface resistivity of samples decreases and load of samples increases with on further increasing elongation percentage. The reason causing this appearance is the structural characteristics of the knitted fabric. The fabric cannot recover to its initial state after the pre-stretching. The samples shows bended shape on the test fixture. The initial stage of elongation of KCF–P changes the yarns in the fabric from flexuosity to straight. In this stage, resistivity of KCF is varied slightly. Therefore, the fabric is stretched into a straight state in the next section. The loose fibers and yarns each other gradually came in contact with each other. The contact area of yarns and fibers is increased, which decreases resistivity.
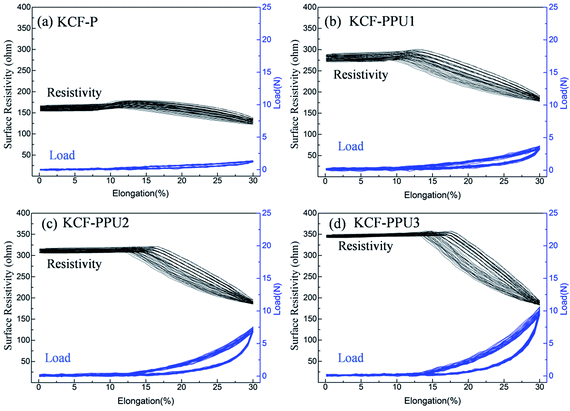 | ||
| Fig. 12 Curves of surface resistivity vs. elongation percentage and load vs. elongation percentage for (a) KCF–P, (b) KCF–PPU1, (c) KCF–PPU2, and (d) KCF–PPU3. | ||
The calculation functions of the sensor's sensitivity, repeatability and hysteresis are shown as follows.
 | (9) |
 | (10) |
 | (11) |
Table 2 shows sensing properties of KCF–P, KCF–PPU1, KCF–PPU2 and KCF–PPU3 calculated by using the functions (9)–(11). The sensitivity of samples increases with increasing GSM of polyurethane coating. The sensitivity of KCF–PPU3 improves by 297% compared with that of KCF–P. However, the repeatability and hysteresis of samples decrease with increasing GSM of polyurethane coating. The repeatability and hysteresis of KCF–PPU3 has 32.47% and 6.74% improvement, respectively, compared with those of KCF–P.
| KCF–P | KCF–PPU1 | KCF–PPU2 | KCF–PPU3 | |
|---|---|---|---|---|
| Sensitivity (ohm/15 mm) | 41.99 | 105.92 | 125.15 | 166.76 |
| Repeatability (%) | 54.50 | 32.29 | 26.01 | 22.03 |
| Hysteresis (%) | 25.36 | 16.57 | 17.22 | 18.62 |
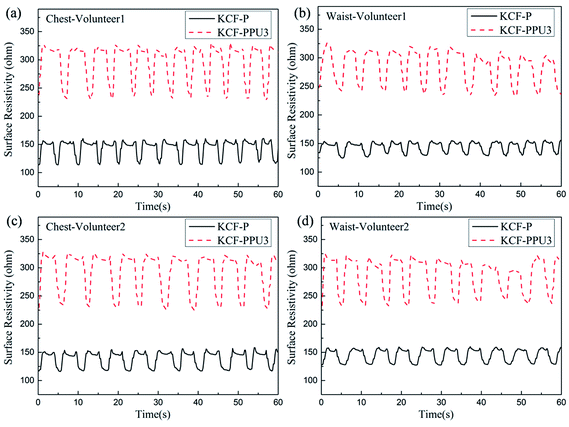
Fig. 13 shows the curves of surface resistivity vs. time of KCF–P and KCF–PPU3 for the performed respiration monitoring on two volunteers. The variation in surface resistivity of KCF–P and KCF–PPU3 is consistent with the respiration frequency of the volunteers. The measured data are analyzed by Matlab 7.0.1 software. The amplitudes of surface resistivity obtained on the chest of volunteer 1 using KCF–P and KCF–PPU3 are approximately 46.9 ohm and 103.3 ohm, respectively. The amplitudes of surface resistivity obtained on the waist of volunteer 1 using KCF–P and KCF–PPU3 are approximately 31.5 ohm and 93.0 ohm respectively. Table 3 shows that the respiration frequency range of the two volunteers on the chest and waist is 0.2–0.23 Hz and 0.18–0.19 Hz, respectively. The data in Table 2 show that the discrepancy in respiration frequency of the two volunteers is approximately 0.02 Hz. The experimental results show that KCF–PPU can be utilized as a flexible sensor for monitoring respiration.
| Volunteer no. | 1 | 2 | ||
|---|---|---|---|---|
| Position | Chest (Hz) | Waist (Hz) | Chest (Hz) | Waist (Hz) |
| KCF–P | 0.22 | 0.23 | 0.19 | 0.19 |
| KCF–PPU3 | 0.21 | 0.20 | 0.18 | 0.19 |
Conclusion
In this paper, KCF–P and KCF–PPU were developed for monitoring respiration. SEM images verified that the polypyrrole pieces and particles adhered on the surface of cotton fibers in KCF by in situ polymerization. The surface resistivity of KCF–P decreased with increasing concentration of pyrrole, and decreased initially and increased afterwards with increasing reaction time, and increased with increasing reaction temperature and increasing GSM of polyurethane coating. The surface resistivity of KCF–P and KCF–PPU3 increased by 197.39 and 21.54 times after 3 times of washing. The sensitivity of samples increased with increasing GSM of polyurethane coating. The sensitivity of KCF–PPU3 improved by 297% compared with that of KCF–P. The repeatability and hysteresis of KCF–PPU3 exhibited a 32.47% and 6.74% improvement, respectively, compared with those of KCF–P. The respiration monitoring belt using KCF–PPU and KCF–P as sensors could accurately measure the respiration frequency of two volunteers.Conflicts of interest
There are no conflicts to declare.Acknowledgements
The authors would like to thank the National Natural Science Foundation of China (Grant No. 51473122) and Postdoctoral Science Foundation of China (Grant No. 2016M591390) for support of the work reported in this article.References
- J. Joo and A. J. Epstein, Appl. Phys. Lett., 1994, 65, 2278–2280 CrossRef CAS.
- S. Dogan, U. Akbulut, T. Yalcin, S. Suzer and L. Toppare, Synth. Met., 1993, 60, 27–30 CrossRef CAS.
- P. Petersen, R. Helmer, M. Pate, J. Eichhoff, P. Petersen, R. Helmer, M. Pate and J. Eichhoff, Text. Res. J., 2011, 81, 1395–1404 CrossRef CAS.
- R. Qian and J. Qiu, Polym. J., 1987, 18, 13–18 CAS.
- G. P. Gardini, Adv. Heterocycl. Chem., 1973, 15, 67–98 CrossRef CAS.
- R. V. Gregory, W. C. Kimbrell and H. H. Kuhn, Synth. Met., 1989, 28, 823–835 CrossRef.
- C. Tonin, A. Varesano, M. Canetti, W. Porzio and M. Catellani, Synth. Met., 2006, 156, 379–386 CrossRef.
- S. Chen and I. Zhitomirsky, Mater. Lett., 2014, 125, 92–95 CrossRef CAS.
- H. Liu, L. L. Zhu, Y. He and B. W. Cheng, Mater. Des., 2017, 113, 254–263 CrossRef CAS.
- Y. Li, X. Y. Cheng, M. Y. Leung, J. Tsang, X. M. Tao and M. C. W. Yuen, Synth. Met., 2005, 155, 89–94 CrossRef CAS.
- S. Cetiner, Text. Res. J., 2014, 84, 1463–1475 CrossRef.
- T. Dai and Y. Lu, J. Mater. Chem., 2007, 17, 4797–4802 RSC.
- Y. Wang, G. A. Sotzing and R. A. Weiss, Chem. Mater., 2008, 20, 2574–2582 CrossRef CAS.
- A. Davies, P. Audette, B. Farrow, F. Hassan, Z. Chen, J. Y. Choi and A. Yu, J. Phys. Chem. C, 2011, 115, 17612–17620 CAS.
- R. Neelakandan and M. Madhusoothanan, J. Eng. Fibers Fabr., 2009, 3, 25–29 Search PubMed.
- A. Boschi, C. Arosio, I. Cucchi, F. Bertini, M. Catellani and G. Freddi, Fibers & Polymers, 2008, 9, 698–707 CrossRef CAS.
- N. V. Bhat, D. T. Seshadri, M. M. Nate and A. V. Gore, J. Appl. Polym. Sci., 2006, 102, 4690–4695 CrossRef CAS.
- G. Han and G. Shi, Sens. Actuators, B, 2006, 113, 259–264 CrossRef CAS.
- J. Xie and H. Long, J. Eng. Fibers Fabr., 2015, 10, 166–178 Search PubMed.
- J. Hong, Z. Pan, Z. Wang, M. Yao, J. Chen and Y. Zhang, Sens. Actuators, A, 2016, 238, 307–316 CrossRef CAS.
- A. Kaynak and R. Beltran, Polym. Int., 2003, 52, 1021–1026 CrossRef CAS.
- M. S. Kim, H. K. Kim, S. W. Byun, S. H. Jeong, Y. K. Hong, J. S. Joo, K. T. Song, J. K. Kim, C. J. Lee and J. Y. Lee, Synth. Met., 2002, 126, 233–239 CrossRef CAS.
- D. Kincal, A. Kumar, A. D. Child and J. R. Reynolds, Synth. Met., 1998, 92, 53–56 CrossRef CAS.
- S. Maity and A. Chatterjee, J. Compos., 2015, 2015, 6 Search PubMed.
- D. D. Rossi, A. D. Santa and A. Mazzoldi, Mater. Sci. Eng., C, 1999, 7, 31–35 CrossRef.
- M. Yanilmaz, F. Kalaoglu, H. Karakas and A. S. Sarac, J. Appl. Polym. Sci., 2012, 125, 4100–4108 CrossRef CAS.
- N. G. Sahoo, Y. C. Jung, N. S. Goo and J. W. Cho, Macromol. Mater. Eng., 2010, 290, 1049–1055 CrossRef.
- M. Li, H. Li, W. Zhong, Q. Zhao and D. Wang, ACS Appl. Mater. Interfaces, 2013, 6, 1313 Search PubMed.
- W. Zheng, X. Tao, B. Zhu, G. Wang and C. Hui, Text. Res. J., 2014, 84, 1791–1802 CrossRef CAS.
- S. Kano, K. Kim and M. Fujii, ACS Sens., 2017, 2, 828–833 CrossRef CAS PubMed.
- B. Sun, J. Electrochem. Soc., 1989, 136, 698–701 CrossRef CAS.
- M. Amjadi, K. U. Kyung, I. Park and M. Sitti, Adv. Funct. Mater., 2016, 26, 1678–1698 CrossRef CAS.
| This journal is © The Royal Society of Chemistry 2017 |

