DOI:
10.1039/C7RA08292D
(Paper)
RSC Adv., 2017,
7, 47781-47788
A highly sensitive morin sensor based on PEDT–Au/rGO nanocomposites modified glassy carbon electrode†
Received
27th July 2017
, Accepted 5th October 2017
First published on 11th October 2017
Abstract
In this work, we fabricated a sensitive electrochemical sensor based on a PEDT–Au/reduced graphene oxide nanocomposites (PEDT–Au/rGO) modified glassy carbon electrode (PEDT–Au/rGO/GCE) for electrochemical determination of morin. A facile, effective and high-efficiency one-pot method was employed to synthesize the PEDT–Au/rGO nanocomposites. The morphology and structure of as-prepared PEDT–Au/rGO nanocomposites were characterized by using a scanning electron microscope (SEM), transmission electron microscope (TEM) and X-ray spectroscopy (EDS), and its electrochemical characteristics were studied by EIS, CV and SWV. The PEDT–Au/rGO nanocomposites modified electrode exhibited excellent catalytic activities for morin oxidation, which was attributed to the synergistic catalytic effect that occurred at the interface of PEDT–Au and rGO layers. The effects of square wave voltammetry (SWV) parameters, accumulation time, accumulation potential and pH of the supporting electrolyte for morin were optimized. At the optimal experimental conditions, the PEDT–Au/rGO/GCE presented a high sensitivity of 0.0083 μmol dm−3 and a wide linear range from 1 to 150 μmol dm−3 toward morin oxidation with satisfactory selectivity and stability.
1. Introduction
Morin hydrate, 2′,3,4′,5,7-pentahydroxyflavone, as one of the natural flavonoids is commonly contained in plants, fruits and vegetables.1 It has been reported that morin plays an important role in protecting human erythrocyte,2 anti-inflammatory,3,4 anti-virus,5,6 anti-atherosclerosis,2,4 anti-stress function antioxidant properties as well as antioxidant capacity.7–10 Besides, the content of morin in fruit juices has been found to be 3–13 mg dm−3.1 Morin at 200 mg kg−1 showed the protection from nephrotoxicity caused by mercuric chloride.3 Since morin possesses various positive effects, the determination of morin has attracted enormous attention in recent years. Several techniques such as high performance liquid chromatography (HPLC),11–13 nuclear magnetic resonance spectrometry (NMR),14 fluorescence spectrophotometry,11 ultraviolet spectrophotometry,15 and electrochemical measurements,5,8,16 offer available approaches for determination of morin. However, these reported chromatographic and spectroscopic analyses are usually high cost of equipment, time-consuming of operation and require complicated working conditions. By contrast, electrochemical methods exhibit distinguished advantages including low experimental cost, fast respond time and simple equipment.1,6,17 Therefore, there was an increasing interest for morin determination using electrochemical methods based on different modified electrodes, such as graphene oxide/silver nanoparticles modified GCE,1 cetylpyridium bromide/single-walled carbon nanotubes modified GCE,16 renewable pencil electrode,18 hanging mercury dropping electrode,19 and ruthenium nanoparticle anchored calix[4]amidocrown-5 functionalized reduced graphene oxide modified GCE (RuNPs/C4A5/rGO/GCE).20
Graphene-based composites have been considered as promising and potential candidates for the electrochemical applications owing to its advantages including high specific surface area, superior thermal, excellent biocompatibility and electrical conductivity.21–25 It was reported that graphene composited with polymers,26–28 noble metal,21,29 and metal oxide nanoparticles exhibited much more superior comprehensive properties and broader application prospects compared to graphene.30–32 Moreover, PEDT was known as an admirable conductive polymer with widely applications in many fields, such as sensors, capacitors, solar battery and electrochromic devices, because of its superior electrical conductivity and high electrochemical stability.33–39 According to the oxidizing properties of EDT monomers, PEDT–Au composites can be chemically synthesized. The prepared PEDT–Au composites achieved remarkable electrochemical performances,37 since the composites possessed both the prominent electron transfer property of PEDT and distinguished conductivity of Au nanoparticles.
In this work, a morin electrochemical sensor based on PEDT–Au/rGO nanocomposites modified bare GCE was developed successfully. Compared to the morin sensors reported in previous literature, the prepared morin electrochemical sensor is probably more attracted and prospective for the following reasons. First, the electrode modified materials (PEDT–Au/rGO) were facilely prepared via the one-pot method, which possessed the advantages of simplicity, high efficiency and cost effectiveness. For another, as the sensor materials, the graphene-based ternary composites (PEDT–Au/rGO) commendably combined the advantages of PEDT, Au nanoparticles and rGO, therefore, the obtained sensor exhibited excellent electrocatalytic activity toward morin oxidation. Finally, the experimental conditions (SWV parameters, accumulation time and accumulation potential, and solution pH) for the analytical performance of the morin sensor were optimized, thus, the sensor showed good stability and good performance of sensitivity. Moreover, the proposed electrochemical sensor shows a low detection limit and a wide detection linear range, and is also available for the morin determination in real practice.
2. Experimental
2.1 Reagents and materials
Morin (90% purity) was purchased from J&K Chemicals (Beijing, China). The stock solution of 2.0 mmol dm−3 morin was prepared by dissolving in 5.0 mL of ethanol. The working solution was prepared by diluting the stock solution with supporting electrolyte (Britton–Robinson (BR) buffer solution). 3,4-Ethylenedioxythiophene (EDT) and chloroauric acid (HAuCl4·3H2O) were purchased from Sigma-Aldrich (USA). Boric acid, phosphoric acid, acetic acid, sodium hydroxide and sodium borohydride were received from DaMao Chemical Reagent Company (Tianjin, China). Human blood serum samples were purchased from Huayueyang Biotechnology Co. Ltd (Beijing, China). All other reagents were of A. R. Grade and used as received without further purification. A BR buffer solution was prepared by mixing boric acid, phosphoric acid and acetic acid all at a concentration of 0.04 mol dm−3, and then the required pH value ranging from 3.0 to 9.0 was adjusted with 0.2 mol dm−3 of sodium hydroxide solution. The HAuCl4 solution (1.0 mM) was prepared by dissolving in doubly distilled water quickly and kept at 277 K. All aqueous solutions in the experiment were prepared using doubly distilled water.
2.2 Synthesis of PEDT–Au/rGO nanocomposites
The synthesis of PEDT–Au/rGO nanocomposites was carried out on the basis of the Soomro's group and Xu's group with improvements.37,40 Firstly, graphene oxide (GO) dispersion (5 mg mL−1) was prepared based on the modified Hummer's method.41 10 mL of EDT ethanol solution (5.0 mM) was mixed with 50 mL of HAuCl4 solution (1.0 mM) under magnetic stirring at room temperature for 8 h to obtain PEDT–Au composites. Then, the GO dispersion was slowly dropped into the mixture solution. The mixture was sonicated for 2 h to obtain homogeneously dispersed suspension, and then 5 mL NaBH4 solution (0.16 M) was added to the suspension drop by drop. The reaction system was kept rapidly magnetic stirring for 6 h, and then centrifuged at 8000 rpm for 10 min. Finally the nanocomposites were washed with doubly distilled water and absolute alcohol three times respectively, thus obtaining PEDT–Au/rGO nanocomposites. The obtained mixture was dispersed into 50 mL doubly distilled water and sonicated for 30 min for later use. Pure rGO and PEDT–Au samples were synthesis by similar method for comparison.
2.3 Fabrication of bare GCE and PEDT–Au/rGO/GCE
Prior to modification, a bare glassy carbon electrode (GCE, 3 mm in diameter) was initially polished with 0.3 and 0.05 μm alumina powder, and then washed ultrasonically with absolute alcohol and doubly distilled water in sequence for 1 minute to obtain a mirror-like surface. For the fabrication of the modified electrode based on PEDT–Au/rGO nanocomposites, 8 μL of the obtain mixture (PEDT–Au/rGO nanocomposites) was dropped onto the electrode surface and dried under infrared lamp. The rGO/GCE and PEDT–Au/GCE were prepared under the same conditions.
2.4 Apparatus and method
Voltammetric measurements were conducted on a CHI660E electrochemical workstation (Chenhua, Shanghai, China). Electrochemical impedance spectroscopy (EIS) was performed on a Princeton electrochemical workstation (PARSTAT 2273, USA). The three-electrode system consisted of working GCE (a bare GCE or a modified GCE), a saturated calomel electrode (SCE) as reference electrode and a platinum wire auxiliary electrode used in all electrochemical experiments. A scanning electron microscope (SEM, JSM-6701F, Japan), transmission electron microscope (TEM, FEI Tecnai F20, Germany) and X-ray spectroscopy (EDS, OXFORD 7421, England) were applied to characterize the surface morphology of the PEDT–Au/rGO/GCE. The pH values were monitored using a pH meter PHS-3C (Precision scientific instruments co., Ltd., Shanghai, China).
For cyclic voltammetry (CV) experiments, scan rate was 50 mV s−1, sample interval was 0.001 V. EIS was obtained in 5 mmol dm−3 of [Fe(CN)6]3−/4− solution containing 0.1 mmol dm−3 of KCl with a frequency range from 100 MHz to 100 kHz at an amplitude of 50 mV under open circuit potential. The square wave voltammetry (SWV) method, inhibiting the background currents availably, was considered to be a highly sensitive technique with a relatively lower detection limit after optimization of SWV parameters.40,42–45 The SWV parameters such as frequency, pulse amplitude and scan increment will be of great importance for the electrochemical signal. Thus, the effects of these parameters toward the oxidation peak current of 100 μmol dm−3 morin were investigated in BR buffer solution (pH = 6.0).
3. Results and discussion
3.1 Characterization of the PEDT–Au/rGO nanocomposites modified glassy carbon electrode
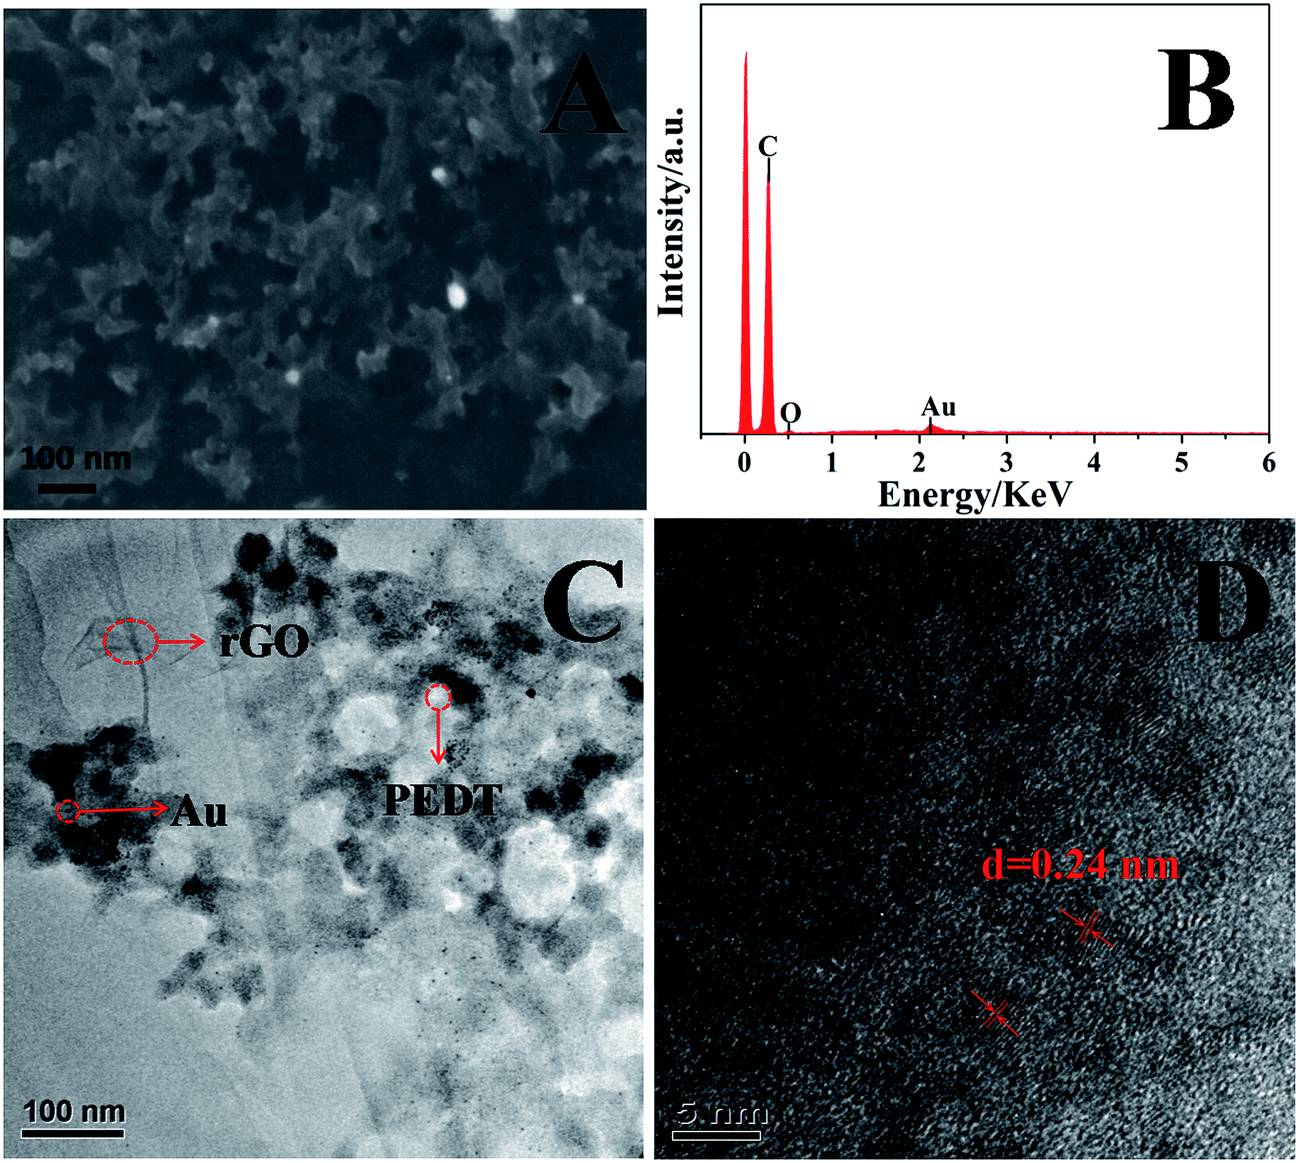
The morphology of the surface of the PEDT–Au/rGO/GCE was characterized by SEM and TEM. As showed in Fig. 1A, PEDT–Au/rGO/GCE displayed uniform morphology. As observed in TEM image (Fig. 1C), Au nanoparticles were well dispersed on the surface of rGO layers. The compact structure has been investigated and would be of great significance to promote the electrocatalytic activity for morin determination.37,40 The EDS spectrum showed that the PEDT–Au/rGO nanocomposites contained C, O and Au elements and provided a confirmation of the existence of Au nanoparticles on the modified electrode surface. Further HRTEM image (Fig. 1D) analysis indicated lattice fringes with a lattice spacing of 0.24 nm, which was closed to the interfringe distance of the [1 1 1] plane of the Au crystal.
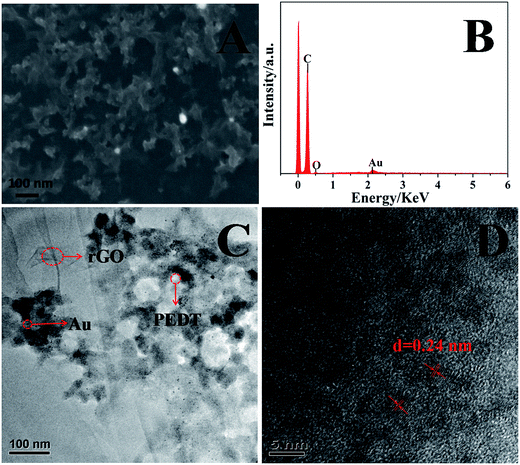 |
| | Fig. 1 SEM (A) and TEM (C) images of PEDT–Au/rGO/GCE; (B) EDS analysis of PEDT–Au/rGO/GCE, and (D) HRTEM image of PEDT–Au/rGO/GCE. | |
In order to investigate the electron transfer capability between different electrode surface and electrolyte solution, the EIS measurement of GCE (a), rGO/GCE (b), PEDT–Au/GCE (c) and PEDT–Au/rGO/GCE (d) were recorded in 5 mmol dm−3 of [Fe(CN)6]3−/4− solution containing 0.1 mmol dm−3 of KCl, which was showed in Fig. 2. In particular, the semicircle diameter at higher frequencies and linear portion at lower frequencies correspond to the charge transfer resistance (Rct) and the diffusion process, respectively. The equivalent electrical circuit was chosen to fit the impedance plot (the inset of Fig. 2). Here, Rs represents ohmic resistance of electrolyte solution, CPE is the constant phase element, which was influenced by the roughness and adsorption of the electrode surfaces, and W is the Warburg resistance resulted from semi-infinite diffusion.
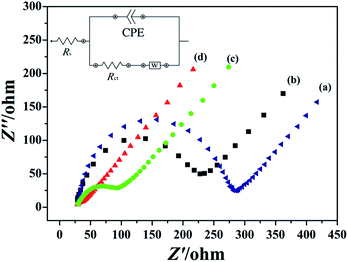 |
| | Fig. 2 EIS plots of (a) bare GCE, (b) rGO/GCE, (c) PEDT–Au/GCE and (d) PEDT–Au/rGO/GCE in 5.0 mM [Fe(CN)6]3−/4− solution containing 0.1 M KCl, frequency region from 0.1–100 kHz, scan rate: 50 mV s−1. The inset shows the equivalent electrical circuit diagrams for EIS plots. | |
As seen from Fig. 2, the order of the semicircle diameters of the different modified electrodes was described as rGO/GCE (b) > PEDT–Au/GCE (c) > PEDT–Au/rGO/GCE (d), which presented the Rct was rGO/GCE (b) > PEDT–Au/GCE (c) > PEDT–Au/rGO/GCE (d) and the electron transfer ability was PEDT–Au/rGO/GCE (d) > PEDT–Au/GCE (c) > rGO/GCE (b). As showed, the PEDT–Au/rGO nanocomposites modified electrode demonstrated the smallest semicircle, and the Rct was estimated to be 23.88 Ω, revealing the lowest electron transfer resistance on the PEDT–Au/rGO/GCE. In addition, the Rct of PEDT–Au/rGO/GCE was much lower than that obtained for PEDT–Au/GCE (69.48 Ω) and rGO/GCE (204.8 Ω), attributed to the accelerating of electron transfer by PEDT–Au nanoparticles and rGO layers. These results indicated that both PEDT–Au nanoparticles and rGO layers were excellent electron conductive materials and greatly facilitated the electron transfer process.
3.2 Optimization of SWV parameters for morin determination
SWV method was used to investigate the electrocatalytic performance for morin determination recorded on PEDT–Au/rGO/GCE. The effects of SWV parameters on the peak current towards 100 μmol dm−3 morin in BR buffer solution (pH = 6.0) were studied to obtain optimal values. When the SWV frequency was varied from 5 Hz to 100 Hz, the peak current increased with frequency and reached a maximum at 20 Hz, thus, the frequency of 20 Hz was chosen for subsequent measurements. The pulse amplitude from 10 mV to 100 mV was evaluated. The highest peak current was obtained at pulse amplitude of 25 mV. The effect of the scan increment (1.0–10.0 mV) was also investigated, and the maximum peak current was observed at a scan increment of 4.0 mV. Overall, the optimal experimental parameters were summarized to be 20 Hz for frequency, 25 mV for pulse amplitude and 4.0 mV for scan increment. These experimental parameters were selected for subsequent experiments.
3.3 Electrochemical behavior of PEDT–Au/rGO/GCE
The electrochemical performances of bare GCE (a), rGO/GCE (b), PEDT–Au/GCE (c) and PEDT–Au/rGO/GCE (d) were monitored via CV and SWV in a BR buffer solution (pH = 6.0) in the presence (Fig. 3B and C) and absence (Fig. 3A) of 100 μmol dm−3 morin. In the absence of morin, there was no any oxidation peaks occurred on the above electrodes. In addition, the background currents on the modified electrodes are larger than those on the bare GCE (Fig. 3A curve a), especially, PEDT–Au/GCE (Fig. 3A curve c) and PEDT–Au/rGO/GCE (Fig. 3A curve d) presented significantly larger background currents. The phenomenon might be due to the good capacitive performance of PEDT.33,35 This is also why we choose SWV but not CV to investigate the sensor performance below. Upon addition of 100 μmol dm−3 morin, an obvious irreversible oxidation peak appeared at the all electrodes, confirming the morin-based process. Compared to bare GCE (Fig. 3B curve a), both rGO/GCE (Fig. 3B curve b) and PEDT–Au/GCE (Fig. 3B curve c) exhibited higher oxidation peak current. However, the oxidation peak current of morin at PEDT–Au/rGO/GCE (Fig. 3B curve d) was the highest and was about six-fold larger than bare GCE, which indicated that the PEDT–Au/rGO nanocomposites enhanced the electrocatalytic activity of morin after composited PEDT–Au with rGO together due to the large specific surface area and high conductivity of the nanocomposites. Moreover, the background-subtracted SWV (Fig. 3C), possessing highly sensitivity, was in accordance with the previous results concluded by CV. Therefore, this observation demonstrated that PEDT–Au/rGO/GCE exhibited superior electrocatalytic activity toward morin oxidation.
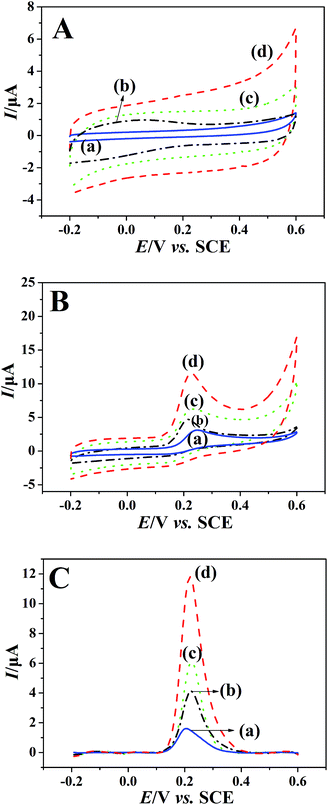 |
| | Fig. 3 (A) CVs of the (a) bare GCE, (b) rGO/GCE, (c) PEDT–Au/GCE and (d) PEDT–Au/rGO/GCE in BR buffer solution (pH = 6.0) with the absence of morin. (B) CVs of the (a) bare GCE, (b) rGO/GCE, (c) PEDT–Au/GCE and (d) PEDT–Au/rGO/GCE obtained in BR buffer solution (pH = 6.0) containing 100 μmol dm−3 morin. (C) Background-subtracted SWVs of 100 μmol dm−3 morin in BR buffer solution (pH = 6.0) at (a) bare GCE, (b) rGO/GCE, (c) PEDT–Au/GCE and (d) PEDT–Au/rGO/GCE. | |
3.4 Scan rate effect of the morin determination
As showed in Fig. 4, the oxidation peak currents of 100 μmol dm−3 morin obtained at the PEDT–Au/rGO/GCE by CV showed linearity with scan rates, ranging from 20 to 400 mV−1 in a BR buffer solution (pH = 6.0). In particular, the linear regression equation was expressed for morin as Ipa (μA) = 63.66υ (V s−1) + 6.651 (r = 0.9970). This result indicated that the oxidation process of morin was typical absorption controlled electrochemical process.17 For an irreversible absorption system, the number of electron transferred (n) can be calculated based on the Laviron formula of eqn (1):18,46| |
 | (1) |
where Q is equal to the peak area, F is the Faraday's constant, v is the scan rate, R is the molar constant and T is the experimental temperature. According to the linear regression equation between the peak current (Ipa) and scan rate (v), the slope is utilized to calculate electron transferred number. Hence, n was calculated to be 1.083, indicating that one electron transfer occurred, which was in good agreement with that in the previous literature.9,17,47
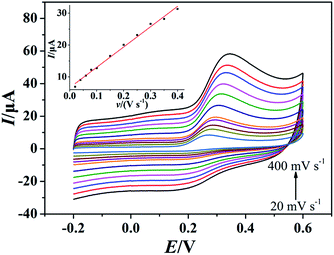 |
| | Fig. 4 CVs of morin (100 μmol dm−3) at the PEDT–Au/rGO/GCE in BR buffer solution (pH = 6.0) at different scan rates (20, 40, 60, 80, 100, 150, 200, 250, 300, 350, 400 mV s−1). Inset: the relationship between the oxidation peak current and scan rate. | |
3.5 Effects of accumulation time and accumulation potential
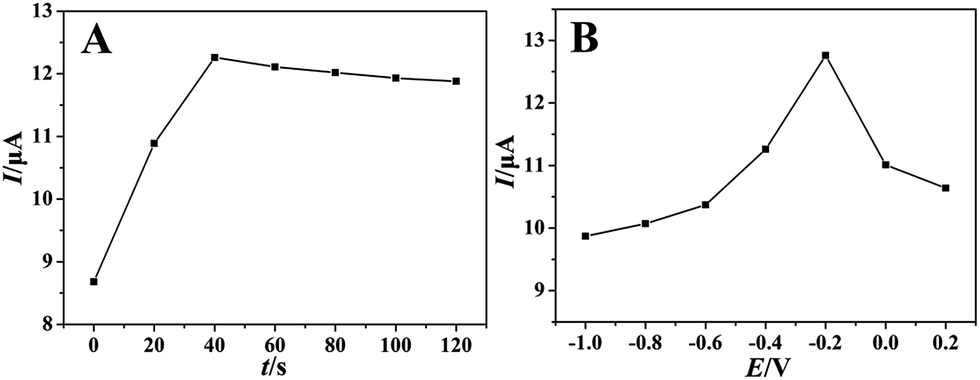
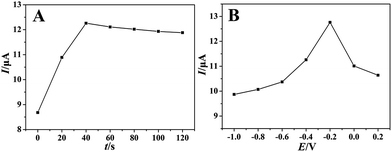
With regard to typical absorption controlled electrochemical process, it is necessary to investigate the effects of accumulation time and accumulation potential. As showed in Fig. 5A, the oxidation peak current by SWV increased gradually with the accumulation time, reached the maximum at 40 seconds (accumulation potential was −0.2 V). It indicated the accumulation time of 40 seconds was sufficient to reach the saturation of surface catalysis active sites of PEDT–Au/rGO/GCE. Thus, an accumulation time of 40 seconds was chosen in further experiences. We also studied the effect of the accumulation potential on the oxidation peak current of morin with the optimal accumulation time. As showed in Fig. 5B, the oxidation peak current increased gradually with the accumulation potential and reached the maximum when the accumulation potential was −0.2 V. Therefore, an accumulation potential of −0.2 V was employed in the following experiences.
 |
| | Fig. 5 The effects of accumulation time (A) and potential (B) on the oxidation peak currents of morin (100 μmol dm−3) at the PEDT–Au/rGO/GCE in BR buffer solution (pH = 6.0). | |
3.6 Optimization of pH
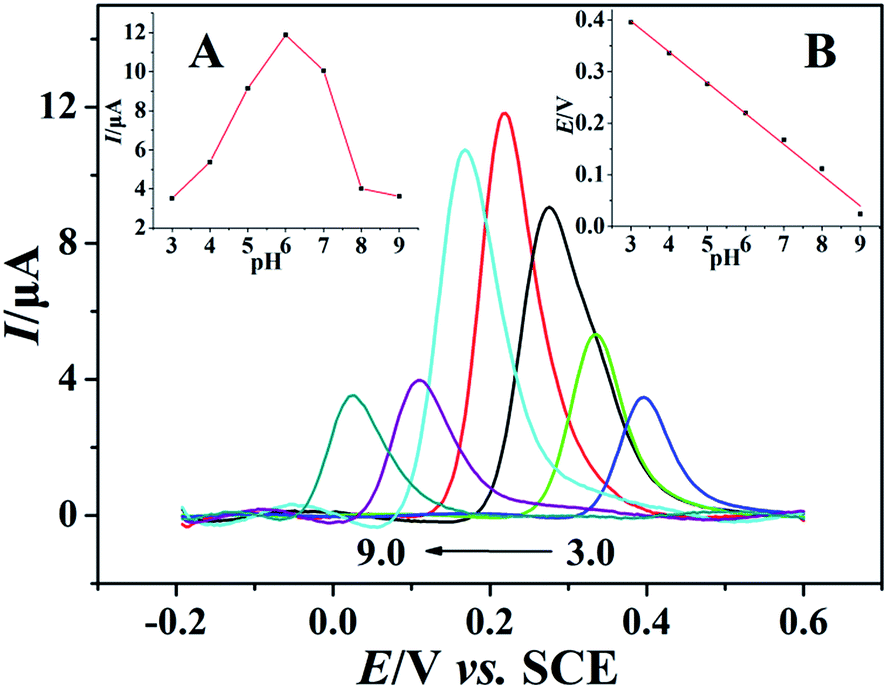
The pH effect on electrochemical performance of morin at the PEDT–Au/rGO/GCE was investigated in BR buffer solution with the pH ranging from 3.0 to 9.0. As illustrated in Fig. 6, the oxidation peak potential of morin shifted negatively when the pH varied from 3.0 to 9.0. In particular, from the inset B in Fig. 6, linear relationship between the oxidation peak potential and the pH was expressed as: Epa (V) = −0.05971 pH + 0.5771 (r = 0.9975). According to eqn (2):46,48| |
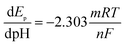 | (2) |
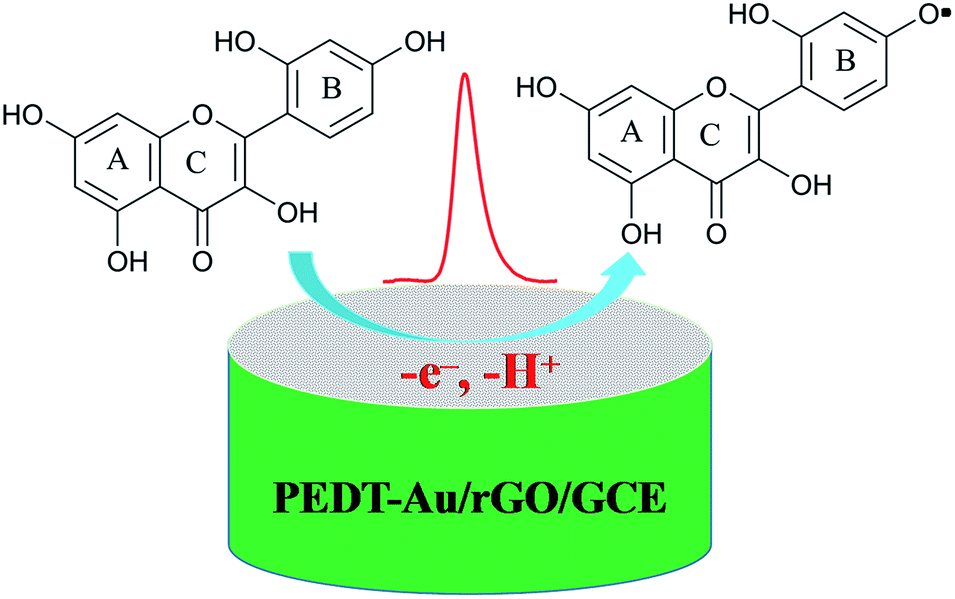
where m and n represent the numbers of the proton and electron transferred, respectively. From the slope of the Ep–pH plot, the m/n value in this system was calculated to be 1.009, indicating that the numbers of proton and electron transferred were equal in the oxidation of morin. With the consequence discussed above, we can draw a conclusion that the oxidation of morin involving one proton and one electron transfer. The supposed reaction mechanism of morin can be concluded as Scheme 1.9,17,47 Furthermore, the inset A in Fig. 6 revealed that the oxidation response for morin was most sensitive at pH of 6.0, hence, pH 6.0 was chosen as an optimum electrolyte condition for subsequent quantitative analysis.
 |
| | Fig. 6 Background-subtracted SWVs of 100 μmol dm−3 morin in BR buffer solution recorded on PEDT–Au/rGO/GCE at different pH (from 3.0 to 9.0) with a frequency of 20 Hz, a pulse amplitude of 25 mV and a scan increment of 4.0 mV. Inset: the relationship of (A) pH vs. oxidation peak current and (B) pH vs. oxidation peak potential of morin. | |
 |
| | Scheme 1 The proposed electrocatalytical reaction mechanism of morin occurring on the surface of the PEDT–Au/rGO/GCE. | |
3.7 The determination of morin under optimal conditions
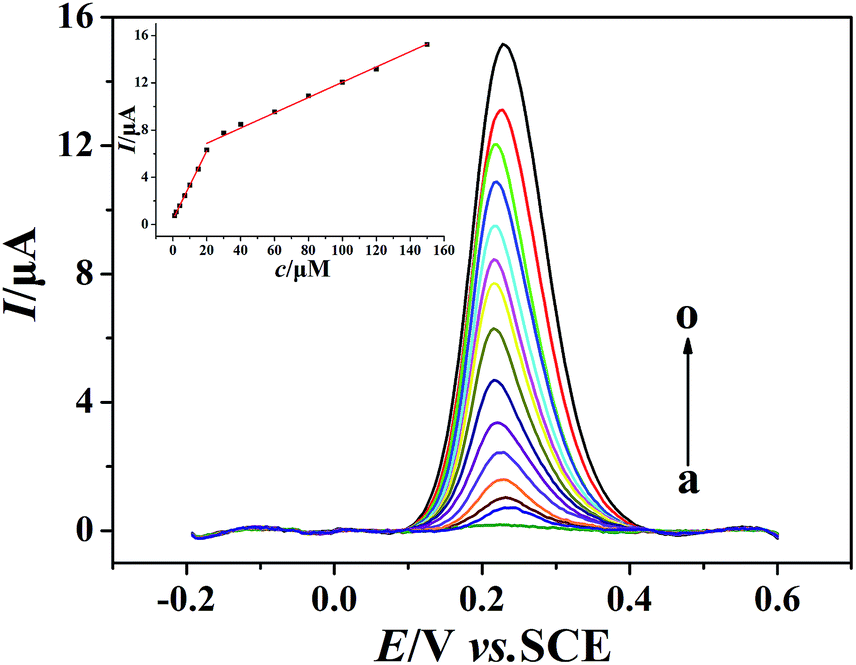
The quantitative determination of morin at the PEDT–Au/rGO/GCE under optimal conditions was achieved by SWV (Fig. 7). As it can be seen, the oxidation peak currents of morin increased with concentrations varied from 1 to 150 μmol dm−3. The determination ranges of morin were obtained as 1–20 μmol dm−3 and 20–150 μmol dm−3. The calibration curve of morin at the PEDT–Au/rGO/GCE gave linear equations as: Ipa1 (μA) = 0.2895c (μmol dm−3) + 0.4518 (r = 0.9996) and Ipa2 (μA) = 0.06156c (μmol dm−3) + 5.9246 (r = 0.9994), respectively. At a signal/noise of 3 (S/N = 3), the morin sensor gave a low detection limit of 0.0083 μmol dm−3. Compared with the reported electrochemical sensors for morin,1,5,16,18–20 the PEDT–Au/rGO/GCE we fabricated exhibited a relatively wide linear rage and low detection limit, which can be attributed to the excellent electrocatalytic activity of PEDT–Au/rGO nanocomposites. The comparison of performances of the PEDT–Au/rGO/GCE with other electrodes was shown in Table 1.
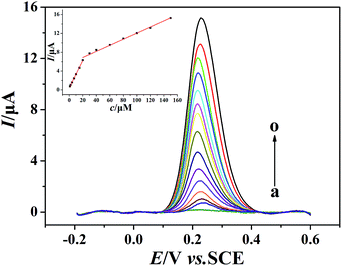 |
| | Fig. 7 Background-subtracted SWVs of morin (100 μmol dm−3) at the PEDT–Au/rGO/GCE in BR buffer solution (pH = 6.0). Concentrations: 1, 2, 4, 7, 10, 15, 20, 30, 40, 60, 80, 100, 120 and 150 μmol dm−3 (from a to o). Inset: plots of oxidation peak currents of morin vs. various concentrations. | |
Table 1 Comparison of performances of the PEDT–Au/rGO/GCE with other electrodes
| Electrode |
Detection range (μmol dm−3) |
Detection limit (μmol dm−3) |
Ref. |
| Graphene oxide/silver nanoparticles/GCE |
0.01–5.0 |
0.0033 |
1 |
| GCE |
0.127–25.0 |
0.0125 |
5 |
| Cetylpyridium bromide/single-walled carbon nanotubes/GCE |
0.1–750 |
0.0289 |
16 |
| Renewable pencil electrode |
0.095–1.33 |
0.025 |
18 |
| Hanging mercury dropping electrode |
0.019–0.193 |
0.00719 |
19 |
| RuNPs/C4A5/rGO/GCE |
0.0001–0.01 |
0.00002 |
20 |
| PEDT–Au/rGO/GCE |
1–20; 20–150 |
0.0083 |
This work |
3.8 Selectivity, stability and reproducibility of the PEDT–Au/rGO/GCE
Selectivity is an important factor for the judgment of the morin sensor for the practical application. In order to mimic the interruption in real human samples, 100-fold concentrations of ionic species (such as Na+, Cl−, K+, NO3−, PO43−, SO42−, F−, CO32−, Ca2+, Mg2+, Zn2+, NH4+ and Ac−), and 50-fold concentrations of organic species (glucose, maltose, sucrose, ascorbic acid and dopamine) were used to evaluate by SWV. We found that the influences of possible interfering substances on the determination of morin can be negligible (Table S1, ESI†). Furthermore, in Fig. S1,† interferences resulted from 10-fold concentrations of flavonoids compounds (quercetin, rutin, myricitrin and diosmetin, signal change below 10%) were negligible.
In addition, the stability of the as-prepared morin sensor is another important factor. The oxidation peak current of morin remained 92.42 ± 0.91% of its initial value when the PEDT–Au/rGO/GCE was stored at 5 °C in a refrigerator for four weeks (Fig. S2, ESI†). Besides, the reproducibility of the morin sensor was proved by using six identically fabricated PEDT–Au/rGO/GCEs with a satisfactory relative standard deviation (RSD) of 3.54 ± 0.41% (Fig. S3, ESI†). Therefore, with excellent selectivity, stability and reproducibility, the PEDT–Au/rGO/GCE is promising for morin determination.
3.9 Determination in real samples
As a polyphenolic antioxidant, morin has been clinically used for anti-viral medications. In order to evaluate the application potential of the PEDT–Au/rGO/GCE for determination of morin in real sample, human serum samples were used for quantitative determination by the standard-addition technique. Three parallel experiments were performed on all measurements by SWV. As shown in Table 2, the average recoveries from the human serum samples were obtained between 96.16% and 101.28%, and the RSD value was below 5%. Therefore, the PEDT–Au/rGO/GCE is suitable for the quantitative determination of morin in real samples.
Table 2 Determination of morin in real human serum samples
| Sample number |
Added (μmol dm−3) |
Founda (μmol dm−3) |
Recovery (%) |
RSD (%) |
| Confidence interval of 95%, n = 5. |
| 1 |
150 |
151.92 ± 3.56 |
101.28 |
4.07 |
| 2 |
100 |
100.40 ± 1.86 |
100.40 |
2.13 |
| 3 |
30 |
29.48 ± 1.60 |
98.27 |
1.82 |
| 4 |
15 |
14.84 ± 0.85 |
98.93 |
0.98 |
| 5 |
5 |
4.81 ± 0.70 |
96.16 |
0.80 |
4. Conclusions
In summary, a high performance PEDT–Au/rGO/GCE sensor for morin detection was fabricated based on a facile synthesis of PEDT–Au/rGO nanocomposites. The as-prepared PEDT–Au/rGO/GCE showed much better performances towards morin detection when compared with bare GCE, rGO/GCE and PEDT–Au/GCE, which could be attributed to the synergistic catalytic effect of the catalytic active sites of PEDT–Au and high specific surface area of rGO. Due to its larger capacitance, SWV was chose to evaluate the electrocatalytic activity, sensitivity, selectivity and reproducibility of the as fabricated PEDT–Au/rGO/GCE for morin detection. Under the optimized conditions, PEDT–Au/rGO/GCE exhibited a wide linear detection range of 1 to 150 μmol dm−3 and a low detection limit of 0.0083 μmol dm−3 for morin. Moreover, this work may provide a facile and effective analysis approach for determination of morin in real pharmaceutical and biological samples.
Conflicts of interest
There are no conflicts to declare.
Acknowledgements
Financial support from the National Natural Science Foundation of China (Grant No. 21375016, 21475022, 21505019) and the Guangdong Provincial Key Platform and Major Scientific Research Projects for Colleges and Universities (No. 2014KTSCX181 and 2015KCXTD029) are gratefully acknowledged. We also acknowledge the Technology Planning Project of Guangdong Province (No. 2015B090927007) and the Natural Science Foundations of Guangdong Province (2015A030310272).
References
- M. L. Yola, V. K. Gupta, T. Eren, A. E. Şen and N. Atar, Electrochim. Acta, 2014, 120, 204–211 CrossRef CAS.
- T. W. Wu, L. H. Zeng, J. Wu and K. P. Fung, Biochem. Pharmacol., 1994, 47, 1099–1103 CrossRef CAS PubMed.
- J. Venu Gopal, J. Pharmacogn., 2013, 5, 123–126 CrossRef.
- Y. Zhou, Z.-Q. Cao, H.-Y. Wang, Y.-N. Cheng, L.-G. Yu, X.-K. Zhang, Y. Sun and X.-L. Guo, Mol. Nutr. Food Res., 2017, 1600966–1600976 Search PubMed.
- A. Y. Tesio, A. M. Granero, H. Fernández and M. A. Zón, Electrochim. Acta, 2011, 56, 2321–2327 CrossRef CAS.
- F. Wang, Y. Xu, J. Zhao and S. Hu, Bioelectrochemistry, 2007, 70, 356–362 CrossRef CAS PubMed.
- J. Kang, Z. Li and X. Lu, J. Pharm. Biomed. Anal., 2006, 40, 1166–1171 CrossRef CAS PubMed.
- A. Masek, E. Chrzescijanska and M. Zaborski, Food Chem., 2014, 148, 18–23 CrossRef CAS PubMed.
- J. Wang, X. Zhou, S. Liu, G. Li, L. Shi, J. Dong, W. Li, X. Deng and X. Niu, J. Appl. Microbiol., 2015, 118, 753–763 CrossRef CAS PubMed.
- T. W. Wu, K. P. Fung, C. C. Yang and R. D. Weisel, Life Sci., 1995, 57, 51–56 Search PubMed.
- L. Pavun, D. Đikanović, P. Đurđević, M. Jelikić-Stankov, D. Malešev and A. Ćirić, Acta Chim. Slov., 2009, 56, 967–972 CAS.
- S. Kongkiatpaiboon, P. Tungsukruthai, K. Sriyakool, K. Pansuksan, A. Tunsirikongkon and H. Pandith, J. Chromatogr. Sci., 2017, 55, 346–350 Search PubMed.
- Y. Liu, J. Anhui Agric. Sci., 2008, 36, 9128–9129 CAS.
- A. Zielińska, K. Paradowska, J. Jakowski and I. Wawer, J. Mol. Struct., 2008, 873, 109–116 CrossRef.
- K. M. Bark, S. E. Im, J. J. Seo, O. H. Park, C. H. Park and H. R. Park, Bull. Korean Chem. Soc., 2015, 36, 498–502 CAS.
- G. Ziyatdinova, E. Ziganshina and H. Budnikov, Electrochim. Acta, 2014, 145, 209–216 CrossRef CAS.
- P. Xiao, Q. Zhou, F. Xiao, F. Zhao and B. Zeng, Int. J. Electrochem. Sci., 2006, 1, 228–237 CAS.
- Y. M. Temerk, M. S. Ibrahim, M. Kotb and W. Schuhmann, Electroanalysis, 2013, 25, 1381–1387 CrossRef CAS.
- Y. M. Temerk, M. S. Ibrahim and K. Mohammed, J. Braz. Chem. Soc., 2011, 22, 2056–2064 CrossRef CAS.
- S. Elcin, M. L. Yola, T. Eren, B. Girgin and N. Atar, Electroanalysis, 2016, 28, 611–619 CrossRef CAS.
- Z. Y. Yang, N. N. Dai, R. T. Lu, Z. H. Huang and F. Y. Kang, Carbon, 2016, 104, 260 CrossRef.
- Y. Lin, S. Liu, S. Chen, Y. Wei, X. Dong and L. Liu, J. Mater. Chem. C, 2016, 4, 6345–6352 RSC.
- K. Chen, L. Chen, Y. Chen, H. Bai and L. Li, J. Mater. Chem., 2012, 22, 20968–20976 RSC.
- Q. Li, N. Mahmood, J. Zhu, Y. Hou and S. Sun, Nano Today, 2014, 9, 668–683 CrossRef CAS.
- Z. Wang and C. J. Liu, Nano Energy, 2015, 11, 277–293 CrossRef CAS.
- Y. Mao, Y. Bao, S. Gan, F. Li and L. Niu, Biosens. Bioelectron., 2011, 28, 291–297 CrossRef CAS PubMed.
- X. Li, X. Wang, L. Li, H. Duan and C. Luo, Talanta, 2015, 131, 354–360 CrossRef CAS PubMed.
- P. Yáñezsedeño, S. Campuzano and J. M. Pingarrón, Anal. Chim. Acta, 2017, 960, 1–17 CrossRef PubMed.
- T. Wu, Z. Liu, Y. Guo and C. Dong, J. Electroanal. Chem., 2015, 759, 137–143 CrossRef CAS.
- S. G. Chatterjee, S. Chatterjee, A. K. Ray and A. K. Chakraborty, Sens. Actuators, B, 2015, 221, 1170–1181 CrossRef.
- Z. Zhang, X. Zou, L. Xu, L. Liao, W. Liu, J. Ho, X. Xiao, C. Jiang and J. Li, Nanoscale, 2015, 7, 10078–10084 RSC.
- S. Erogul, S. Z. Bas, M. Ozmen and S. Yildiz, Electrochim. Acta, 2015, 186, 302–313 CrossRef CAS.
- A. Sharma, A. Kumar and R. Khan, Mater. Sci. Eng., C, 2017, 76, 802 CrossRef CAS PubMed.
- A. Ali, R. Jamal, T. Abdiryim and X. Huang, J. Electroanal. Chem., 2017, 787, 110–117 CrossRef CAS.
- J. M. Yun, J. S. Yeo, J. Kim, H. G. Jeong, D. Y. Kim, Y. J. Noh, S. S. Kim, B. C. Ku and S. I. Na, Adv. Mater., 2011, 23, 4923–4928 CrossRef CAS PubMed.
- G. H. Shim, M. G. Han, J. C. Sharp-Norton, S. E. Creager and S. H. Foulger, J. Mater. Chem., 2008, 18, 594–601 RSC.
- Z. Liu, J. Xu, R. Yue, T. Yang and L. Gao, Electrochim. Acta, 2016, 196, 1–12 CrossRef CAS.
- Z. Liu, B. Lu, Y. Gao, T. Yang, R. Yue, J. Xu and L. Gao, RSC Adv., 2016, 6, 89157–89166 RSC.
- A. R. B. M. Yusoff, J. Kim, S. J. Lee and J. Jin, RSC Adv., 2015, 5, 23892–23899 RSC.
- S. Amin, M. T. Soomro, N. Memon, A. R. Solangi, U. Sirajuddin, T. Qureshi and A. R. Behzad, Environmental Nanotechnology, Monitoring & Management, 2014, 1–2, 8–13 Search PubMed.
- W. S. Hummers and R. E. Offeman, J. Am. Chem. Soc., 1958, 80, 1339 CrossRef CAS.
- A. Chen and B. Shah, Anal. Methods, 2013, 5, 2158–2173 RSC.
- P. Dauphinducharme, N. Arroyocurras, M. Kurnik, G. Ortega, L. Hui and K. W. Plaxco, Langmuir, 2017, 33, 4407–4413 CrossRef CAS PubMed.
- J. C. Helfrick and L. A. Bottomley, Anal. Chem., 2009, 81, 9041–9047 CrossRef CAS PubMed.
- M. Sýs, B. Švecová, I. Švancara and R. Metelka, Food Chem., 2017, 229, 621–627 CrossRef PubMed.
- W. Cheng, J. Huang, C. Liu, Q. Zeng, Y. Tong, L. Wang and F. Cheng, RSC Adv., 2017, 7, 6950–6956 RSC.
- P. Janeiro and A. M. O. Brett, Electroanalysis, 2005, 17, 733–738 CrossRef CAS.
- Q. Zeng, T. Wei, M. Wang, X. Huang, Y. Fang and L. Wang, Electrochim. Acta, 2015, 186, 465–470 CrossRef CAS.
Footnote |
| † Electronic supplementary information (ESI) available. See DOI: 10.1039/c7ra08292d |
|
| This journal is © The Royal Society of Chemistry 2017 |
Click here to see how this site uses Cookies. View our privacy policy here. 
 Open Access Article
 This Open Access Article is licensed under a
  a,
Min Zhanga,
Jianzhi Huangb,
Faliang Cheng*a and
Lishi Wang
a,
Min Zhanga,
Jianzhi Huangb,
Faliang Cheng*a and
Lishi Wang