 Open Access Article
Creative Commons Attribution 3.0 Unported Licence
A two-step model for the tunneling conductivity of polymer carbon nanotube nanocomposites assuming the conduction of interphase regions
Razieh Razavia,
Yasser Zare b and
Kyong Yop Rhee*c
aDepartment of Chemistry, Faculty of Science, University of Jiroft, Jiroft, Iran
bYoung Researchers and Elites Club, Science and Research Branch, Islamic Azad University, Tehran, Iran
cDepartment of Mechanical Engineering, College of Engineering, Kyung Hee University, Seocheon, Giheung, Yongin 446-701, Gyeonggi 449-701, Republic of Korea. E-mail: rheeky@khu.ac.kr; Fax: +82 31 202 6693; Tel: +82 31 201 2565
First published on 27th October 2017
Abstract
This work develops a two-step model for the conductivity of polymer carbon nanotube (CNT) nanocomposites (PCNT) assuming the properties of tunneling and interphase regions. In step 1, CNT and the surrounding interphase are considered as pseudoparticles and a simple model predicts their conductivity. After that, a suitable model calculates the conductivity of nanocomposites containing pseudoparticles, tunneling regions and polymer matrixes in step 2. The waviness of CNT as well as the fractions of CNT and interphase regions in the conductive networks is also considered. The experimental results of several samples and the reasonable roles of all parameters in the conductivity of nanocomposites support the predictions of the two-step model. Thin and long CNTs can cause a high conductivity, but only thick CNTs result in the least conductivity. Also, the thickness and conduction of interphase zones directly control the conductivity of nanocomposites. So, it is important to provide a strong interphase in PCNT to achieve a high conductivity. Moreover, a poor percolation threshold and a short tunneling distance enhance the conductivity of nanocomposites, whereas only a large tunneling distance dominantly reduces the conductivity.
1 Introduction
Carbon nanotubes (CNT) display exceptional stiffness and significant electrical conductivity.1–6 Also, they have a large aspect ratio (ratio of length to diameter) and low density, which generate considerable interest for the production of conductive nanocomposites.4,7 These advanced materials are ideal for many applications in electronics, aerospace, sensors and shielding.8 Consequently, it is important to maximize the conductivity by manipulating the material and processing parameters for nanocomposites. The conductivity of nanocomposites starts from a critical concentration as a percolation threshold in which the conductive networks form.7,9,10 The previous studies have related the percolation threshold to the size of the nanofiller,7,9 but the structure of CNT as well as the interphase regions around them can manipulate the percolation threshold in nanocomposites.11,12The main mechanism for conductivity of polymer CNT nanocomposites (PCNT) involves the electron tunneling wherein electrons are carried by tunneling effect.13,14 Accordingly, the adjacent CNT improve the conductivity by electron jumping and the tunneling conductivity depends on the tunneling properties between CNT. However, some researchers have focused on the tunneling conductivity in nanocomposites. Most researchers have used the conventional equations for estimation of percolation threshold and conductivity in polymer nanocomposites. Some simple models were developed for conductivity of polymer nanocomposites. They are micromechanics models that predict the conductivity by the properties of nanofiller and filler networks such as filler arrangement, tunneling distance, filler agglomeration and CNT waviness.15–17 However, the complex and unclear terms limit their usages in practice. Furthermore, the available models commonly disregard the role of interphase regions in the percolation threshold and conductivity of nanocomposites.
The outstanding surface area of nanoparticles per unit volume and the robust interfacial interaction between polymer matrix and nanofiller create different regions from polymer and nanoparticles as interphase in nanocomposites.18–21 The interphase regions considerably govern the mechanical behavior of nanocomposites.22–24 So, the interphase areas play a reinforcing role in nanocomposites. Additionally, the interphase spaces nearby nanoparticles can make the networks in nanocomposites before the connection of nanoparticles.12,25 Therefore, the interphase regions diminish the percolation threshold and create the big networks in nanocomposites. The effect of interphase percolation on the mechanical properties of nanocomposites was reported in earlier works.25,26 However, the role of interphase regions in the electrical conductivity of nanocomposites has been neglected.
The available models such as power-law equation cannot properly assume the impacts of interphase and tunneling regions on the conductivity of nanocomposites. Definitely, the available models cannot properly estimate the conductivity in nanocomposites. Accordingly, the establishment of new models for conductivity assuming the tunneling and interphase regions is appreciated. In the present work, authors try to develop a two-step model for tunneling conductivity of PCNT accounting the interphase parameters and CNT waviness. The two-step techniques were developed to determine the effective conductivities of CNT nanocomposites.27,28 This novel methodology properly calculates the conductivity of PCNT by the effective parameters. In the first step, CNT and surrounding interphase are considered as pseudoparticles and a simple model predicts their conductivity. Afterwards, the nanocomposite containing pseudoparticles, tunneling region and polymer matrix is considered and a suitable model calculates its conductivity. The impacts of all parameters on the conductivity are plotted and justified to validate the two-step model. Also, the predictions of the two-step model are compared with the experimental results of several samples from previous works. This model can guide the researchers in future studies on the conductivity of nanocomposites.
2 Two-step approach
A two-step model in which the interphase and tunneling regions are considered can estimate the conductivity of nanocomposites. Fig. 1 schematically shows the two steps for modeling of conductivity. In step 1, CNT and interphase surrounding them are considered as pseudoparticles and a simple model estimates their conductivity. At step 2, the nanocomposite containing pseudoparticles, tunneling distance and polymer matrix is considered and a developed model calculates its conductivity. | ||
| Fig. 1 Schematic representation of (a) pseudoparticle containing CNT and surrounding interphase and (b) nanocomposite containing pseudoparticle, tunneling space and polymer matrix. | ||
Deng and Zheng16 proposed a model for conductivity of nanocomposites as:
 | (1) |
 | (2) |
This equation can be applied to estimate the conductivity of pseudoparticles in which the interphase regions cover CNT (Fig. 1). Accordingly, the interphase is assumed as a matrix neighboring CNT. Eqn (2) for conductivity of pseudoparticles is developed to:
 | (3) |
The total volume fraction of interphase in PCNT29 is estimated by:
 | (4) |
 | (5) |
Also, the fraction of CNT in the conductive networks30 is given by:
 | (6) |
The latter equation is developed assuming effective filler fraction as:
 | (7) |
Assuming eqn (4) and (7), the volume fraction of CNT and interphase regions in the networks are expressed by:
 | (8) |
 | (9) |
The percolation threshold of randomly dispersed CNT in PCNT is suggested31 by:
 | (10) |
“V” and “Vex” in PCNT are expressed31 by:
| V = πR2l | (11) |
 | (12) |
The interphase zones around CNT can accelerate the establishment of conductive networks in PCNT, because they make continuous structures before the real connection of nanoparticles. Actually, the interphase regions surrounding CNT quickly form the network structures. The interphase areas modify the excluded volume as:
 | (13) |
In addition, the large length of CNT causes the waviness in nanocomposites, which reduces their effective length (leff). A waviness parameter is suggested as:
 | (14) |
Assuming leff = l/u changes “Vex” as:
 | (15) |
Now, the percolation threshold of CNT accounting the interphase and waviness is suggested as:
 | (16) |
This equation can present useful predictions for percolation threshold of CNT in PCNT.
The waviness also weakens the nature conduction of CNT.17 The conduction of curved CNT is expressed by:
 | (17) |
Based on the latter equation, the conductivity of pseudoparticles (Fig. 1) is calculated by:
 | (18) |
For step 2, the conductivity of nanocomposite is predicted by a developed equation. A model was developed based on eqn (1) for the conductivity of nanocomposites as:
 | (19) |
 | (20) |
When “ϕN, “ϕiN” and “σp” are replaced from eqn (8), (9) and (18) into eqn (20), this model can predict the conductivity of PCNT by the main parameters. Also, z = 1 nm shows the proper predictions for the conductivity of PCNT.
3 Results and discussion
3.1 Parametric study
The effects of all parameters on the predicted conductivity by two-step model are evaluated in this section. Surely, the reasonable effects of all parameters on the conductivity of PCNT confirm the two-step model. The three-dimensional (3D) and contour plots can display the significances of two parameters on the conductivity at average values of other factors. The average levels of ϕf = 0.01, R = 10 nm, l = 10 μm, σf = 105 S m−1, u = 1.2, t = 10 nm, σi = 3 × 10⁴ S m−1, d = 4 nm and z = 1 nm are taken into account in the calculations.Fig. 2 depicts the effects of “R” and “l” parameters on the conductivity of nanocomposites by the two-step model at average values of other parameters. The highest conductivity of 0.2 S m−1 is observed at R = 5 nm, while the lowest conductivity around 0 is shown at R > 14 nm. Therefore, a smaller CNT radius achieves a better conductivity in PCNT. In other words, thinner and longer CNT can cause a higher conductivity, while only thick CNT are enough to minimize the conductivity. The role of CNT radius is more significant than that of CNT length, because R > 14 nm leads an insulated PCNT.
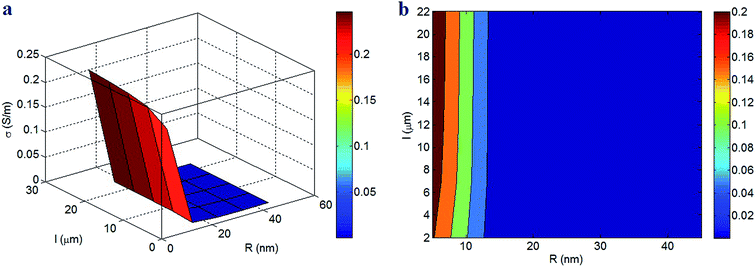 | ||
| Fig. 2 Impacts of CNT dimensions on the conductivity of nanocomposites according to the two-step model by (a) 3D and (b) contour plots. | ||
Thin and long CNT produce a small percolation threshold in nanocomposites (see eqn (16)), i.e. thin and long CNT accelerate the formation of conductive networks in PCNT. Also, a low percolation threshold increases the fraction of CNT in the networks (eqn (7)). In fact, thin and long CNT can make big networks containing CNT and interphase regions in the nanocomposites. So, it is reasonable to gain a higher conductivity by thinner and longer CNT, because the big networks significantly transfer the electrons within nanocomposite increasing the conductivity. On the other hand, thick and short CNT result in the small networks, which cause a poor conductivity in nanocomposites. Conclusively, these outputs validate the predictions of the two-step model for conductivity of PCNT.
Fig. 3 also illustrates the conductivity of nanocomposites at different levels of filler concentration and waviness. ϕf = 0.02 and u = 1 (no waviness) produce the highest conductivity of 0.18 S m−1, but an insulated nanocomposite is observed at ϕf < 0.007. Accordingly, high filler fraction and low waviness induce a high conductivity in PCNT, while a low level of “ϕf” cannot increase the conductivity of nanocomposites. In fact, the high concentration of straight CNT can significantly increase the conductivity of nanocomposites. On the other hand, only a low concentration of straight or curved CNT causes an insulated nanocomposite. The insulated polymer matrices need the conductive networks for transferring of electrons and promoting the conductivity. As a result, the conductive CNT should form the networks in PCNT to enhance the conductivity. A high level of CNT concentration above percolation threshold certainly produces the big and dense networks in the nanocomposites, whereas the low percentages of CNT cannot reach the percolating level producing an insulated nanocomposite. So, the high fraction of CNT in nanocomposites logically improves the conductivity, as suggested by two-step model. In addition, a low waviness increases the effective length of CNT, which reduces the percolation threshold and increases the dimensions of conductive networks. Also, a poor waviness increases the nature conduction of CNT in PCNT (see eqn (17)). Based on these evidences, the waviness of CNT is an important factor, which affects the conductivity of nanocomposites, because it governs the size and conduction of conductive networks. Furthermore, the observation of a high conductivity by a poor waviness is sensible approving the developed model.
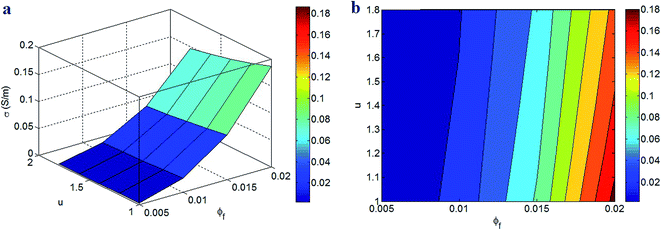 | ||
| Fig. 3 (a) 3D and (b) contour patterns for the roles of filler concentration and waviness in the conductivity of nanocomposites. | ||
Fig. 4 exhibits the effects of interphase parameters on the conductivity of PCNT based on the two-step model. The low values of interphase thickness and conduction (t < 15 nm and σi < 4 × 10⁴ S m−1) cause very poor conductivity, but t = 25 nm and σi = 6 × 10⁴ S m−1 create the highest conductivity of 1 S m−1. These results demonstrate that the interphase thickness and conduction directly manipulate the conductivity of nanocomposites. Actually, a thicker and more-conductive interphase introduces a more-conductive nanocomposite, while thin and poor-conductive interphase cannot improve the conductivity. As a result, it is important to provide strong interphase regions in PCNT to grow the conductivity.
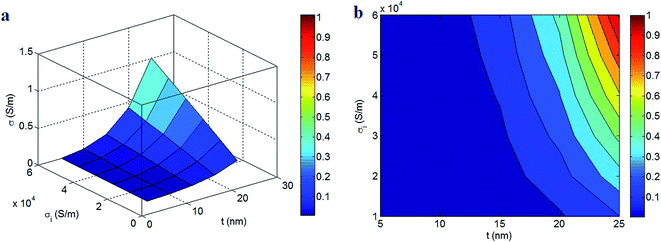 | ||
| Fig. 4 Expression of conductivity of nanocomposites at different thickness and conduction of interphase: (a) 3D and (b) contour designs. | ||
The correlation between the conductivity of PCNT and the interphase parameters is reasonable, because the interphase level straightly affects the size and conductivity of filler networks. A thick interphase around CNT decreases the percolation level and enhances the size of conductive networks in the nanocomposites (expressed by f parameter), because a thick interphase produces large interphase regions in the nanocomposites. Also, a high level of interphase conduction raises the conductivity of networks, because the networks include the CNT and interphase areas. From the present modeling view, the high conduction of interphase regions increases the conductivity of pseudoparticles (see Fig. 1 and eqn (18)) which develops the conductivity of PCNT. According to these interpretations, the developed two-step model accurately predicts the conductivity of nanocomposites at different interphase extents.
The impacts of percolation threshold and tunneling distance on the conductivity of PCNT are also expressed in Fig. 5. The low levels of these parameters produce a good conductivity, but a poor conductivity is observed at their high extents. ϕp = 0.001 and d = 2 nm cause the highest conductivity of 0.16 S m−1, but an insulated nanocomposite is observed at d > 4 nm. Therefore, a poor percolation threshold and a short tunneling distance enhance the conductivity of nanocomposites, whereas the large tunneling distance cannot improve the conductivity. These results indicate that the large tunneling distance is a dominant parameter affecting the conductivity, because it weakens the conductivity at different percolation levels. However, a short tunneling distance cannot lonely improve the conductivity and a poor percolation threshold is also required to maximize the conductivity.
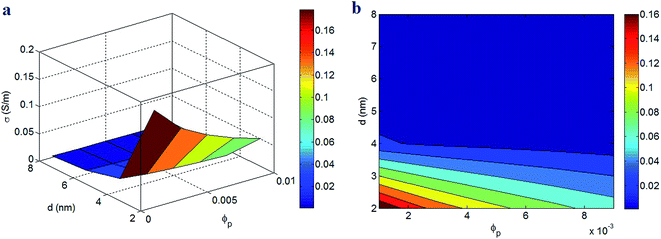 | ||
| Fig. 5 (a) 3D and (b) contour plots for dependences of PCNT conductivity on percolation threshold and tunneling distance. | ||
A low percolation threshold quickens the formation of conductive networks in the nanocomposites. Also, a poor percolation threshold introduced by thin and long CNT as well as thick interphase (eqn (16)) increases the fraction of networked CNT. In other words, a poor percolation level increases the “f” parameter (eqn (7)) which enlarges the volume fractions of CNT and interphase regions in the conductive networks. Nevertheless, a high percolation level reduces the amounts of CNT and interphase zones in the conductive networks. Since the dimensions of conductive networks directly influence the extent of conductivity in nanocomposites, the developed model correctly shows the role of percolation threshold in the conductivity. Most of experimental and theoretical studies on the conductivity of nanocomposites reported the same observation,13,16,30,32 which confirms the two-step model.
The tunneling distance between adjacent CNT also controls the level of electron transportation in the networks. A low tunneling distance can rapidly transfer the electrons between two CNT, but a large tunneling distance weakens the electron transportation. The previous articles indicated that the far tunneling distance (more than 10 nm) cannot promote the conductivity,17 because it cannot transfer the electrons by jumping. It should be noted that the interaction between adjacent CNT affects the tunneling distance. The attraction between CNT shortens the distance between CNT, which desirably handles the tunneling conductivity, but the repulsive force between very near CNT undesirably controls the tunneling effect. Some authors also found an inverse relation between tunneling distance and filler concentration.33,34 This correlation is logical, because the high concentration of filler decreases the distance among nanoparticles. Moreover, many studies have mentioned an inverse relation between the conductivity of nanocomposites and the tunneling distance.13,14,35 All these evidences approve the calculations of conductivity by the two-step model at different tunneling distances.
Fig. 6 expresses the conductivity of nanocomposites at various values of “σf” and “f” parameters. The highest conductivity is calculated by the highest levels of these parameters, but low “f” produces poor conductivity in nanocomposites. Therefore, high filler conduction and high percentage of CNT in the networks are necessary to increase the conductivity, while only low fraction of percolated CNT causes a poor conductivity. In other words, few number of networked CNT cannot grow the conductivity of nanocomposites.
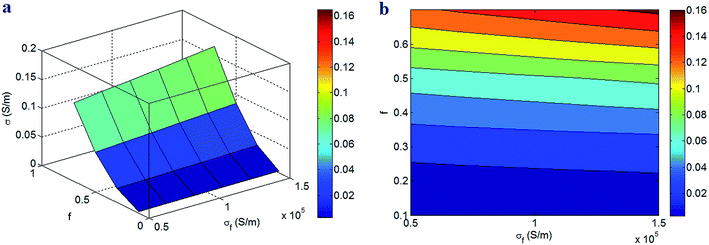 | ||
| Fig. 6 The conductivity of nanocomposites at different levels of filler conduction and “f” parameter: (a) 3D and (b) contour plans. | ||
The two-step model properly suggests the direct relation between the conductivity of nanocomposites and the filler conduction, because a more conduction of CNT causes a more transportation of electrons in nanocomposites. However, the poor conduction of CNT in the nanocomposites cannot transfer the electrons in the insulated polymer matrix. As a result, the conductivity of PCNT directly depends on the CNT conduction. However, the conductivity of nanocomposites starts to improve when the CNT form the conductive networks at percolation threshold. Actually, the dispersed CNT cannot transport the electrons, because the electrons need the continuous structures for transportation. Instead, the large and dense networks containing numerous CNT and big interphase regions (high f) significantly improve the conductivity of nanocomposites. So, the formation and dimensions of conductive networks significantly govern the conductivity of nanocomposites. When a low number of CNT participate in the networks, a poor conductivity is obtained, due to the weak transportation of electrons in nanocomposites. In this condition, the CNT conduction is an ineffective parameter, because the nanotubes cannot form the continuous structures. These rational effects of “σf” and “f” parameters on the conductivity justify the correctness of the two-step model.
3.2 Valuation of two-step model by experimental data
The developed two-step model is assessed by the experimental results of conductivity in several samples from literature. Four samples including ultrahigh molecular weight polyethylene (UWPE)/multi walled CNT (MWCNT) (R = 8 nm, l ≈ 8 μm, u ≈ 1.2, ϕp = 0.0007),36 epoxy/MWCNT (R = 8 nm, l ≈ 30 μm, u ≈ 1.2, ϕp = 0.0002),37 polycarbonate (PC)/acrylonitrile butadiene styrene (ABS)/MWCNT (R = 5 nm, l ≈ 1.5 μm, u ≈ 1.2, ϕp = 0.002)34 and poly(vinyl chloride) (PVC)/MWCNT (R = 8 nm, l ≈ 16 μm, u ≈ 1.2, ϕp = 0.0005)38 were chosen from valid works. When the CNT dimensions and percolation threshold of samples are applied into eqn (16), the interphase thickness (t) can be determined. “t” is calculated as 7, 7, 5 and 3 nm for UWPE/MWCNT, epoxy/MWCNT, PC/ABS/MWCNT and PVC/MWCNT nanocomposites, respectively. These results indicate that the interphase forms in the reported samples. Therefore, the interphase regions commonly affect the percolation level in PCNT. The thickest interphase is observed in UWPE/MWCNT and epoxy/MWCNT samples, while the thinnest interphase as 3 nm is shown in PVC/MWCNT nanocomposite. The interphase thickness depends on the interfacial interaction/adhesion between the polymer matrix and the nanofiller.39,40 Indeed, stronger interfacial interaction/adhesion produces a thicker interphase in nanocomposites.The conductivity of reported nanocomposites at different filler concentrations can be calculated by the two-step model at σf = 105 S m−1 and z = 1 nm. Fig. 7 illustrates the experimental results and the calculations for the reported samples. A good agreement is observed between the experimental and the theoretical data, which confirm the two-step model. It is stated that the two-step model can predict the conductivity of PCNT assuming CNT dimensions, interphase thickness, waviness and tunneling regions. The values of tunneling distance (d) are calculated as 0.75, 2, 1.8 and 2.1 nm for UWPE/MWCNT, epoxy/MWCNT, PC/ABS/MWCNT and PVC/MWCNT nanocomposites, respectively. These outputs demonstrate the presence of tunneling regions in the studied samples influencing the conductivity. The shortest and the largest tunneling distance are observed in UWPE/MWCNT and PVC/MWCNT samples, respectively. Moreover, the interphase conduction (σi) is obtained as 5.5 × 10⁴, 3 × 10⁴, 4 × 10⁴ and 2.8 × 10⁴ S m−1 for UWPE/MWCNT, epoxy/MWCNT, PC/ABS/MWCNT and PVC/MWCNT nanocomposites, respectively. The highest interphase conduction is observed in UWPE/MWCNT, while PVC/MWCNT sample shows the least level for “σi”. The UWPE/MWCNT sample exhibits the highest conductivity at low filler concentrations (see Fig. 7a). On the other hand, PVC/MWCNT shows the poorest conductivity among the reported samples. As a result, the calculated values of “d” and “σi” for the reported samples are reasonable, because the tunneling and interphase regions surrounding CNT contributing to the conductive networks can improve the conductivity of PCNT. Conclusively, the two-step model can present the logical results for interphase and tunneling properties in PCNT.
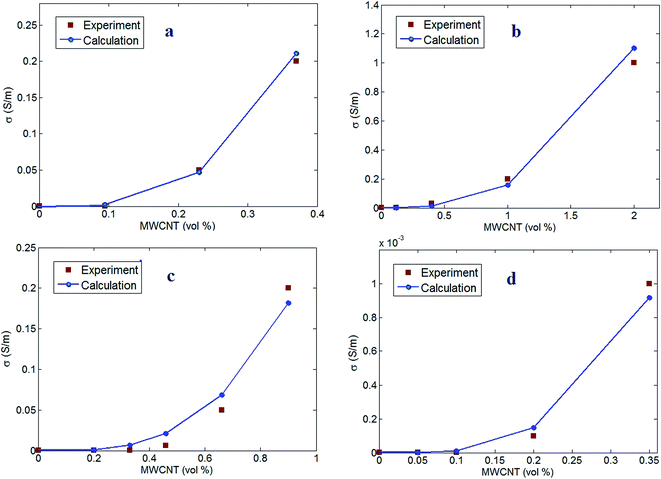 | ||
| Fig. 7 Experimental conductivity and predictions of two-step model for (a) UWPE/MWCNT,36 (b) epoxy/MWCNT,37 (c) PC/ABS/MWCNT34 and (d) PVC/MWCNT38 nanocomposites. | ||
4 Conclusions
A two-step model was suggested for conductivity of PCNT assuming the properties of CNT, tunneling and interphases regions. The experimental results and the significances of parameters on the conductivity of nanocomposites were applied to validate the two-step model. Thinner and longer CNT can cause a higher conductivity, while only thick CNT (R > 14 nm) can seriously minimize the conductivity. Hence, the role of CNT radius is more significant than that of CNT length. The high concentration of straight CNT can meaningfully raise the conductivity, but only a low concentration of CNT (straight or curved) causes an insulated nanocomposite. A thicker and more-conductive interphase produces a better conductivity, while thin and poor-conductive interphase cannot improve the conductivity. As a result, the strong interphase regions in PCNT are required to grow the conductivity. Additionally, a poor percolation threshold and a short tunneling distance enhance the conductivity. However, a large tunneling distance as a dominant factor significantly weakens the conductivity at different percolation levels. Also, the filler conduction and the percentage of CNT in the networks directly affect the conductivity of PCNT. The suggested equations for percolation threshold and conductivity demonstrate the presence of interphase and tunneling regions in the studied samples. The predictions show good agreement with the experimental data validating the developed equations.Conflicts of interest
There are no conflicts to declare.Acknowledgements
This research was supported by the Ministry of Trade, Industry & Energy (MOTIE), Korea Institute for Advancement of Technology (KIAT) and Ulsan Institute for Regional Program Evaluation (IRPE) through the Encouragement Program for the Industries of Economic Cooperation Region.References
- A. Rostami, M. Masoomi, M. J. Fayazi and M. Vahdati, Role of multiwalled carbon nanotubes (MWCNTs) on rheological, thermal and electrical properties of PC/ABS blend, RSC Adv., 2015, 5, 32880–32890 RSC.
- E. N. Zare, M. M. Lakouraj, S. Ghasemi and E. Moosavi, Emulsion polymerization for the fabrication of poly (o-phenylenediamine) multi-walled carbon nanotubes nanocomposites: characterization and their application in the corrosion protection of 316L SS, RSC Adv., 2015, 5, 68788–68795 RSC.
- S. V. Ebadi, A. Fakhrali, S. O. Ranaei-Siadat, A. A. Gharehaghaji, S. Mazinani, M. Dinari and J. Harati, Immobilization of acetylcholinesterase on electrospun poly (acrylic acid)/multi-walled carbon nanotube nanofibrous membranes, RSC Adv., 2015, 5, 42572–42579 RSC.
- J. Yang, Y. Zhang, Z. Wang and P. Chen, Influences of high aspect ratio carbon nanotube network on normal stress difference measurements and extrusion behaviors for isotactic polypropylene nanocomposite melts, RSC Adv., 2014, 4, 1246–1255 RSC.
- O. Zabihi, M. Ahmadi and M. Naebe, One-pot synthesis of aminated multi-walled carbon nanotube using thiol-ene click chemistry for improvement of epoxy nanocomposites properties, RSC Adv., 2015, 5, 98692–98699 RSC.
- M. Khodabandelou, M. K. R. Aghjeh and M. M. Mazidi, Fracture toughness and failure mechanisms in un-vulcanized and dynamically vulcanized PP/EPDM/MWCNT blend-nanocomposites, RSC Adv., 2015, 5, 70817–70831 RSC.
- Y. Zare and K. Y. Rhee, A simple methodology to predict the tunneling conductivity of polymer/CNT nanocomposites by the roles of tunneling distance, interphase and CNT waviness, RSC Adv., 2017, 7, 34912–34921 RSC.
- S. Kuester, G. M. Barra, J. C. Ferreira, B. G. Soares and N. R. Demarquette, Electromagnetic interference shielding and electrical properties of nanocomposites based on poly (styrene-b-ethylene-ran-butylene-b-styrene) and carbon nanotubes, Eur. Polym. J., 2016, 77, 43–53 CrossRef CAS.
- Y. Zare and K. Y. Rhee, Development of a conventional model to predict the electrical conductivity of polymer/carbon nanotubes nanocomposites by interphase, waviness and contact effects, Composites, Part A, 2017, 100, 305–312 CrossRef CAS.
- Y. Zare and K. Y. Rhee, Development of a model for electrical conductivity of polymer graphene nanocomposites assuming interphase and tunneling regions in conductive networks, Ind. Eng. Chem. Res., 2017, 56(32), 9107–9115 CrossRef CAS.
- Y. Zare and K. Y. Rhee, Accounting the reinforcing efficiency and percolating role of interphase regions in the tensile modulus of polymer/CNT nanocomposites, Eur. Polym. J., 2017, 87, 389–397 CrossRef CAS.
- Y. Zare, An approach to study the roles of percolation threshold and interphase in tensile modulus of polymer/clay nanocomposites, J. Colloid Interface Sci., 2017, 486, 249–254 CrossRef CAS PubMed.
- N. Ryvkina, I. Tchmutin, J. Vilčáková, M. Pelíšková and P. Sáha, The deformation behavior of conductivity in composites where charge carrier transport is by tunneling: theoretical modeling and experimental results, Synth. Met., 2005, 148, 141–146 CrossRef CAS.
- G. Ambrosetti, C. Grimaldi, I. Balberg, T. Maeder, A. Danani and P. Ryser, Solution of the tunneling-percolation problem in the nanocomposite regime, Phys. Rev. B: Condens. Matter Mater. Phys., 2010, 81, 155434 CrossRef.
- T. Takeda, Y. Shindo, Y. Kuronuma and F. Narita, Modeling and characterization of the electrical conductivity of carbon nanotube-based polymer composites, Polymer, 2011, 52, 3852–3856 CrossRef CAS.
- F. Deng and Q.-S. Zheng, An analytical model of effective electrical conductivity of carbon nanotube composites, Appl. Phys. Lett., 2008, 92, 071902 CrossRef.
- J. Li, P. C. Ma, W. S. Chow, C. K. To, B. Z. Tang and J. K. Kim, Correlations between percolation threshold, dispersion state, and aspect ratio of carbon nanotubes, Adv. Funct. Mater., 2007, 17, 3207–3215 CrossRef CAS.
- Y. Zare, “a” interfacial parameter in Nicolais–Narkis model for yield strength of polymer particulate nanocomposites as a function of material and interphase properties, J. Colloid Interface Sci., 2016, 470, 245–249 CrossRef CAS PubMed.
- Y. Zare, Modeling the yield strength of polymer nanocomposites based upon nanoparticle agglomeration and polymer–filler interphase, J. Colloid Interface Sci., 2016, 467, 165–169 CrossRef CAS PubMed.
- Y. Zare, The roles of nanoparticles accumulation and interphase properties in properties of polymer particulate nanocomposites by a multi-step methodology, Composites, Part A, 2016, 91, 127–132 CrossRef CAS.
- P. Jahanmard and A. Shojaei, Mechanical properties and structure of solvent processed novolac resin/layered silicate: development of interphase region, RSC Adv., 2015, 5, 80875–80883 RSC.
- Y. Zare and K. Y. Rhee, The mechanical behavior of CNT reinforced nanocomposites assuming imperfect interfacial bonding between matrix and nanoparticles and percolation of interphase regions, Compos. Sci. Technol., 2017, 144, 18–25 CrossRef CAS.
- Y. Zare, A Two-Step Method Based on Micromechanical Models to Predict the Young's Modulus of Polymer Nanocomposites, Macromol. Mater. Eng., 2016, 301, 846–852 CrossRef CAS.
- Y. Zare, K. Y. Rhee and D. Hui, Influences of nanoparticles aggregation/agglomeration on the interfacial/interphase and tensile properties of nanocomposites, Composites, Part B, 2017, 122, 41–46 CrossRef CAS.
- S. C. Baxter and C. T. Robinson, Pseudo-percolation: critical volume fractions and mechanical percolation in polymer nanocomposites, Compos. Sci. Technol., 2011, 71, 1273–1279 CrossRef CAS.
- R. Qiao and L. C. Brinson, Simulation of interphase percolation and gradients in polymer nanocomposites, Compos. Sci. Technol., 2009, 69, 491–499 CrossRef CAS.
- S. Kundalwal and M. Ray, Estimation of thermal conductivities of a novel fuzzy fiber reinforced composite, Int. J. Therm. Sci., 2014, 76, 90–100 CrossRef CAS.
- S. Kundalwal, R. S. Kumar and M. Ray, Effective thermal conductivities of a novel fuzzy carbon fiber heat exchanger containing wavy carbon nanotubes, Int. J. Heat Mass Transfer, 2014, 72, 440–451 CrossRef CAS.
- X. L. Ji, K. J. Jiao, W. Jiang and B. Z. Jiang, Tensile modulus of polymer nanocomposites, Polym. Eng. Sci., 2002, 42, 983 CAS.
- C. Feng and L. Jiang, Micromechanics modeling of the electrical conductivity of carbon nanotube (CNT)–polymer nanocomposites, Composites, Part A, 2013, 47, 143–149 CrossRef CAS.
- L. Berhan and A. Sastry, Modeling percolation in high-aspect-ratio fiber systems. I. Soft-core versus hard-core models, Phys. Rev. E: Stat., Nonlinear, Soft Matter Phys., 2007, 75, 041120 CrossRef CAS PubMed.
- G. D. Seidel and D. C. Lagoudas, A micromechanics model for the electrical conductivity of nanotube-polymer nanocomposites, J. Compos. Mater., 2009, 43, 917–941 CrossRef CAS.
- S. Maiti, S. Suin, N. K. Shrivastava and B. Khatua, Low percolation threshold in polycarbonate/multiwalled carbon nanotubes nanocomposites through melt blending with poly (butylene terephthalate), J. Appl. Polym. Sci., 2013, 130, 543–553 CrossRef CAS.
- S. Maiti, N. K. Shrivastava and B. Khatua, Reduction of percolation threshold through double percolation in melt-blended polycarbonate/acrylonitrile butadiene styrene/multiwall carbon nanotubes elastomer nanocomposites, Polym. Compos., 2013, 34, 570–579 CrossRef CAS.
- C. Li, E. T. Thostenson and T.-W. Chou, Dominant role of tunneling resistance in the electrical conductivity of carbon nanotube–based composites, Appl. Phys. Lett., 2007, 91, 223114 CrossRef.
- M. Lisunova, Y. P. Mamunya, N. Lebovka and A. Melezhyk, Percolation behaviour of ultrahigh molecular weight polyethylene/multi-walled carbon nanotubes composites, Eur. Polym. J., 2007, 43, 949–958 CrossRef CAS.
- Y. J. Kim, T. S. Shin, H. Do Choi, J. H. Kwon, Y.-C. Chung and H. G. Yoon, Electrical conductivity of chemically modified multiwalled carbon nanotube/epoxy composites, Carbon, 2005, 43, 23–30 CrossRef CAS.
- Y. Mamunya, A. Boudenne, N. Lebovka, L. Ibos, Y. Candau and M. Lisunova, Electrical and thermophysical behaviour of PVC-MWCNT nanocomposites, Compos. Sci. Technol., 2008, 68, 1981–1988 CrossRef CAS.
- Y. Zare, A model for tensile strength of polymer/clay nanocomposites assuming complete and incomplete interfacial adhesion between the polymer matrix and nanoparticles by the average normal stress in clay platelets, RSC Adv., 2016, 6, 57969–57976 RSC.
- Y. Zare and K. Y. Rhee, Development of Hashin-Shtrikman model to determine the roles and properties of interphases in clay/CaCO3/PP ternary nanocomposite, Appl. Clay Sci., 2017, 137, 176–182 CrossRef CAS.
| This journal is © The Royal Society of Chemistry 2017 |
