
 Open Access Article
 This Open Access Article is licensed under a
 Creative Commons Attribution 3.0 Unported Licence
Magnetic solid phase extraction based on graphene oxide/nanoscale zero-valent iron for the determination of tetracyclines in water and milk by using HPLC-MS/MS†
Dan Wei a,
Shuchao Wu*b and
Yan Zhu*a
a,
Shuchao Wu*b and
Yan Zhu*a
aDepartment of Chemistry, Zhejiang University, Xixi Campus, Hangzhou, China. E-mail: zhuyan@zju.edu.cn
bZhejiang Institute of Geology and Mineral Resources, Hangzhou, China. E-mail: wushch2002@163.com
First published on 15th September 2017
Abstract
A magnetic solid-phase extraction (MSPE) based on graphene oxide/nanoscale zero-valent iron (GO/nZVI) coupled with high performance liquid chromatography-tandem mass spectrometry (HPLC-MS/MS) was proposed for the determination of trace tetracycline antibiotics (TCs) in water and milk. GO covered nZVI was self-assembled by electrostatic forces by varying the pH. Several important parameters affecting the MSPE procedure have been investigated. The pH value is a key factor in the whole MSPE process. An appropriate pH can not only improve adsorption and desorption efficiency, but also enable the extraction of TCs from GO/nZVI by using deionized water. Optimal conditions were then used for the extraction of TCs from real samples, prior to HPLC-MS/MS determination in the positive ESI mode of multiple reaction monitoring (MRM) using a ZORBAX Eclipse Plus C18 column. The proposed method achieved low limits of quantitation in the range of 8.05–83.19 ng L−1 and 17.42–182.75 ng L−1 for water and milk samples, respectively, and satisfactory recoveries in the range of 84.2–105.5% with intra-day RSD in the range of 0.6–2.5% and inter-day RSD in the range of 1.2–9.2% for the spiked water sample and from 87.0% to 101.8% with intra-day RSD in the range of 1.1–5.4% and inter-day RSD in the range of 2.0–9.7% for the spiked milk sample.
1. Introduction
Tetracyclines (TCs) are broad-spectrum antibiotics against infections caused by Gram positive,1 Gram negative bacteria, chlamydia, mycoplasmas, rickettsiae and protozoan parasites.2,3 Accordingly, TCs have been widely used in human and veterinary medicine and have been reported as the most intensely used antibiotics in the European Union.4 However, improper use of TCs, especially when overused, may lead to unsafe residue levels in different animal tissues and animal-producing food intended for human consumption,5 which can produce a significant threat to human health, including allergic reactions, toxic effects, damage to the liver, yellowing of teeth and gastrointestinal disturbance. Besides, the release of animal excrement with excessive TC residues into the environment can also lead to water pollution and soil contamination.6 Therefore, it is particularly necessary to develop an effective and reliable analytical method for the determination of trace level TCs in complex matrices.During recent years, several analytical methods have been developed for the determination of veterinary drugs residues in different matrices, including chemiluminescence7,8 microbiological assays,9 capillary electrophoresis10 and high performance liquid chromatography (HPLC).11–13 HPLC with different detectors is the most commonly used techniques and has a great advantage in analyzing non-volatile and thermally labile compound.14–16 Analysis of TCs is performed mainly by HPLC with various detection techniques, including diode-array17 or single UV,18 electrochemical detection,19 fluorescence detection20,21 and mass spectrometric detection.22 Due to its high sensitivity and selectivity, HPLC coupled to mass spectrometry (MS) or tandem mass spectrometry (MS/MS)23,24 is becoming more commonly used in the analysis of TCs in very complex samples such as milk, waste water and animal tissues. MS detection with high sensitivity and accurate quantification is the method selected in this study. Because the sample matrices are complex and the concentration of target analytes is very low, direct analysis of sample is difficult and generally a sample processes are indispensable. Sample pretreatment techniques widely used for the isolation of TCs from milk and water samples include liquid–liquid extraction (LLE)25,26 and solid-phase extraction (SPE).27–29 Solid phase extraction is well developed sample pre-concentration technique in recent years with good merits such as simplicity, high sensitivity, low consumption of samples and reagent quantity. Recently, magnetic solid-phase extraction (MSPE) has received considerable attentions, a new mode of SPE, due to its excellent adsorption efficiency and rapid separation process as well as its potential applications in cell isolation, enzyme immobilization, protein separation and pre-concentration of organic compounds from large volume samples.30,31 Compared with SPE, the unique and attractive property of MSPE is that magnetic adsorbents can be isolated from sample solutions by the external magnetic field. Thus, suspended magnetic particles with the analytes can be removed from large volume samples by a magnet. The adsorbent materials of MSPE, commonly composed of magnetic inorganic materials and non-magnetic adsorbent materials, are not only a major contributor to the extraction efficiency but also affect the selectivity and sensitivity of the method.32
Recently, plenty of carbon-based nanomaterials, involving C18, fullerenes, carbon nanofibers, carbon nanotubes, and graphene (G), as well as their functionalized forms, have been investigated as adsorbent materials in MSPE procedures due to its high adsorption capacity for organic compounds.33,34 Among them, graphene oxide (GO), a free-standing two dimensional mono-layer sheet of carbon atoms with a honeycomb structure, has been considered as an excellent adsorbent for antibiotics such as tetracyclines due to its high specific surface area (2630 m2 g−1).35 In addition, GO are chemically stable enough, even with hydroxyl radicals, making GO composite with macroscopic structure a suitable candidate for long-lived recyclable adsorbents for the enrichment of carbon-based ring structures. However, due to its superb dispersibility in water, separating GO from the sample solution is always time-consuming because of their small sizes. The introduction of magnetic nanostructured materials into macroscopic composite can address this issue, because GO-based magnetic nanoparticles not only realize full potential of GO, but they also could make the utmost of the separation convenience of the magnetic materials.36 Up to now, there are few reports about MSPE of TCs using GO-based magnetic nanoparticles. The most commonly used perhaps being silica-coated magnetite (Fe3O4), which may be reliable stability in aqueous media and a large surface area.10,31 However, these methods either require complicated multi-step synthesis or have fussy operation and relatively strict conditions.
The aim of this study was to establish a simple method for preparing GO-based magnetic nanoparticles. GO-based magnetic nanoparticles, comprising graphene oxide/nanoscale zero-valent iron (GO/nZVI) could be readily attained and more easily separated via electrostatic interactions with appropriate adjustment of pH values. The newly proposed pH-responsive self-assembled GO/nZVI-based MSPE exhibits high removal efficiency, high reusability and easily separable. The experimental parameters affecting GO/nZVI-based MSPE process are studied in detail, and optimal experimental conditions are established. Finally, using new designed pH-responsive GO/nZVI as magnetic adsorbent, a rapid and sensitive MSPE-HPLC-MS/MS method was developed and successfully applied to determination of trace TCs in real milk and water samples.
2. Experimental
2.1. Reagents and materials
Graphene oxide (GO) with purity greater than 99% was obtained from Nanjing Xianfeng Nanomaterials Technology co., LTD (Nanjing, China). Zero-valent iron (nZVI) was supplied from Shenzhen micro-nano Science and Technology co., LTD (Shenzhen, China). Acetonitrile (ACN) and methanol (MeOH) with HPLC grade were obtained from Sigma-Aldrich (Shanghai, China). Dichloromethane (DCM) with analytical grade was supplied from Hangzhou Shuanglin Chemicals Corporation (Shanghai, China). Acetic acid (HAc) with analytical grade was obtained from Shanghai Lingfeng Organic Chemicals Co., Ltd. (Shanghai, China). Ammonium hydroxide (NH3·H2O), ammonium acetate (NH4Ac) and sodium chloride (NaCl) with analytical grade were obtained from Hangzhou Longshan Fine Chemicals Co., Ltd. (Hangzhou, China).4-Epitetracycline (ETC), oxytetracycline (OTC), tetracycline (TC), anhydrotetracycline (ATC), demeclocycline (DMC), and chlortetracycline (CTC), all with purity greater than 95%, were obtained from Sigma-Aldrich (Shanghai, China). The different standard solutions were prepared daily by dilution of a stock solution of each TC at a concentration of 1000 mg L−1, which were prepared by dissolving the pure substances in methanol. These solutions were refrigerated in the dark at 4 °C. Lower concentration standard solutions were prepared daily in the dark by appropriate dilutions using deionized water from their stock solutions.
The deionized water employed in all experiments was obtained from a Millipore-Milli-Q water system (Millipore, Milford, MA, USA), with resistivity not lower than 18.2 MΩ cm. GO solution at a concentration of 1 mg mL−1 was prepared by dispersing GO in deionized water with sonication for 15 min. All optimized studies were performed using the uncontaminated underground water samples spiked with 10 ng mL−1 of the six TCs, which were used as the fortified samples.
2.2. Samples and sample preparation
Two kinds of milk samples: a pasteurized whole milk sample and a skimmed milk sample (fat content <0.5% w/w) were supplied from local market (Hangzhou, China). Milk samples were kept at 4 °C until use. 10.0 mL milk sample was weighted into an Eppendorf vial (50 mL), and appropriate volumes of TCs standards were added to the vial. Then the sample was dissolved in 10 mL of 10 mmol L−1 NH4Ac. After centrifugation (10![[thin space (1/6-em)]](https://www.rsc.org/images/entities/char_2009.gif) 000 rpm, 5 min), the supernatant was adjusted to pH 7.0 with HAc and NH3·H2O.
000 rpm, 5 min), the supernatant was adjusted to pH 7.0 with HAc and NH3·H2O.
Four water samples: tap water, waste water, West Lake water and Qiantang River water were collected in Hangzhou, China. Each sample was filtered through a 0.45 μm membrane before analysis. Deionized water samples spiked with appropriate volumes of TCs stock solution were used for the method optimization and validation experiments.
2.3. Apparatus and chromatographic conditions
Fourier transform infrared (FT-IR) spectra (4000–500 cm−1) in KBr were recorded on a Tensor 27 spectrometer (Bruker, Germany). The morphological analysis of the magnetic adsorbents was performed using an S-4700 scanning electron microscope (SEM) instrument (Hitachi, Japan). The pH values were controlled with a Seven Easy S30 pH meter (Mettler Toledo Instruments Co. Ltd., Shanghai, China).The chromatographic analysis was performed on an Agilent 1290 infinity (Agilent, USA) equipped with an auto sampler controlled the gradient system. The analytical column was ZORBAX Eclipse Plus C18 (3.0 mm × 100 mm, 1.8 μm, Agilent, USA) operated at 35 °C; the mobile phase for the chromatographic separation was a mixture of A (100% ACN) and B (deionized water and 1% (v/v) HAc). Separation was performed in the following gradient conditions: 0 min, 10% A, to 30% A at 10 min, to 100% A at 11 min, to 10% A at 14 min and maintained for 3 min. Finally, the column was re-equilibrated for 5 min with the initial composition of the mobile phase.
Detection and quantification were carried out using 6460 Triple quadruple mass spectrometer equipped with ESI ion source (Agilent, USA). Data acquisition parameters (i.e. fragment voltage, collision energy) were optimized for each of TCs. Quantification of TCs was performed in the positive mode of multiple reaction monitoring (MRM). The temperature of the drying gas and sheath gas were 300 °C, 250 °C, respectively. The flow rate of the drying gas, sheath gas was 5 L min−1, 10 L min−1, respectively. A nebulizer pressure was set at 45 psi. Capillary voltage and nozzle voltage were set at 3500 V and 1000 V. The drying gas, sheath gas and nebulizer gas were high pure nitrogen.
2.4. Preparation of the magnetic adsorbent
The GO/nZVI particles were prepared according to the method reported by Liu et al. (2016).33 Briefly, nZVI was dissolved in 10 mL deionized water and sonicated for 15 min at 25 °C. When nZVI was dispersed in deionized water, the GO solution (1 mg mL−1) was added with vortex stirring for 30 s and the black magnetite precipitates were formed. Then, magnetite precipitates (GO/nZVI) was magnetically isolated and washed with deionized water twice in an ultrasonic bath, and the supernatant was discarded. After that, GO/nZVI was stored in deionized water at room temperature in the dark for further use.2.5. MSPE procedure
The MSPE procedure is shown in Fig. 1. The extraction method was performed as follows: firstly, 15 mg magnetic adsorbent GO/nZVI was added into a beaker. Then, 10 mL portion of the standard or sample solution containing 10 μg L−1 of ETC, OTC, TC, ATC, DMC, and CTC was transferred into a beaker. To avoid degradation of TCs and self-disassembly of GO/nZVI, the solution was adjusted pH to 4.0–7.0 by adding HAc and NH3·H2O. Subsequently, the solution was sonicated for 10 min to facilitate adsorption of the TCs onto the GO/nZVI. Then, the magnetic adsorbent was separated by using a magnet and the supernatants were decanted directly. 1 mL of NH3·H2O (pH 11) solution as eluent was added and sonicated for 5 min for desorption of TCs. Finally, desorption solution was evaporated to dryness under a mild nitrogen gas stream, and the dry residue was redissolved in 200 μL of ultrapure water. 10 μL of the solution was injected into the HPLC-MS system for subsequent analysis. | ||
| Fig. 1 Scheme illustration for preparation of GO/nZVI and the MSPE procedure. | ||
3. Results and discussion
3.1. Optimization of HPLC-MS/MS conditions
The development process of the HPLC-MS/MS method began with investigation of chromatographic separation, gradient elution and the effects of the ration and the composition of both solvent A and solvent B on chromatographic separation. The results indicated that mobile phase A (100% ACN), mobile phase B (water with 1% (v/v) HAc) are highly suitable as a mobile phase system for the separation of the TCs by gradient elution as follows: 0 min, 10% A, to 30% A at 10 min, to 100% A at 11 min, to 10% A at 14 min and maintained for 3 min. Then, the parameters for mass spectrometry optimization were investigated. Capillary, fragmenting voltage and collision energy were optimized to obtain the characteristic MRM ion pairs that could be used as the basis for quantitative analysis. MRM mode was determined by selecting the precursor ion m/z and one of its daughter ion m/z with high specificity and sensitivity as quantitative ion. Optimal fragmenting voltage and collision energies varied for each TC (Table 1). MRM spectra for the mixture of six TCs standard and fragmentation spectra with their product ions structures are shown in Fig. S1† and 2.| TCs | Structure | Precursor ion (m/z) | Daughter ions (m/z) | Retention time (min) | Fragmenting voltage (V) | Collision energy (V) | |
|---|---|---|---|---|---|---|---|
| Quantitative ion | Qualitative ion | ||||||
| ETC | 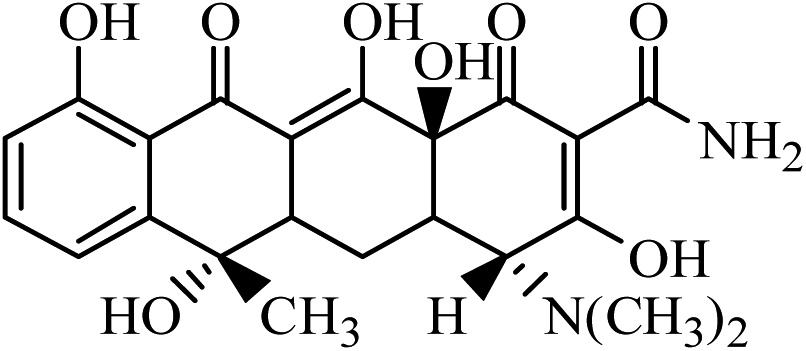 |
445 | 410 | 427 | 5.17 | 16 | 116 |
| OTC | 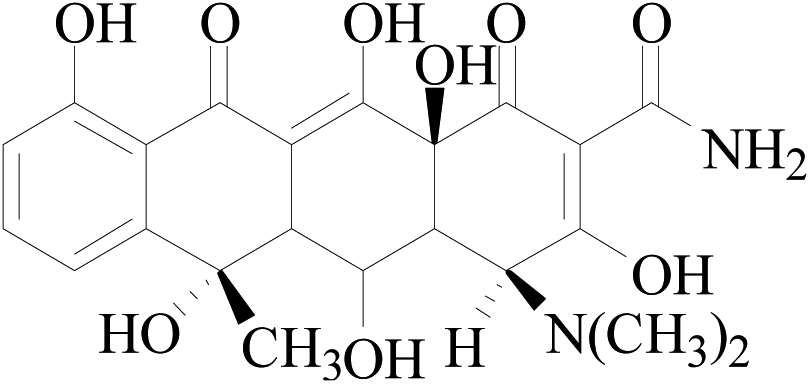 |
461 | 426 | 443 | 5.47 | 16 | 116 |
| TC |  |
445 | 410 | 427 | 6.19 | 16 | 116 |
| DMC | 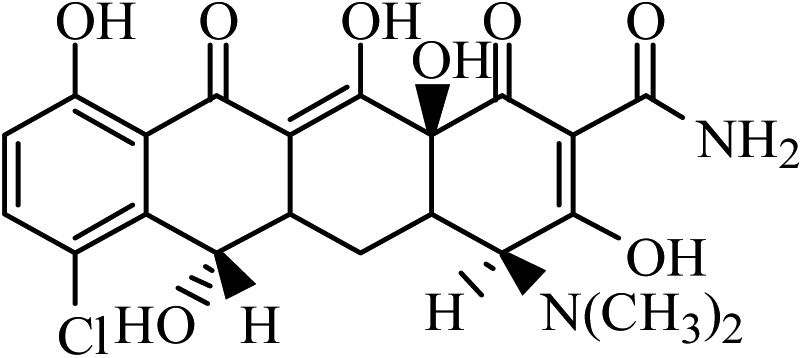 |
465 | 448 | 430 | 7.40 | 12 | 128 |
| CTC | 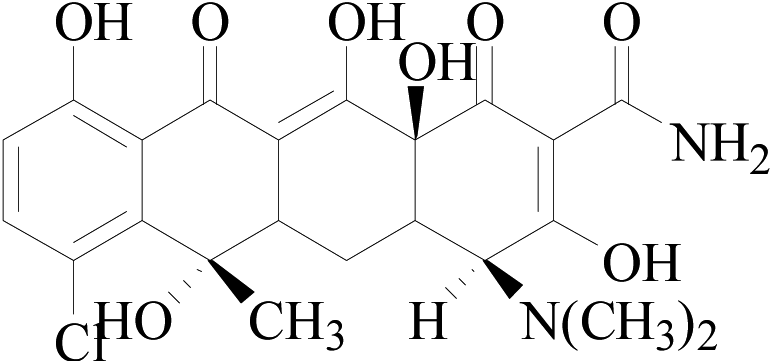 |
479 | 444 | 462 | 8.89 | 18 | 124 |
| ATC |  |
427 | 410 | 154 | 11.92 | 12 | 94 |
 | ||
| Fig. 2 Fragmentation spectra for (a) ETC, (b) OTC, (c) TC, (d) DMC, (e) CTC and (f) ATC standard at 50 μg L−1 in MRM mode. | ||
3.2. Characterization of GO/nZVI
The morphology of GO/nZVI was studied by SEM. GO/nZVI (previously dried at 100 °C, 24 h) was aggregated as clusters, forming a fluffy structure with an average diameter of about 100–500 nm (Fig. S2†). The SEM image of GO/nZVI was agreed with the reported method.33 Furthermore, the composition of GO/nZVI was examined by FT-IR. The characteristic absorption peaks of GO, that is, 1725 cm−1 (C![[double bond, length as m-dash]](https://www.rsc.org/images/entities/char_e001.gif) O), 1224 cm−1 (COC), and 1042 cm−1 (CO), were not observed in FT-IR spectrum (Fig. S3†), indicating GO well combined with nZVI.33
O), 1224 cm−1 (COC), and 1042 cm−1 (CO), were not observed in FT-IR spectrum (Fig. S3†), indicating GO well combined with nZVI.33
3.3. Optimization of magnetic solid-phase extraction procedure
In order to select the optimum magnetic solid phase extraction conditions for the extraction of the TCs, 10 mL of six TCs spiked sample at each concentration of 20.0 μg L−1 was used to study the extraction performance of the magnetic absorbent GO/nZVI under different experimental conditions. All of the experiments were performed in triplicate and the means of the results were used for optimization.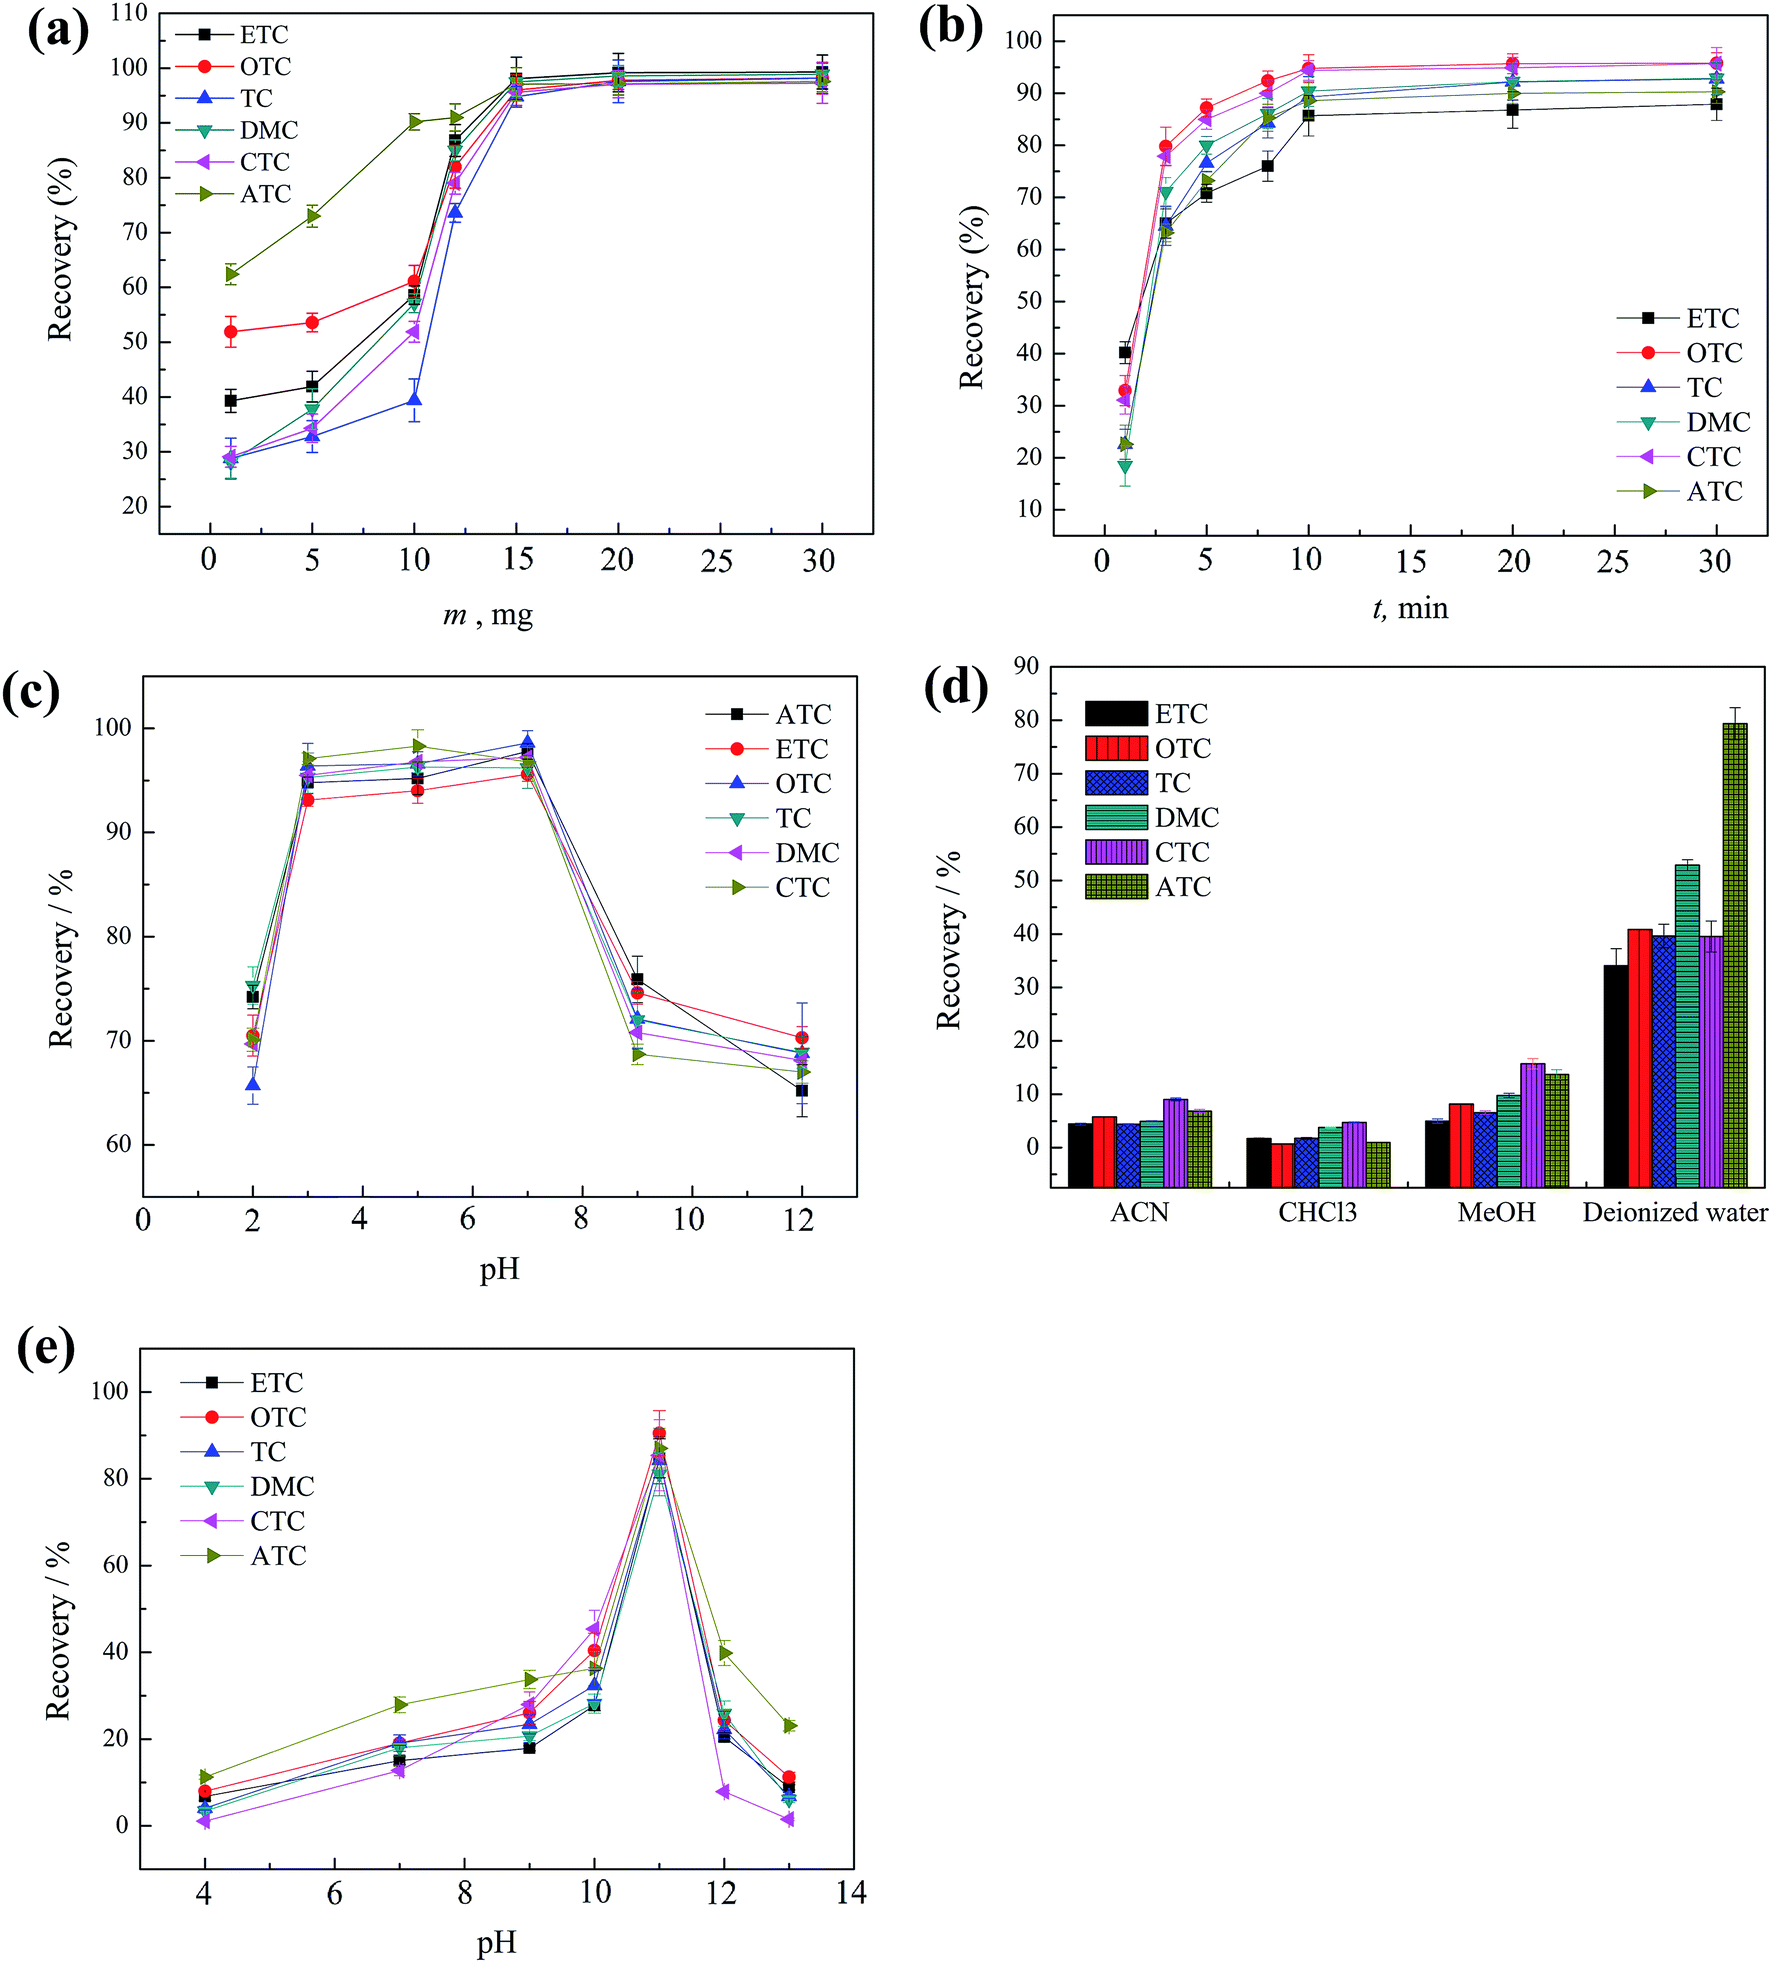 | ||
| Fig. 3 Optimization of the parameters influencing MSPE efficiency: (a) effect of GO/nZVI amount; (b) extraction time; (c) the sample pH; (d) the type of elution solvent; (e) the elution pH. | ||
An important effect of elution pH (4–13) on the recovery was also studied. As showed in Fig. 3e, slightly increased recoveries was observed by using deionized water with pH in the range of 9 to 11, slight decrease was observed with pH over 11. As a result, pH 11 was chosen to ensure sufficient desorption of the TCs.
Optimization of elution volume was studied in the range of 1.0 to 5.0 mL. As showed in Fig. 3f, the satisfactory recoveries were obtained using 1.0 mL of deionized water (pH 11). Thus, 1.0 mL was used in this study.
In order to speed up the transfer of TCs, GO/nZVI containing TCs was subjected to sonication during each elution step. The sonication time (1–10 min) was also examined. The results indicate that 5 min was enough for the TCs desorption. Finally, 5 min sonication time was adopted.
3.4. Reusability studies
One of key factors for evaluating the performance of the adsorbent was the regeneration of the magnetic materials. In order to investigate reusability of GO/nZVI sorbent, it was washed with ultrapure water and MeOH, and then reused for the extraction of TCs. The recovery decreased slightly after using more than ten times. It turned out that the GO/nZVI had an acceptable reusability without a significant loss of sorption capacity.3.5. Analytical performance of the method
To evaluate the proposed method, experiments with regard to the linearity, sensitivity (limit of detection (LOD) and quantification (LOQ)), matrix effect, accuracy, precision and selectivity were performed. To obtain the linearity of the method, the TCs-free samples spiked with each of the TCs at seven concentration levels (0.02–100.0 μg L−1) were prepared for the establishment of the calibration curve. The LOD and LOQ were calculated at a concentration at which signal-to-noise ratios are equal to 3 and 10, respectively. Six replicate MSPE and HPLC-MS determinations were performed for each level under the optimized experimental conditions. As shown in Table 2, good linearity was obtained in the range of 0.02–100 μg L−1 and 0.03–100 μg L−1 for water and milk samples, respectively. The LODs and LOQs for six TCs were found to be 2.44–25.21 ng L−1 and 5.28–55.38 ng L−1 for water samples, and 8.05–83.19 ng L−1 and 17.42–182.7 ng L−1 for milk samples respectively. The correlation coefficients were ranged from 0.9965 to 0.9993.| TCs | Water sample | Milk sample | ||||||||||
|---|---|---|---|---|---|---|---|---|---|---|---|---|
| Linear equation | R2 | RSD (%) | Linear range (μg L−1) | LOD (ng L−1) | LOQ (ng L−1) | Linear equation | R2 | RSD (%) | Linear range (μg L−1) | LOD (ng L−1) | LOQ (ng L−1) | |
| ETC | y = 26781.9x + 25238.9 |
0.9975 | 2.3 | 0.04–100 | 9.20 | 30.36 | y = 25696.1x + 22322.0 |
0.9965 | 3.2 | 0.06–100 | 16.56 | 54.65 |
| OTC | y = 26322.5x + 53807.5 |
0.9984 | 3.1 | 0.02–100 | 3.49 | 11.51 | y = 25943.2x + 51403.1 |
0.9974 | 3.0 | 0.03–100 | 5.28 | 17.42 |
| TC | y = 31525.8x + 12857.2 |
0.9993 | 2.1 | 0.02–100 | 4.78 | 15.77 | y = 29612.1x + 13345.2 |
0.9976 | 4.3 | 0.04–100 | 8.60 | 28.38 |
| DMC | y = 11614.6x − 372.3 |
0.9991 | 3.8 | 0.10–100 | 25.21 | 83.19 | y = 11239.0x − 317.3 |
0.9988 | 2.9 | 0.20–100 | 55.38 | 182.75 |
| CTC | y = 8760.0x + 2799.7 | 0.9993 | 1.9 | 0.30–100 | 20.98 | 69.23 | y = 8641.0x + 2662.2 | 0.9989 | 1.9 | 0.20–100 | 30.76 | 101.51 |
| ATC | y = 25278.8x + 30483.6 |
0.9967 | 4.8 | 0.02–100 | 2.44 | 8.05 | y = 25103.2x + 29370.0 |
0.9978 | 3.9 | 0.03–100 | 5.50 | 18.15 |
To evaluate the matrix effect, two types of calibration curves were developed: one with fortified matrix extracts (water sample and milk sample) and another without the matrix (using only standard solutions). For milk samples, the recoveries obtained from matrix matched calibration curves are slightly higher than those obtained using standard solutions. The results indicated a possible matrix effect. Thus, matrix-matched calibrations were established when analyzing real samples.
Accuracy was validated by the recovery test of the spiked water and milk samples at three concentration levels of the six TCs. Precision of the method was evaluated in terms of intra-day precision and inter-day precision, which expressed as RSD by analyzing the spiked samples under repeatability conditions. As shown in Table 3, it indicated that the recoveries are in the range of 84.2–105.5% with intra-day RSD in the range of 0.6–2.5% and inter-day RSD in the range of 1.2–9.2% for the water sample, and from 87.0% to 101.8% with intra-day RSD in the range of 1.1–5.4% and inter-day RSD in the range of 2.0–9.7% for the milk sample. The typical chromatograms of standard solution containing the six TCs, water and milk sample spiked with of the six TCs are illustrated in Fig. S4.†
| TCs | Water sample | Milk sample | ||||||
|---|---|---|---|---|---|---|---|---|
| Spiked levels (μg L−1) | Recovery (%) | Intra-RSD (%) (n = 5) | Inter-RSD (%) (n = 5) | Spiked levels (μg L−1) | Recovery (%) | Intra-RSD (%) (n = 5) | Inter-RSD (%) (n = 5) | |
| ETC | 0.5 | 96.0 | 1.8 | 1.2 | 0.5 | 95.0 | 3.1 | 4.8 |
| 10 | 101.6 | 0.9 | 4.6 | 10 | 96.5 | 1.2 | 9.7 | |
| 20 | 87.9 | 2.0 | 5.7 | 20 | 87.0 | 4.3 | 7.4 | |
| OTC | 0.5 | 96.0 | 0.9 | 9.2 | 0.5 | 101.0 | 3.2 | 5.1 |
| 10 | 88.2 | 1.9 | 5.3 | 10 | 90.1 | 5.4 | 9.0 | |
| 20 | 84.2 | 0.9 | 5.5 | 20 | 94.4 | 3.0 | 4.9 | |
| TC | 0.5 | 89.8 | 1.2 | 8.0 | 0.5 | 92.8 | 1.5 | 4.6 |
| 10 | 86.0 | 2.3 | 4.4 | 10 | 101.8 | 2.1 | 2.2 | |
| 20 | 104.6 | 1.1 | 6.8 | 20 | 87.6 | 3.9 | 7.5 | |
| DMC | 0.5 | 93.2 | 0.6 | 1.6 | 0.5 | 92.1 | 1.9 | 4.6 |
| 10 | 89.3 | 0.9 | 5.7 | 10 | 91.0 | 5.0 | 9.1 | |
| 20 | 95.4 | 1.8 | 5.2 | 20 | 100.1 | 1.5 | 2.0 | |
| CTC | 0.5 | 91.2 | 0.7 | 5.2 | 0.5 | 88.0 | 2.9 | 4.4 |
| 10 | 90.0 | 2.5 | 3.0 | 10 | 90.6 | 1.1 | 6.1 | |
| 20 | 102.0 | 1.1 | 6.2 | 20 | 87.2 | 4.0 | 5.4 | |
| ATC | 0.5 | 97.3 | 1.2 | 4.5 | 0.5 | 89.1 | 1.2 | 4.5 |
| 10 | 105.5 | 1.2 | 4.2 | 10 | 92.9 | 4.3 | 9.3 | |
| 20 | 97.3 | 1.1 | 5.4 | 20 | 91.2 | 1.9 | 4.2 | |
To estimate the selectivity of the method, which is the ability to distinguish between the TCs and other substances or interferences in the real samples, a serious of TCs-free water and milk samples were subjected to MSPE and HPLC-MS analysis. No interference peaks were observed within the retention time window for all the tested samples.
3.6. Application to real samples
Under the optimized conditions, the newly proposed GO/nZVI-based MSPE coupled with HPLC-MS/MS technique was applied for determination of the six target analytes (ETC, OTC, TC, ATC, DMC, and CTC) in four water samples (tap water, waste water, West Lake water and Qiantang River water collected from Hangzhou, China) and two kinds of milk samples (a pasteurized whole milk sample and a skimmed milk sample from local market in Hangzhou, China). The results showed that six TCs residue were not detected in any of these samples.3.7. Method comparison
The performance of the proposed method was compared with other reported methods for tetracycline residue detection in terms of detection techniques, linear range, LOD, recovery, and RSDs. The results were summarized in Table 4. As can be obviously seen from table, our newly developed MSPE method could achieve desirable recoveries and a wide linearity range, which were superior to or comparable with other listed methods. Moreover, by virtue of sensitive detection technique and effective extraction mode, our present method could provide a lower LODs and RSDs compared with other reported methods. Furthermore, the most previous reported methods employing SPE were more complicated than the present MSPE method. The adsorbents used directly or packed in SPE cartridges can also bring in an additional part of expense and extra risk of pollution to the environment. In addition to the common MSPE advantages of no need of additional centrifugation or filtration, the newly developed pH-responsive self-assembled MSPE procedure exhibits easy preparation, high extraction efficiency, easily separable and high reusability at low cost of toxic organic solvent by varying pH value of aqueous solution, which is economical and environment-friendly and makes it a promising method for analysis of water and milk samples with low concentration TCs residues. Therefore, the method developed in this study is sensitive, accuracy economical and environment-friendly for analysis of trace TCs.| Matrix | Extraction method | Detection | Linear range (μg L−1) | LOD (ng L−1) | Recovery (%) | RSDs (%) | Ref. |
|---|---|---|---|---|---|---|---|
| Milk and water | On-line SPE | HPLC-PAD | 5–1000 | 1500–8000 | 70.3–107.4 | 1.6–3.6 | 23 |
| Milk | SPE | HPLC-MS | 50–300 | 0.28–3.7 | >88.6 | 0.4–15.5 | 24 |
| Milk | SPE | HPLC-DAD | 60–500 | 20000 |
83.0–107 | 2.6–15.8 | 17 |
| Milk and water | Dispersive-SPME | HPLC-PAD | 20–400, 2–50 | 7900–20500, 700–3200 |
87.8–91.4, 97.0–106.6 | 2.0–4.9, 2.7–5.6 | 29 |
| Milk | MSPE | HPLC-UV | 30–600 | 10 | 91.0–97.0 | <5 | 31 |
| Milk | MSPE | CE | 4–250 | 2000–9000 | 94.2–99.8 | 0.6–3.3 | 10 |
| Water and milk | MSPE | HPLC-MS | 0.02–100, 0.03–100 | 2.44–25.21, 5.28–55.38 | 84.2–105.5, 87.0–101.8 | 0.6–2.5, 1.1–5.4 | This work |
4. Conclusion
In this study, the newly pH-responsive self-assembled MSPE method with HPLC-MS/MS in the ESI positive mode was applied to determination of six TCs from water and milk samples. With the appropriate adjustment of pH, the magnetic absorbent GO/nZVI can be self-assembled in the ultra water solution and showed high extraction efficiencies for TCs residues using the deionized water. Without use of organic extraction solvent, good linearities, low LOD, satisfactory spiked recoveries and high sensitivity was attained for the real samples. The proposed method can be used as a convenient and reliable method for the determination of trace TCs in water and milk samples.Conflicts of interest
The authors have declared no conflict of interest.Acknowledgements
This study was supported by National Science Foundation of China (21405141), Zhejiang Provincial Natural Science Foundation of China (No. LZ16B050001, LY15B050001, LY12B05003, LQ13B050001).References
- M. Seifrtova, L. Novakova, C. Lino, A. Pena and P. Solich, Anal. Chim. Acta, 2009, 649, 158–179 CrossRef CAS PubMed.
- H. R. Chen, T. Rairat, S. H. Loh, Y. C. Wu, T. W. Vickroy and C. C. Chou, PLoS One, 2017, 12, e0183087 Search PubMed.
- C. Q. Chen, L. Zheng, J. L. Zhou and H. Zhao, Sci. Total Environ., 2017, 580, 1175–1184 CrossRef CAS PubMed.
- N. Moeller, E. Mueller-Seitz, O. Scholz, W. Hillen, A. A. Bergwerff and M. Petz, Eur. Food Res. Technol., 2007, 224, 285–292 CrossRef CAS.
- W. Thanasarakhan, S. Kruanetr, R. L. Deming, B. Liawruangrath, S. Wangkarn and S. Liawruangrath, Talanta, 2011, 84, 1401–1409 CrossRef CAS PubMed.
- M. Kaczmarek, A. Idzikowska and S. Lis, J. Fluoresc., 2008, 18, 1193–1197 CrossRef CAS PubMed.
- M. Kaczmarek and S. Lis, Anal. Chim. Acta, 2009, 639, 96–100 CrossRef CAS PubMed.
- P. Anastasopoulos and M. Timotheou-Potamia, Anal. Lett., 2011, 44, 25–37 CrossRef CAS.
- S. Sczesny, H. Nau and G. Hamscher, J. Agric. Food Chem., 2003, 51, 697–703 CrossRef CAS PubMed.
- I. S. Ibarraa, J. A. Rodrigueza, J. M. Miranda, M. Vega and E. Barrado, J. Chromatogr. A, 2011, 1218, 2196–2202 CrossRef PubMed.
- Z. W. Zhang, X. W. Li, S. Y. Ding, H. Y. Jiang and J. Z. Shen, Food Chem., 2016, 204, 252–262 CrossRef CAS PubMed.
- V. G. Amelin and A. I. Korotkov, J. Anal. Chem., 2015, 70, 1383–1389 CrossRef CAS.
- X. L. Sun, X. W. He, Y. K. Zhang and L. X. Chen, Talanta, 2009, 79, 926–934 CrossRef CAS PubMed.
- E. Patyra, E. Kowalczyk and K. Kwiatek, Anal. Bioanal. Chem., 2013, 405, 6799–6806 CrossRef CAS PubMed.
- J. Kurittu, S. Lönberg, M. Virta and M. Karp, J. Agric. Food Chem., 2000, 48, 3372–3377 CrossRef CAS PubMed.
- U. Saha, A. K. Sen and T. K. Das, Talanta, 1990, 37, 1193–1196 CrossRef CAS PubMed.
- M. C. V. Mamani, F. G. R. Reyes and S. Rath, Food Chem., 2009, 117, 545–552 CrossRef CAS.
- Y. Shahbazi, F. Ahmadi and N. Karami, Food Agric. Immunol., 2015, 26, 821–834 CrossRef CAS.
- I. G. Casella and F. Picerno, J. Agric. Food Chem., 2009, 57, 8735–8741 CrossRef CAS PubMed.
- F. Y. Du, X. Zheng, L. Sun, Q. Qin, L. Guo and G. H. Ruan, J. Sep. Sci., 2015, 38, 3774–3780 CrossRef CAS PubMed.
- G. T. Peres, S. Rath and F. G. R. Reyes, Food Control, 2010, 21, 620–625 CrossRef CAS.
- M. Kanda, T. Kusano, T. Osanai, K. Ushiyama, K. Takeba, M. Sakamoto, H. Hayashi, K. Igusa, A. Ibe and T. Nagayama, Food Control, 2008, 49, 37–44 CAS.
- X. Q. Yang, C. X. Yang and X. P. Yan, J. Chromatogr. A, 2013, 1304, 28–33 CrossRef CAS PubMed.
- B. F. Spisso, M. A. G. de Araujo, M. A. Monteiro, A. M. B. Lima, M. U. Pereira, R. A. Luiz and A. W. da Nobrega, Anal. Chim. Acta, 2009, 656, 72–84 CrossRef CAS PubMed.
- P. Kowalski, J. Pharm. Biomed. Anal., 2008, 47, 487–493 CrossRef CAS PubMed.
- S. O. S. Mookantsa, S. Dube and M. M. Nindi, Talanta, 2016, 148, 321–328 CrossRef CAS PubMed.
- E. Karageorgou, V. Samanidou and I. Papadoyannis, J. Sep. Sci., 2012, 35, 2599–2607 CrossRef CAS PubMed.
- J. T. Li, L. G. Chen, X. Wang, H. Y. Jin, L. Ding, K. Zhang and H. Q. Zhang, Talanta, 2008, 75, 1245–1252 CrossRef CAS PubMed.
- W. H. Tsai, T. C. Huang, J. J. Huang, Y. H. Hsue and H. Y. Chuang, J. Chromatogr. A, 2009, 1216, 2263–2269 CrossRef CAS PubMed.
- K. Aguilar-Arteaga, J. A. Rodriguez, J. M. Miranda, J. Medina and E. Barrado, Talanta, 2010, 80, 1152–1157 CrossRef CAS PubMed.
- J. A. Rodriguez, J. Espinosa, K. Aguilar-Arteaga, I. S. Ibarra and J. M. Miranda, Microchim. Acta, 2010, 171, 407–413 CrossRef CAS.
- V. V. Tolmacheva, V. V. Apyari, A. A. Furletov, S. G. Dmitrienko and Y. A. Zolotov, Talanta, 2016, 152, 203–210 CrossRef CAS PubMed.
- W. P. Liu, J. Q. Ma, C. S. Shen, Y. Z. Wen and W. P. Liu, Water Res., 2016, 90, 24–33 CrossRef CAS PubMed.
- N. Li, J. Chen and Y. P. Shi, Talanta, 2015, 141, 212–219 CrossRef CAS PubMed.
- E. E. Ghadim, F. Manouchehri, G. Soleimani, H. Hosseini, S. Kimiagar and S. Nafisi, PLoS One, 2013, 8, e79254 Search PubMed.
- X. K. Zeng, D. T. McCarthy, A. Deletic and X. W. Zhang, Adv. Funct. Mater., 2015, 25, 4344–4351 CrossRef CAS.
Footnote |
| † Electronic supplementary information (ESI) available. See DOI: 10.1039/c7ra08203g |
| This journal is © The Royal Society of Chemistry 2017 |