 Open Access Article
Large magnetocaloric effect and critical behavior in La0.7Ba0.2Ca0.1Mn1−xAlxO3
M. A. Zaidi *a,
J. Dhahri
 b,
I. Zeydic,
T. Alharbia and
H. Belmabrouka
aCollege of Science of Zulfi, Majmaah University Saudi Arabia, Saudi Arabia. E-mail: mohamedzaidi215@yahoo.com
bLaboratory of Condensed Matter and Nanoscience, Faculty of Sciences of Monastir, University of Monastir, 5019, Tunisia
cUniversité De Monastir, Laboratoire de Micro-optoélectroniques et Nanostructures (LMON), Monastir 5000, Tunisia
First published on 11th September 2017
Abstract
The structural, magnetic and magnetocaloric properties of La0.7Ba0.2Ca0.1Mn1−xAlxO3 (0 ≤ x ≤ 0.1) perovskite manganite oxides have been investigated. X-ray diffraction (XRD) analysis using Rietveld refinement has shown that all of the samples under investigation crystallize with a rhombohedric structure in the R![[3 with combining macron]](https://www.rsc.org/images/entities/char_0033_0304.gif) c space group (N°167). Paramagnetic (PM) to ferromagnetic (FM) transitions have been observed in all of the synthesized samples. In addition, the maximum magnetic entropy change (ΔSmaxM) for the x = 0 sample was found to reach ∼5.8 J kg−1 K−1 under an applied magnetic field of 5 T, which is sufficient for potential applications in magnetic refrigeration. For the same applied magnetic field (μ0H = 5 T), the relative cooling power (RCP) value is found to be 167 J kg−1. The critical properties of manganites La0.7Ba0.2Ca0.1Mn1−xAlxO3 (0 ≤ x ≤ 0.1) are investigated through various techniques, such as modified Arrott plots, Kouvel–Fisher methods and critical isotherm analyses around the paramagnetic–ferromagnetic phase transition (Tc). The values of critical exponents, derived from magnetic data using the above methods, yield 0.246 ≤ β ≤ 0.253, 1.01 ≤ γ ≤ 1.12 and 4.76 ≤ δ ≤ 4.9 with a Tc of 300–350 K. The exponent values are close to those expected for tricritical mean field model ferromagnets with short-range dipole–dipole interactions.
c space group (N°167). Paramagnetic (PM) to ferromagnetic (FM) transitions have been observed in all of the synthesized samples. In addition, the maximum magnetic entropy change (ΔSmaxM) for the x = 0 sample was found to reach ∼5.8 J kg−1 K−1 under an applied magnetic field of 5 T, which is sufficient for potential applications in magnetic refrigeration. For the same applied magnetic field (μ0H = 5 T), the relative cooling power (RCP) value is found to be 167 J kg−1. The critical properties of manganites La0.7Ba0.2Ca0.1Mn1−xAlxO3 (0 ≤ x ≤ 0.1) are investigated through various techniques, such as modified Arrott plots, Kouvel–Fisher methods and critical isotherm analyses around the paramagnetic–ferromagnetic phase transition (Tc). The values of critical exponents, derived from magnetic data using the above methods, yield 0.246 ≤ β ≤ 0.253, 1.01 ≤ γ ≤ 1.12 and 4.76 ≤ δ ≤ 4.9 with a Tc of 300–350 K. The exponent values are close to those expected for tricritical mean field model ferromagnets with short-range dipole–dipole interactions.
Introduction
The discovery of colossal magnetic resistance (CMR) and the magnetocaloric effect (MCE) in mixed-valency manganese oxides Tr1−xMxMnO3 (where Tr stands for a trivalent rare-earth element such as Sm, Pr, La, Nd, etc., and M for a divalent alkaline earth ion such as Ba, Ca, Pb and Sr) close to their paramagnetic semiconductor (PM-Sc) to ferromagnetic metal (FMM) transition temperatures has attracted much attention due to their extraordinary magnetic and electronic properties as well as their promise for the potential technological applications.1,2 The parent compound, TrMnO3 is a charge-transfer (CT) insulator with trivalent manganese ions in different layers coupled antiferromagnetically among themselves through a superexchange mechanism. However, within a layer, these Mn3+ ions are coupled ferromagnetically. When the Tr trivalent element is doped by various elements, a proportionate amount of Mn3+ with the electronic configuration (3d4, t32g↑ e1g↑, S = 2), is replaced by Mn4+ with the electronic configuration (3d3, t32g↑ e0g, S = 3/2) creating holes in the eg band.3 The holes permit charge transfer in the eg state which is highly hybridized with the oxygen 2p state. Due to the intra-atomic Hund's rule, this charge transfer induces a ferromagnetic coupling between Mn3+ and Mn4+ ions which in turn has a dramatic effect on the electrical conductivity.4,5 This double-exchange (DE) model originally proposed by Zener6 has been the most prominent underlying physics that describes the simultaneous occurrence of transition from paramagnetic semiconductor to ferromagnetic metal for most hole-doped manganites. The perovskite structure generally shows lattice distortion as a modification from the idea cubic structure to orthorhombic or rhombohedric structure mainly due to Jahn–Teller (JT) effect causing the deformation of the MnO6 octahedron. Therefore, to understand better the relation between semiconductor–metal transition and CMR effect, two important questions about PM–FM transition should be clarified: one is the order of phase transition; the other is the common universality class. To make these issues clear, it is necessary to investigate in details the critical exponents at the region of the PM–FM transition. The analysis of the critical exponents in the vicinity of the magnetic phase transition is a powerful tool to investigate in details the mechanisms of the magnetic interaction responsible for the transition7,8 in earlier theoretical works, the critical behaviour related to the PM to FM transition in manganites within the double exchange (DE) model was described in the framework of long range mean field theory.9 However, recent theoretical calculations have predicted that the critical exponents in manganites are in agreement with a short range exchange interaction model.10,11 Claiming the essential validity of the DE model, Motome and Furukawa12 argue, based on computational studies for DE models, that the PM–FM transition in these doped ferromagnetic manganites should belong to the short-range Heisenberg universality class.12,13 Moreover, a few relevant experimental investigations on the critical phenomena also supported this viewpoint due to the obtained value of the critical exponents consistently with that in the conventional ferromagnet of 3D-Heisenberg model. Ghosh et al.14 reported that the calculated values of the critical exponent β (=0.37) for La0.7Sr0.3MnO3 (β = 0.365 in Heisenberg model). However, a relative high value of β = 0.5 obtained in La0.8Sr0.2MnO3 is in good agreement with that in mean-field model.15 In the contrary, a very low critical exponent of β = 0.14 identified in the single crystal La0.7Ca0.3MnO3 suggested that the PM–FM transition in this system is of first order rather than second order.16 Therefore, in view of the varied critical exponent β from 0.1 to 0.5, currently, four kinds of different theoretical models, mean-field (β = 0.5), 3D-Heisenberg (β = 0.365), 3D-Ising (β = 0.325) and tricritical mean field (β = 0.25) were used to explain the critical properties in manganites. Due to the divergence in these reported critical values, it is worthwhile to study the critical behavior in the same perovskite manganites. Due to the divergence in these reported critical values, it is worthwhile to study the critical behavior in the same perovskite manganites. In this paper, we present a detailed study of structural, magnetic, magnetocaloric and the critical phenomena in La0.7Ba0.2Ca0.1Mn1−xAlxO3 (0 ≤ x ≤ 0.1), using the isothermal magnetization around Tc.Experiment
The doped perovskite manganites La0.7Ba0.2Ca0.1Mn1−xAlxO3 (0 ≤ x ≤ 0.1) were prepared by sol–gel technique using metal nitrates as starting materials. In this method, the stoichiometric amounts of metal nitrates in the form of solution were converted into citrates and pH was adjusted between 6.5 and 7. After getting a sol on slow evaporation, a gelating reagent, ethylene glycol was added and heated between 150 °C and 180 °C to get a gel. This solution on further heating yields a dry fluffy porous mass, which was calcined at 650 °C for 10 h. Then the powder was pressed into pellets and finally sintered in air at 900 °C for 12 h.The structure and purity phase of the samples were checked at room temperature by means of X-ray powder diffraction (XRD) using CuKα radiation (λ = 1.5406 Å). The data collection was performed by step-scan modes, in a 2θ range between 20° and 92° with step-size of 0.017° and step time of 18 s. The structural parameters were obtained by fitting the experimental data of XRD using the Rietveld structural refinement program FULLPROF soft-ware (Version 1.9c-May 2001-LLB-JRC).17 Magnetic measurements were performed by using BS1 and BS2 magnetometer developed in Louis Neel Laboratory at Grenoble. Magnetization (M) vs. magnetic field (μ0H), varying from 0 to 5 T at different temperatures (T), was measured by magnetometer. For the studies, the isothermal M vs. μ0H is corrected by a standard procedure from low field dc magnetization measurements. In fact, the internal field used for the scaling analysis has been corrected for demagnetization, μ0H = μ0Happl − DaM, where Da is the demagnetization factor obtained from M vs. H measurements in the low-field linear-response regime at a low temperature.
Results and discussion
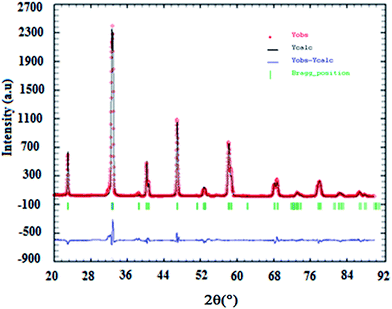
The results of X-ray diffraction indicate that all samples are single-phase perovskite manganites. Fig. 1 presents the X-ray pattern of x = 0. Formation of single phase was confirmed by absence of characteristic XRD lines of constituent oxides or the other phases in the powder X-ray diffraction patterns for all compositions, within the sensitivity limits of the experiment (a few percent). The crystal structure of La0.7Ba0.2Ca0.1Mn1−xAlxO3 (0 ≤ x ≤ 0.1) samples is determined to be rhombohedral structure with the R![[3 with combining macron]](https://www.rsc.org/images/entities/char_0033_0304.gif) c space group, hexagonal setting (z = 6). The (La/Ba/Ca) atoms are at 6a(0, 0, 1/4), (Mn/Al) at 6b(0, 0, 0) and O at 18e(x, 0, 1/4) positions. The results of refinement are listed in Table 1. In this table, the residuals for the weighted pattern Rwp, the pattern Rp, the structure factor RF, and the goodness of fit χ2 are also reported. The decreasing in the lattice constant and the unit cell volume can be related to the smaller ionic radius of Al ion (rAl3+ = 0.535 Å and rMn3+ = 0.645 Å (ref. 18)). This was confirmed by the determination by Rietveld refinement of (Mn/Al)–O distance calculated from the structural parameters (see Table 1).
c space group, hexagonal setting (z = 6). The (La/Ba/Ca) atoms are at 6a(0, 0, 1/4), (Mn/Al) at 6b(0, 0, 0) and O at 18e(x, 0, 1/4) positions. The results of refinement are listed in Table 1. In this table, the residuals for the weighted pattern Rwp, the pattern Rp, the structure factor RF, and the goodness of fit χ2 are also reported. The decreasing in the lattice constant and the unit cell volume can be related to the smaller ionic radius of Al ion (rAl3+ = 0.535 Å and rMn3+ = 0.645 Å (ref. 18)). This was confirmed by the determination by Rietveld refinement of (Mn/Al)–O distance calculated from the structural parameters (see Table 1).
| Samples | |||
|---|---|---|---|
| x | 0.0 | 0.05 | 0.10 |
| a Weight fraction resulting from the Rietveld analysis is expressed in percent of La0.7Ba0.2Ca0.1Mn1−xAlxO3. a and c: hexagonal cell parameters; V: cell volume; Biso: isotropic thermal parameter; x: oxygen position; Rwp, Rp and RF: the residuals for, respectively, the weighted pattern, the pattern and the Bragg structure factor; χ2: the goodness of fit. | |||
R![[3 with combining macron]](https://www.rsc.org/images/entities/b_char_0033_0304.gif) c phase c phase |
|||
| a (Å) | 5.5078(4) | 5.5012(5) | 5.4966(7) |
| c (Å) | 13.4645(9) | 13.4641(4) | 13.4628(4) |
| V (Å3) | 353.73 | 352.87 | 352.25 |
| Biso (La/Pb/Na) (Å2) | 0.28(4) | 0.35(2) | 0.68(5) |
| x (O) | 0.4974(3) | 0.4562(2) | 0.4368(1) |
| Biso(O) (Å2) | 0.84(4) | 0.96(3) | 1.21(1) |
| dMn–O (Å) | 1.948 | 1.952 | 1.955 |
| θMn–O–Mn (°) | 165.27 | 162.88 | 161.45 |
| SG (nm) | 65 | 43 | 39 |
| DMEB (nm) | 107 | 91 | 68 |
| t | 0.942 | 0.945 | 0.957 |
| W (10−2) | 9.61 | 9.52 | 9.44 |
![[thin space (1/6-em)]](https://www.rsc.org/images/entities/char_2009.gif) |
|||
| Discrepancy factors | |||
| Rwp (%) | 6.41 | 4.93 | 2.38 |
| Rp (%) | 4.21 | 2.28 | 3.82 |
| RF (%) | 3.18 | 2.38 | 3.12 |
| χ2 (%) | 2.47 | 2.08 | 2.27 |
The tilting of the octahedra can also be realized looking the Goldschmidt tolerance factor (t),  where rA and rB are average ionic radii of A- and B-site atoms and rO is the ionic radii of O2−. Oxide based manganite compounds have a perovskite structure if their tolerance factor lies in the limits of 0.75 < t < 1 and in an ideal case the value must be equal to unity. As the calculated values of all the samples of the present investigation are within range (Table 1), one may conclude that they might be having a stable perovskite structure. The rhombohedral distortion may be viewed as a rotation of the octahedral around the three-fold axis by an angle ω from the ideal perovskite position. This rotation describes the buckling of the MnO6 octahedra caused by ionic radii mismatch between A and B cations. The angle of rotation ω may be calculated from the oxygen position using ω = arctan(√3 − x√12).19 The values obtained are 7.52, 8.61 and 9.84 for x = 0, 0.05 and 0.10, respectively, indicating large distortions for all the compositions. For regular Mn coordination octahedra the relation between ω and superexchange (Mn, Al)–O–(Mn, Al) bond angle is given by cos
![[thin space (1/6-em)]](https://www.rsc.org/images/entities/char_2009.gif) θ = (1 − 4
θ = (1 − 4![[thin space (1/6-em)]](https://www.rsc.org/images/entities/char_2009.gif) cos2
cos2![[thin space (1/6-em)]](https://www.rsc.org/images/entities/char_2009.gif) ω)/3.20 Using the values of ω, we obtain a reasonable agreement with that obtained from refinement (Table 1). The departure from 180° of (Mn, Al)–O–(Mn, Al) angle is a measure of the distortion. The variations of the bond length d(Mn/Al)–O and of bond angle (Mn/Al)–O–(Mn/Al) have opposite effects on the unit-cell volume. For a distorted perovskite, they are related by;21 V = z[2d(Mn,Al)–O
ω)/3.20 Using the values of ω, we obtain a reasonable agreement with that obtained from refinement (Table 1). The departure from 180° of (Mn, Al)–O–(Mn, Al) angle is a measure of the distortion. The variations of the bond length d(Mn/Al)–O and of bond angle (Mn/Al)–O–(Mn/Al) have opposite effects on the unit-cell volume. For a distorted perovskite, they are related by;21 V = z[2d(Mn,Al)–O![[thin space (1/6-em)]](https://www.rsc.org/images/entities/char_2009.gif) cos
cos![[thin space (1/6-em)]](https://www.rsc.org/images/entities/char_2009.gif) ω]3 where ω = π − θ(Mn,Al)–O–(Mn,Al)/2 and z is the number of formula units in the unit cell (z = 6 in our case). The functional dependence of volume as a function of concentration x of Al is reproduced using the observed values of d(Mn,Al)–O and θMn–Al–O–Mn–Al in the above expression.
ω]3 where ω = π − θ(Mn,Al)–O–(Mn,Al)/2 and z is the number of formula units in the unit cell (z = 6 in our case). The functional dependence of volume as a function of concentration x of Al is reproduced using the observed values of d(Mn,Al)–O and θMn–Al–O–Mn–Al in the above expression.
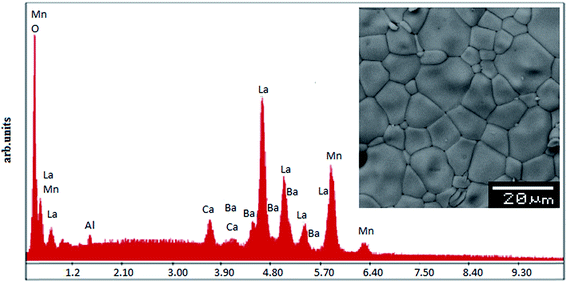
In order to check the existence of all elements in the compounds energy dispersive X-ray analysis was performed. The EDX spectra represented in Fig. 2 reveals the presence of La, Ba, Ca, Mn and Al, which confirms that there is no loss of any integrated element during the sintering. The EDX analysis shows that the chemical compositions of these compounds are close to the nominal ones (La![[thin space (1/6-em)]](https://www.rsc.org/images/entities/char_2009.gif) :
:![[thin space (1/6-em)]](https://www.rsc.org/images/entities/char_2009.gif) Ba
Ba![[thin space (1/6-em)]](https://www.rsc.org/images/entities/char_2009.gif) :
:![[thin space (1/6-em)]](https://www.rsc.org/images/entities/char_2009.gif) Ca
Ca![[thin space (1/6-em)]](https://www.rsc.org/images/entities/char_2009.gif) :
:![[thin space (1/6-em)]](https://www.rsc.org/images/entities/char_2009.gif) Mn
Mn![[thin space (1/6-em)]](https://www.rsc.org/images/entities/char_2009.gif) :
:![[thin space (1/6-em)]](https://www.rsc.org/images/entities/char_2009.gif) Al = 0.7
Al = 0.7![[thin space (1/6-em)]](https://www.rsc.org/images/entities/char_2009.gif) :
:![[thin space (1/6-em)]](https://www.rsc.org/images/entities/char_2009.gif) 0.2
0.2![[thin space (1/6-em)]](https://www.rsc.org/images/entities/char_2009.gif) :
:![[thin space (1/6-em)]](https://www.rsc.org/images/entities/char_2009.gif) 0.1
0.1![[thin space (1/6-em)]](https://www.rsc.org/images/entities/char_2009.gif) :
:![[thin space (1/6-em)]](https://www.rsc.org/images/entities/char_2009.gif) 1 − x
1 − x![[thin space (1/6-em)]](https://www.rsc.org/images/entities/char_2009.gif) :
:![[thin space (1/6-em)]](https://www.rsc.org/images/entities/char_2009.gif) x). The typical cationic composition for the samples is represented in Table 2. These results are very close to the nominal ones within the experimental uncertainties and, since no secondary phases are seen in the XRD patterns, it is reasonable to assume that aluminium has been substituted for Mn in these samples. The inset of Fig. 2 shows the scanning electron microscopy (SEM) photograph for the La0.7Ba0.2Ca0.1Mn1−xAlxO3 (0 ≤ x ≤ 0.1) samples. The average calculated crystallite size value is given in Table 1. Obviously, the particle sizes DMEB observed by SEM are much larger than those calculated SG (nm) by XRD, which indicates that each particle observed by SEM consists of several crystallites.
x). The typical cationic composition for the samples is represented in Table 2. These results are very close to the nominal ones within the experimental uncertainties and, since no secondary phases are seen in the XRD patterns, it is reasonable to assume that aluminium has been substituted for Mn in these samples. The inset of Fig. 2 shows the scanning electron microscopy (SEM) photograph for the La0.7Ba0.2Ca0.1Mn1−xAlxO3 (0 ≤ x ≤ 0.1) samples. The average calculated crystallite size value is given in Table 1. Obviously, the particle sizes DMEB observed by SEM are much larger than those calculated SG (nm) by XRD, which indicates that each particle observed by SEM consists of several crystallites.
| Composition | Typical cationic composition from EDX | Nominal composition | ||||
|---|---|---|---|---|---|---|
| La | Ba | Ca | Mn | Al | ||
| x = 0.00 | 0.695 | 0.202 | 0.098 | 1.007 | — | La0.7Ba0.2Ca0.1MnO3 |
| x = 0.05 | 0.696 | 0.198 | 0.096 | 0.952 | 0.051 | La0.7Ba0.2Ca0.1Mn0.95Al0.05O3 |
| x = 0.10 | 0.698 | 0.203 | 0.101 | 0.899 | 0.103 | La0.7Ba0.2Ca0.1Mn0.9Al0.1O3 |
In order to study the aluminum effect on the magnetic properties, magnetization variation vs. temperature under an applied magnetic field of 0.05 T is measured and reported in Fig. 3. This curves reveal that all samples exhibit a ferromagnetic–paramagnetic transition occurring at the Curie temperature (TC) when increasing temperature. The evolution of dM/dT versus temperature (T) is reported in the inset of Fig. 3. The values of the Curie temperature TC decreases from 350 K to 300 K when the continent x increases. Similar to the previous studies,22,23 an x increase in La0.7Ba0.2Ca0.1Mn1−xAlxO3 decreases gradually the TC towards room temperature. This is due to a decrease in the ferromagnetic phase which could be explained as follows. An x increase introduces more Mn4+ ions and disadvantages the dual FM double-exchange interactions of Mn4+–Mn3+ pairs. Meanwhile, antiferromagnetic superexchange interactions of Mn4+–Mn4+ are significant.
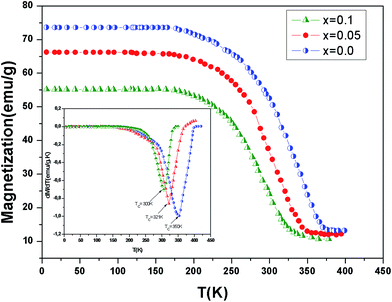 | ||
| Fig. 3 Temperature dependence of magnetization for La0.7Ba0.2Ca0.1Mn1−xAlxO3 (0 ≤ x ≤ 0.1) samples measured at μ0H = 0.05 T. The inset shows the dM/dT curves for x = 0.0, 0.05 and x = 0.10. | ||
Based on the model of double exchange, a lower TC corresponds to a poor overlap between Mn 3d and O 2p orbitals, resulting in a reduced bandwidth  ,24 where θMn/Al–O–Mn/Al is the angle and dMn/Al–O is the bond length. The increase of the Mn/Al–O bond length reduces the overlap between Mn(3d) and O(2p) orbital's and leads to the decrease of W (Table 1), which results in the decrease of Curie temperature.
In the paramagnetic region, the susceptibility (χ) follows the Curie–Weiss law and can be then written:  , where C is the Curie constant and θCW is the Curie–Weiss temperature. By fitting the linear paramagnetic region to the Curie–Weiss equation, parameters C and θCW were obtained. The effective paramagnetic moments were calculated from the Curie constant using the equation
  ,25 where NA = 6.023 × 10²³ mol−1 is the number of Avogadro, μB = 9.274 × 10⁻²¹ emu is the Bohr magneton and kB = 1.38016 × 10⁻¹⁶ erg K−1 is the Boltzmann constant. For Mn3+ or Mn4+, the orbital moment is quenched (L = 0) so that S is the appropriate quantum number and we can write
  , where g-factor is equal to 2 and S = 3/2 for (Mn4+, 3d3) or 2 for (Mn3+, 3d4). The μeff value is between the spin only values for Mn4+ (3.87 μB) and Mn3+ (4.9 μB) ions.26 The theoretical effective magnetic moment total (μtheoreff.tot) can be written in the form:
 | (1) |
The percentage of Mn3+ and Mn4 ions in our samples is tested by the conventional chemical technique. First, we have dissolved our powder in oxalic acid dishydrate (H2C2O4, 2H2O) and concentrated sulfuric acid (H2SO4). Then, the resulting solutions were titrated by potassium permanganate (KMnO4). The results showed that the experimental values of manganese ions concentration (for example x = 0.00) (Mn3+ (%) = 70.4 and Mn4+ (%) = 29.8) are close to the theoretical ones.
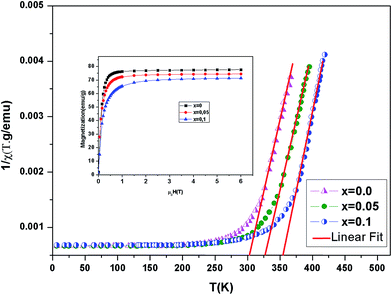
Fig. 4 shows the inverse magnetic susceptibility χ−1 (T) as a function of temperature for the samples at 0.05 T. By fitting the linear paramagnetic region to the Curie–Weiss equation, parameters C and θCW were obtained. In Table 3, experimental values of temperature TC, the Curie–Weiss temperature θCW, the theoretical (μtheoeff.tot) and experimental (μexpeff) values of effective magnetic moment, obtained for all the samples are given. Generally, the difference between TC and θCW depends on the substance and it is associated with presence of short-range ordered slightly above TC, which may be related to the presence of a magnetic inhomogeneity. As seen in Table 3, θCW is positive and decreases with x and thus follows the same trend of TC. The positive value of θCW indicates the ferromagnetic interaction between spins. In our case, small difference between the experimental μexpeff value and the theoretical μtheoreff.tot value, as well as slight μeff variation with (Al) content change can be caused by presence of the short range ferromagnetic correlation between Mn4+ and Mn3+ ions.27
| Composition | TC (K) | μtheoeff.tot (μB) | μexpeff (μB) | θCW (K) |
|---|---|---|---|---|
| La0.7Ba0.2Ca0.1MnO3 | 350 | 4.62 | 4.75 | 355 |
| La0.7Ba0.2Ca0.1Mn0.95Al0.05O3 | 321 | 4.57 | 4.61 | 326 |
| La0.7Ba0.2Ca0.1Mn0.9Al0.1O3 | 300 | 4.52 | 4.58 | 302 |
Magnetization versus field (M–μ0H) curve of La0.7Ba0.2Ca0.1Mn1−xAlxO3 at 5 K is plotted inset Fig. 4. The sample reaches nearly a constant value of magnetization under a field μ0H = 1.5 T. The measured saturation moments expressed in Bohr magneton is given by:
| MSat(cal) = (MSatMn3+) × nMn3+ + (MSatMn4+) × nMn4+ | (2) |
The isothermal magnetization curves around TC versus the external magnetic field up to 5 T are shown in Fig. 5 (x = 0.1). The so-called Arrott plot M2 versus μ0H/M in inset Fig. 5 exhibits the positive slope of the curves at all temperatures studied. This indicates that a transition between the magnetically ordered and the paramagnetic phases is of the second order.28
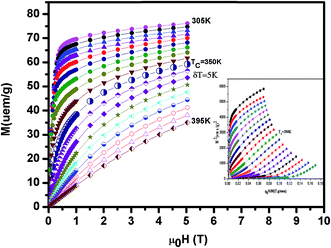 | ||
| Fig. 5 The isothermal magnetization curves around TC versus external magnetic field up to 5 T for La0.7Ba0.2Ca0.1MnO3. Inset M2 versus μ0H/M isotherms for this compound. | ||
The magnetocaloric effect (MCE) is an intrinsic property of magnetic materials. It is the response of the material to the application or removal of magnetic field, which is maximized when the material is near its magnetic ordering temperature (Curie temperature TC).
The isothermal magnetic entropy change ΔSM(T), which is associated with the magnetocaloric effect, can be calculated from the measurements of magnetization as a function of applied magnetic field and temperature. According to the classical thermodynamics theory, the change in the magnetic entropy produced by varying the magnetic field from zero to μ0H is given by:
 | (3) |
By using Maxwell's thermodynamic relation:
 | (4) |
The magnetic entropy change can be rewritten as follows:
 | (5) |
In order to evaluate the MCE, the changes of magnetic entropy ΔSM(T) upon application of magnetic fields from the isothermal M–μ0H curve can be numerically calculated using eqn (6).
 | (6) |
By using a program carried out in our laboratory based on eqn (6), we have determined magnetic entropy change (−ΔSM) for different applied magnetic field change intervals as seen in Fig. 6 for the La0.7Ba0.2Ca0.1MnO3 sample. The compounds are showing large changes in magnetic entropy around Curie temperature (TC), which is a characteristic property of simple ferromagnets due to the efficient ordering of magnetic spins at the temperature induced by magnetic field.29 The magnitude of (−ΔSM(T)) for all samples increases with increasing the applied magnetic field. For example the different curves of the magnetic entropy change for all our synthesized polycrystalline samples as a function of temperature under 5 T, show that the maximum magnetic-entropy value decreases from 5.8 J kg−1 K−1 for x = 0.00 to 4.85 J kg−1 K−1 for x = 0.10 near their respective TC. Guo et al.30 indicated that the large magnetic entropy change in perovskite manganites could originate from the spin–lattice coupling in the magnetic ordering process. Strong coupling between spin and lattice is corroborated by the observed significant lattice changes accompanying magnetic transition in perovskite manganites.31 The lattice structural change in the Mn–O bond distance as well as in the 〈Mn–O–Mn〉 bond angle would in turn favor the spin ordering. Thus a more abrupt variation of magnetization near Curie temperature (TC) occurs, resulting in a large magnetic entropy change as a large MCE. It should be noted that (−ΔSmaxM) is not the only parameter deciding about an applicability of material. There is a demand for materials which can transport heat at a relatively large temperature difference between the cold and the hot sinks in the ideal refrigeration cycle. This feature is accounted for by the full width at half maximum δTFWHM of the (−ΔSmaxM) curve. Then, the amount of transferred heat may be estimated for an ideal refrigeration cycle by the so-called relative cooling power (RCP) defined by:32
| RCP = (−ΔSmaxM) × δTFWHM | (7) |
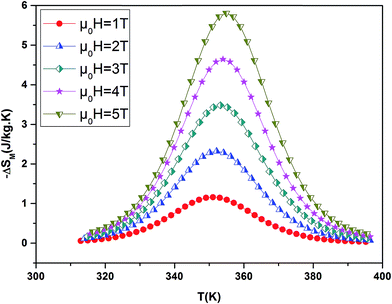 | ||
| Fig. 6 Magnetic entropy change ΔSM evolution versus temperature at several magnetic applied for La0.7Ba0.2Ca0.1MnO3 sample. | ||
| Composition | TC (K) | (−ΔSmaxM) (J kg−1 K−1) | RCP (J kg−1) | μ0H (T) | Ref. |
|---|---|---|---|---|---|
| Gd5(Si2Ge2) | 275 | 18.5 | 535 | 5 | 39 |
| La0.5Sm0.1Sr0.4Mn0.95In0.05O3 | 308 | 4.50 | 193.48 | 5 | 40 |
| La0.67Sr0.33Mn0.9Cr0.1O3 | 328 | 5 | — | 5 | 41 |
| La0.57Y0.1Ba0.23Ca0.1MnO3 | 300 | 4.34 | 349 | 5 | 42 |
| La0.8Ba0.2MnO3 | 295 | 4.5 | 130 | 5 | 43 |
| La0.67Sr0.33MnO3 | 348 | 1.69 | 211 | 5 | 44 |
| La0.7Ba0.2Ca0.1MnO3 | 350 | 5.8 | 167 | 5 | This work |
| La0.7Ba0.2Ca0.1Mn0.95Al0.05O3 | 321 | 5.3 | 180 | 5 | This work |
| La0.7Ba0.2Ca0.1Mn0.9Al0.1O3 | 300 | 4.6 | 193 | 5 | This work |
| La0.7Sr0.3Mn0.95Ti0.05O3 | 308 | 2.2 | 90 | 2 | 45 |
| La0.7Sr0.3Mn0.9Fe0.1O3 | 260 | 1.7 | 83 | 2 | 46 |
| La0.7Ba0.2Ca0.1MnO3 | 350 | 2.35 | 70 | 2 | This work |
| La0.7Ba0.2Ca0.1Mn0.95Al0.05O3 | 321 | 2.12 | 85 | 2 | This work |
| La0.7Ba0.2Ca0.1Mn0.9Al0.1O3 | 300 | 1.86 | 96 | 2 | This work |
It is well known that the critical exponents are not defined for first-order transition because the magnetic field can shift the transition, leading to a field-dependent phase boundary TC (μ0H).33 According to the scaling hypothesis, a second-order phase transition near the Curie point TC is characterized by a set of interrelated critical exponents, γ (relevant to the initial magnetic susceptibility χ0,  just above TC), δ (associated with the critical magnetization isotherm at TC) and β (associated with the spontaneous magnetization
  just below TC). Mathematically, these critical exponents are obtained, from magnetization measurements through the following asymptotic relations:34
| MS(T) = M0|ε|−β, ε < 0, T < TC | (8) |
| χ0−1(T) = (h0/M0)εγ, ε > 0, T > TC | (9) |
| M = DH1/δ, ε = 0, T = TC | (10) |
Inset at Fig. 5 shows the Arrott plot M2 vs. μ0H/M constructed from the raw M–μ0H isotherms after correcting the external magnetic field for demagnetization effects. According to mean-field theory (β = 0.5, γ = 1 and δ = 3) for a phase transition, which is far from a tricritical point, near Tc these curves should show a series of straight lines for different temperatures and the line at T = Tc should pass through the origin. In our work, the curves in the Arrott plot shows a nonlinear and concave behavior even in the high field indicating the mean-field theory for the above class of phase transitions is invalid.
The mean field approximation can be generalized to the so-called modified Arrott plot (MAP) expression, based on the Arrott–Koakes equation of state35
| (H/M)1/γ = a(T − Tc)/T + bM1/β | (11) |
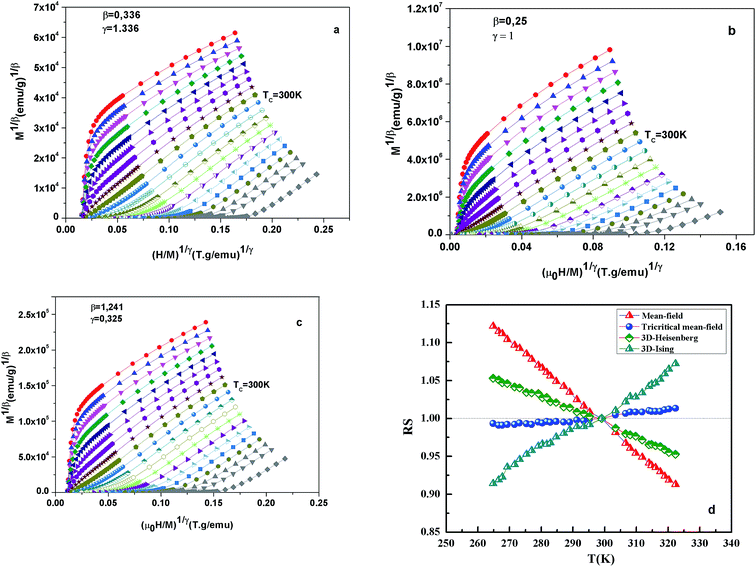
Fig. 7 shows the modified Arrott plots of M1/β vs. (H/M)1/γ, based on the Arrott–Noakes equation of state eqn (11), at different temperatures for the x = 0.1 by using three models of critical exponents: 3D Heisenberg model (β = 0.365, γ = 1.336) in Fig. 7(a), tricritical mean field (β = 0.25, γ = 1) in Fig. 7(b) and 3D Ising (β = 0.325, γ = 1.24) in Fig. 7(c).
We choose the best model which gave straight lines and nearly parallel in the region of high field.
All curves yield quasi straight lines in the high-field region. To compare these results, we calculated the so-called relative slope (RS) defined at the critical point as RS = S(T)/S(Tc). Since the MAP is a series of parallel lines, the RS of the most satisfactory model should be close to 1 (unity). The RS vs. T (x = 0.1) for the three models are shown in Fig. 7(d). One can see in this figure that the tricritical model is the best one for the determination of the critical exponents for x = 0.1 sample. The high field straight line portions of the isotherms in Fig. 7(b) can be linearly extrapolated to obtain the spontaneous magnetization MS(T,0) and the inverse susceptibility 1/χ0(T). The temperature dependence of MS(T,0) and 1/χ0(T) for the sample with x = 0.1 are shown in Fig. 8. Similarly, we can also obtain MS(T,0) vs. T and 1/χ0(T) vs. T, for samples with x = 0 and 0.05 (not shown here). The continuous curves in Fig. 8 denote the power law fitting of MS(T,0) vs. T and 1/χ0(T) vs. T according to eqn (8) and (9), respectively. This gives the values of β = 0.251 ± 0.03 with Tc = 302.46 ± 0.33 K and γ = 1.05 ± 0.02 with Tc = 303.59 ± 0.34 K. Alternatively, the values of Tc, β and γ are also obtained by Kouvel–Fisher (KF) method.36 According to this method, plots of MS(T)[dMS(T)/dT]−1 vs. T and χ0−1(T)[dχ0−1(T)/dT]−1 vs. T should yield straight lines with slopes of 1/β and 1/γ, respectively. The linear fitting to the plots following the KF method gives β = 0.249 ± 0.003 with TC = 301.15 ± 0.04 K and γ = 1.09 ± 0.04 with TC = 303 ± 0.06 K for x = 0.1 sample (Fig. 8). Obviously, the obtained values of the critical exponents and TC using the KF method are in agreement with that using the modified Arrott plot of tricritical model. The values of δ were obtained by plotting the critical isotherm at TC. In Fig. 9 the M vs. μ0H curve at 300 K was chosen as the critical isotherm based on the previous discussion. The inset of Fig. 9 shows the same curve M vs. μ0H on a log–log scale. The solid straight line with a slope 1/δ is the fitting result by using eqn (10). From the linear fit, we obtained the third critical exponent δ = 5.06 for x = 0.1 (Table 5). According to statistical theory, these three critical exponents must fulfill the Widom scaling relation:37
 | (12) |
 | ||
| Fig. 8 Kouvel Fisher plots for the spontaneous magnetization MS(t) (left) and the inverse initial susceptibility χ0−1(T) (right) were fitted to eqn (7) and (8), for x = 0.1 sample. | ||
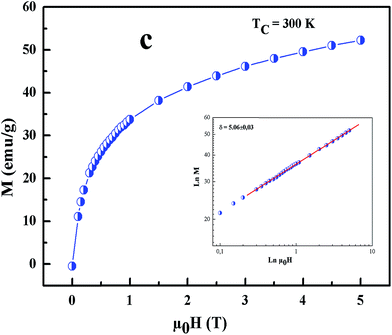 | ||
| Fig. 9 Isothermal M vs. μ0H plot of x = 0.1 sample at TC = 300 K; the inset shows the same plot in log–log scale and the solid line (red color) is the linear fit following eqn (3). | ||
| Material | Technique | TC (K) | β | γ | δ | Ref. |
|---|---|---|---|---|---|---|
| Mean-field model | Theory | 0.5 | 1.0 | 3.0 | 47 | |
| 3D-Heisenberg model | Theory | 0.365 ± 0.003 | 1.336 ± 0.004 | 4.80 ± 0.04 | 47 | |
| 3D-Ising model | Theory | 0.325 ± 0.002 | 1.241 ± 0.002 | 4.82 ± 0.02 | 47 | |
| Tricritical mean-field model | Theory | 0.25 | 1 | 5 | 47 | |
| La0.7Ba0.2Ca0.1MnO3 | MAP | 354.02 ± 0.04 | 0.253 ± 0.002 | 1.12 ± 0.03 | — | This work |
| KF | 351.23 ± 0.04 | 0.248 ± 0.04 | 1.01 ± 0.04 | — | This work | |
| C.I (cal) | — | — | — | 5.07 ± 0.02 | This work | |
| C.I (exp) | — | — | — | 4.89 ± 0.01 | This work | |
| La0.7Ba0.2Ca0.1Mn0.95Al0.05O3 | MAP | 322.35 ± 0.06 | 0.253 ± 0.001 | 1.04 ± 0.02 | — | This work |
| KF | 321.02 ± 0.01 | 0.246 ± 0.3 | 1.08 ± 0.05 | — | This work | |
| C.I (cal) | — | — | — | 5.11 ± 0.03 | This work | |
| C.I (exp) | — | — | — | 4.97 ± 0.03 | This work | |
| La0.7Ba0.2Ca0.1Mn0.9Al0.1O3 | MAP | 302.46 ± 0.33 | 0.251 ± 0.03 | 1.05 ± 0.02 | — | This work |
| KF | 301.15 ± 0.04 | 0.249 ± 0.003 | 1.09 ± 0.04 | — | This work | |
| C.I (cal) | — | — | — | 5.06 ± 0.03 | This work | |
| C.I (exp) | — | — | — | 5.176 ± 0.004 | This work | |
| La0.7Pb0.05Na0.25MnO3 | 334.54 | 0.344 | 1.296 | 4.80 | 48 | |
| La0.7Sr0.3MnO3 | 360 | 0.377 ± 0.004 | 1.168 ± 0.006 | 4.10 ± 0.01 | 49 | |
| (La0.9Dy0.1)0.8Pb0.2MnO3 | 248 | 0.484 ± 0.002 | 0.961 ± 0.012 | 2.90 ± 0.01 | 50 | |
| Nd0.7Sr0.3MnO3 | 238 | 0.271 ± 0.006 | 0.922 ± 0.016 | 4.5 | 51 | |
| La0.7Ca0.3MnO3 | 190 | 0.349 ± 0.013 | 1.231 ± 0.030 | 4.524 | 52 | |
| La0.7Ca0.1Sr0.2MnO3 | 326 | 0.36 ± 0.01 | 1.22 ± 0.01 | 4.4 ± 0.2 | 53 | |
| La0.7Ba0.3MnO3 | 310 | 0.35 | 1.41 | 5.5 | 54 |
Using the above determined values of β and γ, eqn (12) yields δ = 5.176 (x = 0.1) for β and γ evaluated according to Fig. 9. Thus the critical exponents found in this study obey the Widom scaling relation remarkably well. In the critical region, the magnetic equation of state is given by:
| M(H,ε) = εβf±(H/εβ+γ) | (13) |
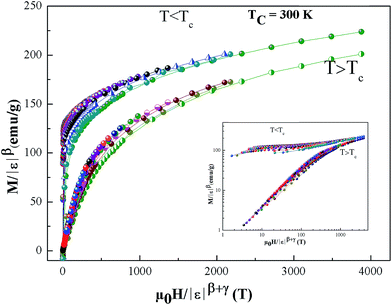 | ||
| Fig. 10 Scaling plots of M|ε|−β as function of |ε|−(β+γ), indicating two universal curves below and above TC. The inset shows the same plots on a log–log scale. | ||
Conclusion
In summary, we have investigated the structure, magnetic and magnetocaloric properties of perovskite La0.7Ba0.2Ca0.1Mn1−xAlxO3 (0 ≤ x ≤ 0.1) compounds. There is no structural transition due to substitution of Mn3+ by Al3+. All the samples crystallize in a rhombohedral structure (R![[3 with combining macron]](https://www.rsc.org/images/entities/char_0033_0304.gif) c) with a decrease in the unit cell volume as 〈rB〉 decreases. They exhibit a paramagnetic–ferromagnetic transition when temperature decreases. It was found that the maximum value of the magnetic entropy change ΔSmaxM decreases with increasing Al concentration. A large magnetocaloric effect is observed in these samples. Since RCP represents a good factor for comparing magnetocaloric materials, the La0.7Ba0.2Ca0.1Mn0.9Al0.1O3 sample looks very promising due to its high RCP = 193 J kg−1 and TC = 300 K. A detailed investigation of critical exponent properties of polycrystalline La0.7Ba0.2Ca0.1Mn1−xAlxO3 (0 ≤ x ≤ 0.1) compounds has been carried out. By means of the modified Arrott plot and Kouvel Fisher method, we have determined the critical exponents β, γ and δ, which are in a good agreement with the magnetic equation state. The results showed that the tricritical mean-field model is satisfied, indicating short range-interactions.
c) with a decrease in the unit cell volume as 〈rB〉 decreases. They exhibit a paramagnetic–ferromagnetic transition when temperature decreases. It was found that the maximum value of the magnetic entropy change ΔSmaxM decreases with increasing Al concentration. A large magnetocaloric effect is observed in these samples. Since RCP represents a good factor for comparing magnetocaloric materials, the La0.7Ba0.2Ca0.1Mn0.9Al0.1O3 sample looks very promising due to its high RCP = 193 J kg−1 and TC = 300 K. A detailed investigation of critical exponent properties of polycrystalline La0.7Ba0.2Ca0.1Mn1−xAlxO3 (0 ≤ x ≤ 0.1) compounds has been carried out. By means of the modified Arrott plot and Kouvel Fisher method, we have determined the critical exponents β, γ and δ, which are in a good agreement with the magnetic equation state. The results showed that the tricritical mean-field model is satisfied, indicating short range-interactions.
Conflicts of interest
There are no conflicts to declare.Acknowledgements
The authors would like to thank Deanship of Scientific Research at Majmaah University for supporting this work under Project Number No: 37/14.References
- J. Khelifi, A. Tozri, F. Issaoui, E. Dhahri and E. K. Hlil, J. Alloys Compd., 2014, 584, 617–624 CrossRef CAS.
- R. N. Mahato, K. Sethupathi, V. Sankaranarayanan and R. Nirmala, J. Appl. Phys., 2010, 107, 09A943 CrossRef.
- K. Cherif, J. Dhahri, E. Dhahri, M. Oumezzine and H. Vincent, J. Solid State Chem., 2002, 163, 466–471 CrossRef CAS.
- L. Joshi and S. Keshri, Measurement, 2011, 44, 938–945 CrossRef.
- S. S. Ata-Allah, M. F. Mostafa, Z. Heiba and H. S. Refai, Phys. B, 2011, 406, 801–811 CrossRef CAS.
- C. Zener, Phys. Rev., 1951, 81, 440 CrossRef CAS.
- R. Cabassi, F. Bolzoni, A. Gauzzi and F. Licci, Phys. Rev. B: Condens. Matter Mater. Phys., 2006, 74, 184425 CrossRef.
- M. Fähnle, W. U. Kellner and H. Kronmüller, Phys. Rev. B: Condens. Matter Mater. Phys., 1987, 35, 3640 CrossRef.
- H. E. Stanley, Introduction to phase Transitions and Critical Phenomena, Oxford University Press, London, 1971 Search PubMed.
- J. L. Alonso, L. A. Fernandez, F. Guinea, V. Laliena and V. Martin-Mayor, Nucl. Phys. B, 2001, 596, 587 CrossRef.
- A. K. Pramanik and A. Banerjee, Phys. Rev. B: Condens. Matter Mater. Phys., 2009, 79, 214426 CrossRef.
- Y. Motome and N. Furukawa, J. Phys. Soc. Jpn., 2001, 70, 1487 CrossRef CAS.
- Y. Motome and N. Furukawa, J. Phys. Soc. Jpn., 2000, 69, 3785 CrossRef CAS.
- K. Ghosh, C. J. Lobb, R. L. Greene, S. G. Karabashev, D. A. Shulyatev, A. A. Arsenov and Y. Mukovskii, Phys. Rev. Lett., 1998, 81, 4740 CrossRef CAS.
- Ch. V. Mohan, M. Seeger, H. Kronmuller, P. Murugaraj and J. Maier, J. Magn. Magn. Mater., 1998, 183, 348 CrossRef CAS.
- H. S. Shin, J. E. Lee, Y. S. Nam, H. L. Ju and C. W. Park, Solid State Commun., 2001, 118, 377 CrossRef CAS.
- J. Rodriguez Carvajal, FULLPROF2000–2005, Laboratoire Leon Briouillon (CEA-CNRS).
- R. D. Schannon, Acta Crystallogr., Sect. A: Cryst. Phys., Diffr., Theor. Gen. Crystallogr., 1976, 32, 751–767 CrossRef.
- E. Rodriguez, I. Alvarez, M. L. Lopez, M. L. Veiga and C. Pico, J. Solid State Chem., 1999, 148, 479–486 CrossRef CAS.
- M. O'Keeffe and B. G. Hyde, Acta Crystallogr., Sect. B: Struct. Crystallogr. Cryst. Chem., 1977, 33, 3802–3813 CrossRef.
- A. Tozri, E. Dhahri and E. K. Hlil, Phys. Lett. A, 2011, 375, 1528–1533 CrossRef CAS.
- M. A. Gdaiem, S. Ghodhbane, Ah. Dhahri, J. Dhahri and E. K. Hlil, J. Alloys Compd., 2016, 681, 547–55420 CrossRef CAS.
- M. Dhahri, A. Zaidi, K. Cherif, J. Dhahri and E. K. Hlil, J. Alloys Compd., 2017, 691, 578–586 CrossRef CAS.
- P. G. Radaelli, G. Iannone, M. Marezio, H. Y. Hwang, S.-W. Cheong, J. D. Jorgensen and D. N. Argyriou, Phys. Rev. B: Condens. Matter Mater. Phys., 1997, 56, 8265 CrossRef CAS.
- C. Vazquez-Vazquez and M. A. Lopez-Quintela, J. Solid State Chem., 2006, 179, 3229–3237 CrossRef CAS.
- A. h. Dhahri, E. Dhahri and E. K. Hlil, Appl. Phys. A: Mater. Sci. Process., 2014, 116, 2077–2085 CrossRef CAS.
- S. L. Ye, W. H. Song, J. M. Dai, K. Y. Wang and J. J. Du, J. Appl. Phys., 2001, 90, 2943 CrossRef CAS.
- S. K. Banerjee, Phys. Lett., 1964, 12, 16 CrossRef.
- A. Bhattacharyya, S. Chatterjee, S. Giri and S. Majumdar, Eur. Phys. J. B, 2009, 70, 347 CrossRef CAS.
- Z. B. Guo, Y. M. Du, J. S. Zhu, H. Huang, W. P. Ding and D. Feng, Phys. Rev. Lett., 1997, 78, 1142 CrossRef CAS.
- P. G. Radaelli, D. E. Cox, M. Marezio, S. W. Cheong, P. E. Schiffer and A. P. Ramirez, Phys. Rev. Lett., 1995, 75, 4488 CrossRef CAS PubMed.
- M. Abassi, N. Dhahri, J. Dhahri and E. K. Hlil, Phys. B, 2014, 449, 138–143 CrossRef CAS.
- T. L. Phan, P. Q. Thanh, N. H. Sinh, K. W. Lee and S. C. Yu, Curr. Appl. Phys., 2011, 11, 830 CrossRef.
- K. Huang, Statistical Mechanics, Wiley, New York, 1987 Search PubMed.
- A. Arrott and J. E. Noakes, Phys. Rev. Lett., 1967, 19, 786 CrossRef CAS.
- J. S. Kouvel and M. E. Fisher, Phys. Rev., 1964, 136, A1626 CrossRef.
- H. S. Shin, J. E. Lee, Y. S. Nam, H. L. Ju and C. W. Park, Solid State Commun., 2001, 118, 377 CrossRef CAS.
- M. E. Fisher, S.-K. Ma and B. G. Nickel, Phys. Rev. Lett., 1972, 29, 917–920 CrossRef.
- K. A. Gschneidner Jr, V. K. Pecharsky and A. O. Tsokol, Rep. Prog. Phys., 2005, 68, 1479 CrossRef.
- M. Dhahri, A. Zaidi, K. Cherif, J. Dhahri and E. K. Hlil, J. Alloys Compd., 2017, 691, 578–586 CrossRef CAS.
- Y. Sun, W. Tong and Y. Zhang, J. Magn. Magn. Mater., 2001, 232, 205–208 CrossRef CAS.
- M. Abassi, N. Dhahri, J. Dhahri and E. K. HLIL, Phys. B, 2014, 449, 138–143 CrossRef CAS.
- S. Ghodhbane, A. Dhahri, N. Dhahri, E. K. Hlil and J. Dhahri, J. Alloys Compd., 2013, 550, 364 CrossRef.
- S. Zemni, M. Baazaoui, J. Dhahri, H. Vincent and M. Oumezzine, J. Mater. Lett., 2009, 63, 489 CrossRef CAS.
- D. N. H. Nam, N. V. Dai, L. V. Hong, N. X. Phuc, S. C. Yu, M. Tachibana and E. Takayama- Muromachi, J. Appl. Phys., 2008, 103, 043905 CrossRef.
- S. K. Barik, C. Krishnamoorthi and R. Mahendiran, J. Magn. Magn. Mater., 2011, 323, 1015–1021 CrossRef CAS.
- S. E. L. Kossi, S. Mnefgui, J. Dhahri and E. K. Hlil, Ceram. Int., 2015, 41, 8331–8340 CrossRef CAS.
- A. Tozri, E. Dhahri, E. K. Hlil and M. A. Valente, Solid State Commun., 2011, 151, 315–320 CrossRef CAS.
- T. D. Thanh, D. C. Linh, T. V. Manh, T. A. Ho, T.-L. Phan and S. C. Yu, J. Appl. Phys., 2015, 117, 17C101 CrossRef.
- T. A. Ho, T. L. Phan, P. D. Thang and S. C. Yu, J. Electron. Mater., 2015, 45, 2328–2333 CrossRef.
- T.-L. Phan, T. A. Ho, P. D. Thang, Q. T. Tran, T. D. Thanh, N. X. Phuc, M. H. Phan, B. T. Huy and S. C. Yu, J. Alloys Compd., 2014, 615, 937–945 CrossRef CAS.
- P. Zhang, P. Lampen, T. L. Phan, S. C. Yu, T. D. Thanh, N. H. Dan, V. D. Lam, H. Srikanth and M. H. Phan, J. Magn. Magn. Mater., 2013, 348, 146–153 CrossRef CAS.
- M. H. Phan, V. Franco, N. S. Bingham, H. Srikanth, N. H. Hur and S. C. Yu, J. Alloys Compd., 2010, 508, 238–244 CrossRef CAS.
- T. A. Ho, M. H. Phan, N. X. Phuc, V. D. Lam, T. L. Phan and S. C. Yu, J. Electron. Mater., 2016, 45, 2508 CrossRef CAS.
| This journal is © The Royal Society of Chemistry 2017 |

