 Open Access Article
Creative Commons Attribution 3.0 Unported Licence
An electrogenerated base for the alkaline oxidative pretreatment of lignocellulosic biomass to produce bioethanol
Tongjun Liu *a and
Zhenglong Li†
*bc
aDepartment of Bioengineering, Qilu University of Technology, Jinan, 250353, China. E-mail: liutongjun@outlook.com
bDepartment of Chemical Engineering and Materials Science, Michigan State University, East Lansing, MI 48824, USA. E-mail: lizhenglong1982@gmail.com
cDepartment of Biosystems and Agricultural Engineering, Michigan State University, East Lansing, MI 48824, USA
First published on 9th October 2017
Abstract
In this study, we aimed to develop an alternative base to substitute for NaOH for use in alkaline oxidative biomass pretreatment. An electrogenerated base (EGB) from water electrolysis was employed in the alkaline oxidative pretreatment of corn stover (CS). Similar to NaOH, when the EGB was used in pretreatment, 56.6% of the original lignin was removed after 6 h pretreatment, leading to significantly enhanced enzymatic digestibility. The glucan digestibility of the pretreated CS was 3.8 times higher than that of raw CS after 24 h. The ethanol metabolic yields were 64.6% and 72.4% when using activated carbon detoxified hydrolysate or hydrolysate at pH 5.5, respectively. These results demonstrate that an EGB, a byproduct from various electrocatalytic processes, could be used as a potential replacement for NaOH. Moreover, we propose a new biorefinery concept, which combines water electrolysis, biological conversion and thermochemical/catalytic conversion to produce bioethanol, hydrogen, hydrocarbon fuels and valuable chemicals.
1. Introduction
Pretreatment plays a crucial role in the biological conversion of lignocellulosic biomass to biofuels and chemicals.1,2 Among the well-developed technologies, alkaline-based pretreatment has been considered as one of the most promising approaches,3,4 which can effectively improve the digestibility and fermentability of biomass.5,6 Alkaline oxidative pretreatment, one of the alkaline pretreatment methods, has been practiced for many years.7–12 This process can be carried out at ambient temperatures and pressures for relatively medium to long periods of time. In addition, its capital costs are much lower compared with other technologies, such as ammonia fiber expansion (AFEX) or steam explosion approaches.13,14 Also, low carbohydrate loss and high sugar conversion rates are other important advantages of this process. Chemicals such as NaOH, KOH, Ca(OH)2 and Na2CO3 have been tested as bases for alkaline oxidative pretreatment.15–18 Typically, there is a high consumption of base in such a pretreatment. For example, 126 g of NaOH/kg biomass is used in alkaline oxidative pretreatment.6 Higher use of base has been also reported in other studies.7,9,11,12,18–21 Yuan et al.22 used more than 80 g of NaOH/kg biomass (dry basis) to perform a two-stage alkaline pretreatment. Large chemical consumption in alkaline pretreatment reduces the economic competitiveness of the method,18 and becomes one of the major hurdles for the commercialization of a biorefinery using alkaline pretreatment.23 Therefore, it is necessary to find a cost-effective alternative alkaline source, which would make this pretreatment much more economical and cost-competitive. In this study, we aimed to demonstrate a new concept, using an electrogenerated base (EGB) as an alkaline alternative in alkaline oxidative pretreatment.An EGB can be produced in several electrochemical ways. One of the approaches is conventional water electrolysis using a two-chamber electrochemical cell. On the cathode side, the reduction of H+ takes place, resulting in the continuous consumption of H+. On the anode side, the oxidation of water occurs, and H+ is constantly produced. In most cases, when the H+ consumption rate is much higher than the H+ transfer rate from the anode to the cathode side, an alkaline solution will be produced on the cathode side, while an acidic solution will be produced on the anode side.24 This approach is mainly used to produce hydrogen from water, so this electrogenerated base is considered a by-product of electrochemical hydrogen production. Electrocatalytic hydrogenation has been studied as an important alternative to the thermal catalytic hydrogenation of biomass,25–30 and an electrogenerated base is also produced during this process as a by-product. Besides this, electrocatalytic oxidation on the anode side also generates a by-product base in the cathode chamber.31,32
Previous studies have demonstrated the use of the electrogenerated acid solution for cellulose hydrolysis33 and the transformation of epoxides to ketones and acetonitrides34. However, very little attention is paid to the alkaline solution on the cathode side. Since this alkaline solution is considered a by-product of water electrolysis, and electrocatalytic hydrogenation and oxidation, if it is used in biomass pretreatment, this will contribute to reducing the alkaline costs in biomass pretreatment. In particular, when renewable electricity (solar or wind derived) is used for these electrolytic reactions,35 the base supply will become more sustainable and environmentally friendly. Another direct approach is photocatalytic water splitting, which has been the focus of much research.36–39
To effectively use these electrogenerated bases (by-products from various electrocatalytic processes), we explored the feasibility of using an EGB from water electrolysis (for hydrogen production) as an alkaline source for alkaline oxidative biomass pretreatment. Enzymatic saccharification and ethanolic fermentation were subsequently conducted with genetically modified yeast. In view of the above mentioned idea, we also proposed an integrated biorefinery concept, combining water electrolysis, biological conversion and thermochemical/catalytic conversion.
2. Materials and methods
2.1 Feedstocks
Corn (Zea mays L. Pioneer hybrid 36H56) stover (CS) was obtained from the Great Lakes Bioenergy Research Center (GLBRC), University of Wisconsin-Madison. The switchgrass (Panicum virgatum) variety was Cave-in-Rock, provided by the Michigan Biotechnology Institute (MBI). Samples were stored at room temperature. Biomass was ground in a mill (Thomas Scientific, Swedesboro, NJ) to pass through a 5 mm screen.2.2 Water electrolysis
Water electrolysis was carried out in a two-chambered glass H-cell,30 separated by a DuPont® Nafion-117 membrane. To counter resistance heating as current passes through the electrolyte solution, a water jacket was used to cool the cathode chamber. The reaction temperature was maintained at 27 °C, and the pressure was 1 atm. NaCl served as the cathode electrolyte (catholyte), while ruthenium supported on activated carbon cloth was used as the working electrode (cathode). The anolyte (30 mL) consisted of 1 M sulfuric acid, and a Pt wire was used as the counter electrode (anode). Electrolysis was carried out under galvanostatic control (480 mA) using an Instek GPR-11H30D DC power supply.2.3 Pretreatment
Pretreatment was conducted in a 1 L Erlenmeyer flask at 30 °C and 150 rpm. CS loading was 20.5% (w/w). The H2O2 loading was 0.125 g g−1 of biomass. CS (100 g) was mixed well with base ([OH−] = 1.7 mol L−1) generated from water electrolysis. Subsequently, 37.5 mL of a commercial solution of 30% H2O2 (ACS Reagent Grade, J. T. Baker) was added into the slurry, and the pH was adjusted to 11.5 with the base solution. The pH was maintained at 11.5 via the manual addition of the same base solution periodically. During the addition of base, the biomass was thoroughly mixed.2.4 Enzymatic saccharification
After pretreatment, the slurry was adjusted to pH 4.76 using 72% H2SO4. The enzyme protein loading was 30 mg g−1 of glucan of an optimized enzyme cocktail [Accellerase 1000, Multifect-xylanase, and Multifect-pectinase (Genencor, NY, USA) solutions, at a protein ratio of 0.63![[thin space (1/6-em)]](https://www.rsc.org/images/entities/char_2009.gif) :
:![[thin space (1/6-em)]](https://www.rsc.org/images/entities/char_2009.gif) 0.27
0.27![[thin space (1/6-em)]](https://www.rsc.org/images/entities/char_2009.gif) :
:![[thin space (1/6-em)]](https://www.rsc.org/images/entities/char_2009.gif) 0.1]. The enzymes were added to the pretreated CS slurry, then mixed and incubated at 50 °C for 24 h. The material was sampled at different intervals to determine the monomeric sugars content. Glucan conversion was calculated based on the glucan dissolved into the hydrolysate divided by the total glucan content in the CS.
0.1]. The enzymes were added to the pretreated CS slurry, then mixed and incubated at 50 °C for 24 h. The material was sampled at different intervals to determine the monomeric sugars content. Glucan conversion was calculated based on the glucan dissolved into the hydrolysate divided by the total glucan content in the CS.
2.5 Detoxification of hydrolysate using activated carbon
After hydrolysis, the total slurry was centrifuged at 18![[thin space (1/6-em)]](https://www.rsc.org/images/entities/char_2009.gif) 000g for 15 min, and the liquid part was mixed with activated carbon (Fisher Scientific #05-690A) in the ratio of 5 g of activated carbon to 100 mL of hydrolysate and then incubated at 50 °C for 1 h in an unbaffled flask under shaking at 150 rpm. After centrifugation, yeast nitrogen base (YNB) (Sigma-Aldrich) and urea were added into the supernatant at final concentrations of 1.67 g L−1 and 2.27 g L−1, respectively. Subsequently, the solution was centrifuged at 18
000g for 15 min, and the liquid part was mixed with activated carbon (Fisher Scientific #05-690A) in the ratio of 5 g of activated carbon to 100 mL of hydrolysate and then incubated at 50 °C for 1 h in an unbaffled flask under shaking at 150 rpm. After centrifugation, yeast nitrogen base (YNB) (Sigma-Aldrich) and urea were added into the supernatant at final concentrations of 1.67 g L−1 and 2.27 g L−1, respectively. Subsequently, the solution was centrifuged at 18![[thin space (1/6-em)]](https://www.rsc.org/images/entities/char_2009.gif) 000g for 15 min, and the supernatant was sterilized with a 0.22 μm filter.
000g for 15 min, and the supernatant was sterilized with a 0.22 μm filter.
2.6 Preparation of hydrolysate with a pH adjustment of 5.5
When hydrolysis was done, the slurry was centrifuged at 18![[thin space (1/6-em)]](https://www.rsc.org/images/entities/char_2009.gif) 000g for 15 min, and the supernatant was mixed with YNB and urea. The final concentrations of YNB and urea were 1.67 g L−1 and 2.27 g L−1, respectively. The pH was adjusted to 5.5 with the addition of NaOH pellets, and then the hydrolysate was sterilized with a 0.22 μm filter.
000g for 15 min, and the supernatant was mixed with YNB and urea. The final concentrations of YNB and urea were 1.67 g L−1 and 2.27 g L−1, respectively. The pH was adjusted to 5.5 with the addition of NaOH pellets, and then the hydrolysate was sterilized with a 0.22 μm filter.
2.7 Yeast strain and seed culture preparation
Xylose-fermenting Saccharomyces cerevisiae GLBRC Y73,40 a yeast strain genetically modified to convert xylose into ethanol, was obtained from Trey Sato, University of Wisconsin-Madison. To prepare the seed culture, the strain was grown on a YEPD (10 g L−1 yeast extract, 20 g L−1 peptone, 20 g L−1 glucose) plate at 30 °C for 1 day. The cells were transferred to the liquid YEPD medium in an unbaffled flask. The seed was grown overnight at 30 °C under 150 rpm agitation.2.8 Ethanolic fermentation
Fermentation experiments were conducted using a working volume of 50 mL in a 250 mL unbaffled flask at 30 °C under 150 rpm agitation. A designated volume of seed culture was centrifuged at 5000 rpm for 5 min, and a yeast cell pellet was resuspended in the medium to initiate fermentation. The flasks were capped with fermentation locks (Bacchus & Barleycorn Ltd., Shawnee, KS). N2 was used for purging to maintain anaerobic conditions in the flasks. Samples were taken during the course of fermentation. Three different approaches were employed. As shown in Fig. 1, in the first approach, the pretreated CS hydrolysate was detoxified using activated carbon (Fig. 1A). In the second approach, the hydrolysate was adjusted to pH 5.5 using NaOH pellets (Fig. 1B). In the third approach, YPDX medium was used instead of CS hydrolysate (Fig. 1C) for comparison.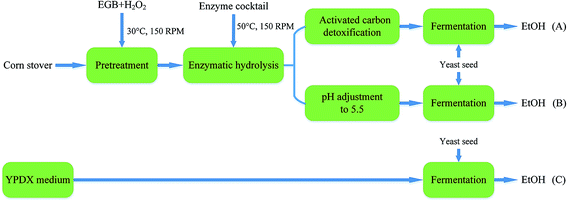 | ||
| Fig. 1 A schematic diagram of ethanol production from: pretreated CS hydrolysate detoxified using activated carbon (A); and hydrolysate at pH 5.5 (B); with YPDX medium (C) for comparison. | ||
2.9 Determination of monosaccharides, ethanol and yeast cells
The CS composition was determined based upon the standard method, “Determination of Structural Carbohydrates and Lignin in Biomass”, described by the National Renewable Energy Laboratory.41 The monosaccharides and ethanol were analyzed using a BioRad Aminex HPX-87H column at 65 °C with a constant flow rate of 0.6 mL min−1 using 5 mM sulfuric acid as the mobile phase. All composition experiments were performed in triplicate. The optical densities of the cells were determined using a spectrophotometer (Shimadzu SPD-20A, Japan) at a wavelength of 600 nm after proper dilution with deionized water to give an absorbance range of 0.20–0.80. Un-inoculated fermentation medium was used as a blank.3. Results and discussion
3.1 Alkaline oxidative pretreatment of corn stover using an EGB
Fig. 2A and B show a visual comparison of raw corn stover (CS) material and alkaline oxidative pretreated CS. Obviously, the biomass changed to a lighter color after pretreatment. At the same time, the pretreated biomass was swelled compared with the raw material, which indicates that its porosity increased; this could enhance the enzyme accessibility and sugar digestibility, which will be further discussed later.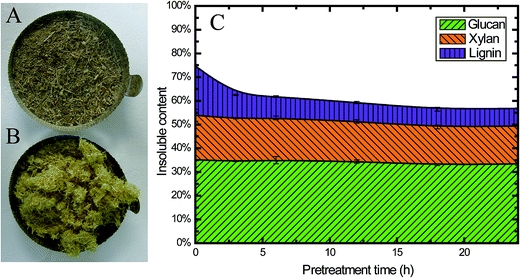 | ||
| Fig. 2 Characteristics of CS pretreated using EGB: photographs of untreated (A) and treated (B) CS, and (C) the insoluble content of CS during pretreatment. | ||
Besides the changes in appearance, the chemical composition also changed during pretreatment. All the pretreated samples exhibited higher cellulose and lower lignin content than the untreated ones (Table 1), which could be attributed to the removal of lignin during pretreatment, as 56.6% of the original lignin was solubilized (from 20.7% to 9.0%) after 6 h pretreatment (Fig. 2C). Fig. 2C clearly shows that during the first 3 h of pretreatment, 51.2% of the lignin was solubilized (from 20.7% to 10.1%), and only 35.7% of the lignin (from 20.7% to 7.4%) was retained in the insoluble part after pretreatment for 24 h. These findings were consistent with previous studies on alkaline pretreated residues.42 Alkaline chemicals, such as NaOH, have been known to remove lignin from the biomass cell wall matrix by reacting with the carboxylic acid and phenolic groups of lignin, making them more alkali soluble.42
This alkaline oxidative pretreatment did not have a significant impact on cellulose. Only 2.5% of the total glucan was solubilized. At the same time, 15.7% of the hemicellulose was released into the pretreatment slurry (Fig. 2C). This result was also consistent with previous studies.6 The reaction occurred mainly in the initial stages, especially within the first 3 h. This pretreatment method retained most of the cellulose and hemicellulose in the solid fraction after pretreatment, which is one of the important advantages of alkaline oxidative pretreatment.
3.2 Enzymatic hydrolysis
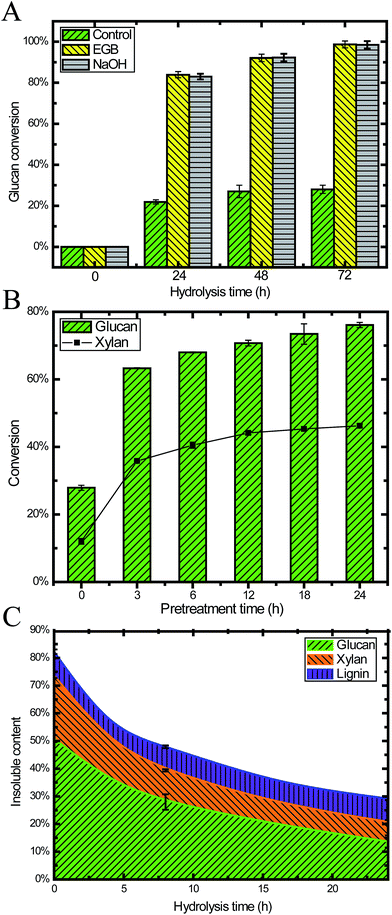
To investigate the digestibility after pretreatment, we performed enzymatic saccharification on 24 h pretreated CS under the conditions of 2% (w/v) biomass loading. Within 24 h, the glucan conversion reached 84%, and then it was slowly increased to 97% after 72 h. The glucan conversion for the pretreated CS was 3.8, 3.7 and 3.7 times higher than raw CS after 24 h, 48 h and 72 h, respectively (Fig. 3A). This result demonstrated that pretreatment with an EGB could effectively enhance the digestibility.We also performed pretreatment and hydrolysis at a higher biomass loading (20.5%, w/w) in order to obtain a higher ethanol titer after fermentation. Fig. 3B shows the hydrolysis results for samples taken after different pretreatment times, where the duration of hydrolysis was 24 h. We found that pretreatment increased both glucan and xylan conversion, especially during the initial 3 h. After 12 h pretreatment, the conversion was gradually increased, reaching a plateau after 18 h. This result suggested that pretreatment of 18 h or less was enough for ideal conversion, which is similar to many other reports of alkaline pretreatment with NaOH.6
It is well recognized that lignin content and distribution affect enzymatic saccharification.43,44 High cellulose digestibility has been obtained from extensively delignified softwood.44 Our results (Fig. 2C, 3A and B) demonstrated that alkaline oxidative pretreatment enhanced the enzymatic digestibility of lignocellulosic biomass through removing lignin.5 In the enzymatic saccharification stage, the lignin content remained constant because there was no lignin degradation. Simultaneously, 70% of the cellulose and 49% of the hemicellulose were degraded, and monomeric sugars were released into the liquid phase (Fig. 3C).
3.3 Ethanolic fermentation
The presence of inhibitors in hydrolysates is a major obstacle to cellulosic ethanol production because these inhibitors negatively affect the performance of microorganisms. It is well known that inhibitors, which are toxic to microorganisms during fermentation, are generated during the pretreatment process, no matter which pretreatment method is used for the bioconversion of lignocellulose. Ferulic acid, p-coumaric acid, acetic acid, formic acid and other phenolic compounds are common inhibitors generated during alkaline oxidative pretreatment.40 Usually, some detoxification procedures are necessary prior to fermentation, such as biological methods, physical methods, chemical methods and combined treatments.45,46 In this study, fermentation was conducted with different media, including a synthetic medium and hydrolysates treated via different detoxification procedures (Fig. 1). Glucose could be entirely utilized in less than 16.5 h with the pure sugar (glucose & xylose) medium (YPDX), and then xylose could be efficiently used and converted to ethanol (Fig. 4A and Table 2). For the lignocellulosic hydrolysate, two detoxification methods were employed in the present study. Fig. 4B shows the fermentation profile of hydrolysate detoxified via activated carbon. The lag phase of yeast growth was much longer compared with the synthetic medium, and this might explain why the glucose uptake rate was slower compared with the synthetic medium. It took 24 h to utilize all the glucose, and then xylose was converted to yeast cell biomass and ethanol. Fig. 4C and Table 2 illustrate the fermentation results for the hydrolysate at pH 5.5. The glucose uptake and utilization profile is very similar to that of the synthetic medium. The xylose-to-ethanol conversion rate was between that of the synthetic medium and the hydrolysate treated with activated carbon.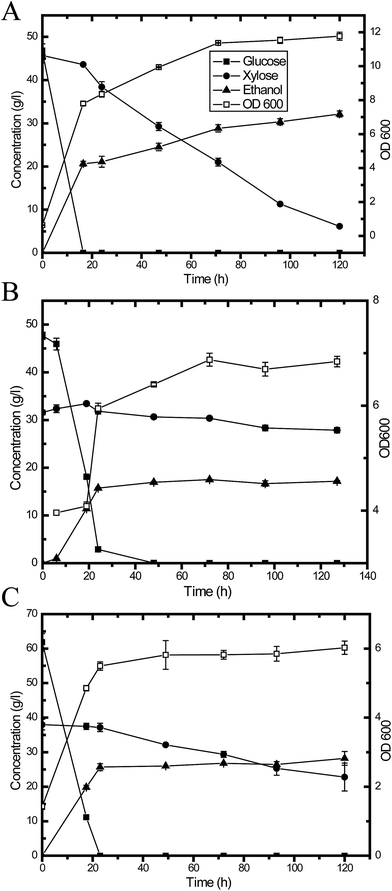 | ||
| Fig. 4 Y73 fermentation profiles under different conditions: (A) synthetic medium (YPDX); (B) CS hydrolysate detoxified using activated carbon; and (C) CS hydrolysate at pH 5.5. | ||
| Medium | Hydrolysate detoxified using activated carbon | Hydrolysate at pH 5.5 | Synthetic medium (YPDX) |
|---|---|---|---|
| a Y/x/s: cell biomass yield on glucose was calculated based on the maximum cell biomass during glucose fermentation and the consumed glucose at that time.b Sugar consumption was calculated based on the available monomeric glucose and xylose for fermentation.c Ethanol yield calculated based on the total consumed glucose and xylose, and the theoretical ethanol yield was assumed to be 0.51 g g−1 of sugar. | |||
| Initial glucose (g L−1) | 47.7 ± 0.8 | 77.4 ± 0.3 | 46.6 ± 1.8 |
| Initial xylose (g L−1) | 31.6 ± 0.5 | 35.7 ± 0.5 | 45.7 ± 0.5 |
| Ethanol yield from xylose | NA | 0.2 | 0.3 |
| Xylose consumption | 11.7% | 56.7% | 86.6% |
| Y/x/sa | 0.2 ± 0 | 0.2 ± 0.0 | 0.3 ± 0 |
| Sugar consumption (%)b | 64.8 | 85.6 | 94.3 |
| Ethanol metabolic yield (%)c | 64.6 | 72.4 | 74.4 |
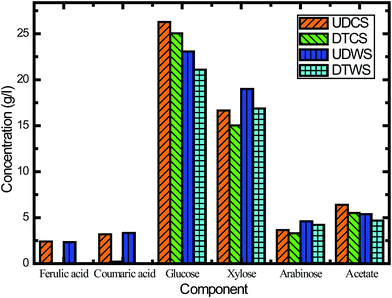
In this study, we assessed the effects of inhibitors on fermentation, and the effectiveness of inhibitor removal was also examined from different detoxification methods. The activated carbon detoxification method was able to remove some of the inhibitors. The main inhibitory compounds, lignin derived ferulic acid and p-coumaric acid, were removed 100% and 93.0%, respectively (Fig. 5). However, there was also sugar loss after activated carbon detoxification, and this was most probably due to adsorption. For CS, the losses of glucose, xylose and arabinose were 4.7%, 9.8% and 9.5%, respectively (Fig. 5). In order to verify this characteristic, switchgrass was used to conduct the same experiment. When using switchgrass, the losses of these three monomeric sugars were 8.6%, 11.2% and 8.5%, respectively. Venkatesan47 has reported sugar losses for hydrolysate detoxified using activated carbon, which is consistent with our results.
Besides ferulic acid and p-coumaric acid, acetic acid is another important inhibitor generated during alkaline oxidative pretreatment. Acetic acid inhibits the growth of yeast cell mass, sugar consumption and ethanol volumetric productivity.48 Fig. 5 reveals that activated carbon detoxification did not remove much acetate, while the concentration of undissociated acetic acid was decreased when the medium pH was increased to 5.5. This finding suggested that a higher pH could alleviate the inhibitory effects of acetic acid on S. cerevisiae fermentation and enhance the ethanol production (Fig. 5B and C). This result also confirmed that the inhibitory effects of acetic acid were linked to the undissociated form of acetic acid, which was consistent with previous reports.48 Overall the hydrolysate with pH adjustment performed better than the hydrolysate detoxified with activated carbon.
Adjusting the hydrolysate pH also showed better performance than activated carbon detoxification in terms of the consumption of glucose and xylose, as well as ethanol metabolic yield. Although it is well acknowledged that activated carbon can efficiently remove phenolic compounds,6,40,49 presumably there were still some other types of unknown inhibitors in the hydrolysate, which might exert negative effects on sugar consumption and conversion. Moreover, sugar loss was inevitable because of the activated carbon adsorption. For all of these reasons, pH adjustment to 5.5 was preferable over detoxification with activated carbon.
Compared with previously reported data,6,9,11,19,20 the EGB achieves similar performance in biomass pretreatment, enzymatic hydrolysis and ethanol fermentation. Lignin was removed by 56.6% during 24 h pretreatment. More than 97% of the cellulose was converted into glucose under conditions of 2% biomass loading after 24 h. Moreover, the ethanol metabolic yield was 72.4%, if the pH of the hydrolysate was adjusted to 5.5. All of these findings demonstrated that the EGB was a good alternative to NaOH in alkaline oxidative pretreatment for cellulosic ethanol production.
3.4 Outlook: biorefinery concept based on this biomass pretreatment
Based on this new approach of biomass pretreatment with an EGB, we propose a new biorefinery concept for water electrolysis, biological conversion and thermochemical/catalytic conversion (Fig. 6). Water electrolysis can utilize renewable electricity from solar or wind to produce bases, acids and hydrogen.50 Hydrogen can be used for hydroprocessing in biomass thermochemical/catalytic conversion, which can produce gasoline, diesel and jet fuel, or valuable chemicals. Normally, hydrogen is produced from the steam reforming of petroleum hydrocarbons, mainly natural gas, which is more economical at large scale production. It would be very attractive to generate hydrogen with scalable water electrolysis technology at a biorefinery site, especially using renewable electricity.51 Another great benefit is significantly reducing CO2 emission by replacing natural gas derived hydrogen with water electrolysis.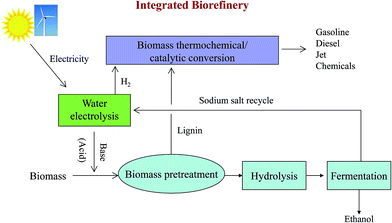 | ||
| Fig. 6 An integrated biorefinery based on water electrolysis, biological conversion and thermochemical/catalytic conversion. | ||
Both an EGB and electrogenerated acid can be used for biomass pretreatment. When alkaline oxidative pretreatment is employed, an EGB is used in the pretreatment step and an electrogenerated acid can be used to adjust the pH to the optimal conditions for cellulase and hemicellulase prior to hydrolysis. In the case of acid pretreatment, the electrogenerated acid can be used in biomass pretreatment, and the base can be employed to adjust the pH for enzymatic saccharification and fermentation. The salt needed for water electrolysis (such as NaCl) can be recycled after fermentation. Lignin, separated after pretreatment, can be converted into transportation fuels or chemicals via the thermochemical/catalytic conversion process. Residual char from pyrolysis can be used to effectively detoxify hydrolysates by adsorbing aromatic inhibitors of fermentation.6,49
4. Conclusions
In the present study, we demonstrated that an EGB from water electrolysis, a good alternative to NaOH, could be used for biomass alkaline oxidative pretreatment and the production of ethanol after further hydrolysis and fermentation. High digestibility was achieved in the biomass pretreated with the EGB. Water electrolysis is a promising approach for generating hydrogen, and its byproduct base can be used for biomass pretreatment to produce fuel ethanol and other value added chemicals.Conflicts of interest
There are no conflicts of interest to declare.Acknowledgements
Part of the study was done in Dr David Hodge's lab in the Department of Chemical Engineering and Materials Science, Michigan State University. The authors are also grateful to Dr Trey Sato in GLBRC, University of Wisconsin-Madison for providing yeast strain Y73. This work was supported by the Natural Science Foundation of Shandong Province (grant number ZR2014BM031) and the Major Research & Development Program of Shandong Province (grant number 2015GSF121022).Notes and references
- A. Kallioinen, Development of pretreatment technology and enzymatic hydrolysis for biorefineries, http://www.vtt.fi/Documents/2014_S56.pdf, accessed 22 April 2017 Search PubMed.
- P. Kumar, D. M. Barrett, M. J. Delwiche and P. Stroeve, Ind. Eng. Chem. Res., 2009, 48, 3713–3729 CrossRef CAS.
- V. Menon and M. Rao, Prog. Energy Combust. Sci., 2012, 38, 522–550 CrossRef CAS.
- H. Xu, B. Li and X. Mu, Ind. Eng. Chem. Res., 2016, 55, 8691–8705 CrossRef CAS.
- T. Liu, D. L. Williams, S. Pattathil, M. Li, M. G. Hahn and D. B. Hodge, Biotechnol. Biofuels, 2014, 7, 48 CrossRef PubMed.
- G. Banerjee, S. Car, T. Liu, D. L. Williams, S. L. Meza, J. D. Walton and D. B. Hodge, Biotechnol. Bioeng., 2012, 109, 922–931 CrossRef CAS PubMed.
- B. C. Saha and M. A. Cotta, Biotechnol. Prog., 2006, 22, 449–453 CrossRef CAS PubMed.
- P. Martel and J. M. Gould, J. Appl. Polym. Sci., 1990, 39, 707–714 CrossRef.
- J. M. Gould, B. K. Jasberg, G. J. Fahey and L. L. Berger, Biotechnol. Bioeng., 1989, 33, 233–236 CrossRef CAS PubMed.
- M. S. Kerley, G. J. Fahey, L. L. Berger, J. M. Gould and B. F. Lee, Science, 1985, 230, 820–822 CAS.
- J. M. Gould, Biotechnol. Bioeng., 1985, 27, 225–231 CrossRef CAS PubMed.
- J. M. Gould and S. N. Freer, Biotechnol. Bioeng., 1984, 26, 628–631 CrossRef CAS PubMed.
- D. P. Maurya, A. Singla and S. Negi, Biotech., 2015, 5, 597–609 Search PubMed.
- R. J. Stoklosa, P. O. A. Del, C. S. L. Da, N. Uppugundla, D. L. Williams, B. E. Dale, D. B. Hodge and V. Balan, Bioresour. Technol., 2017, 226, 9–17 CrossRef CAS PubMed.
- Y. C. Park and J. S. Kim, Energy, 2012, 47, 31–35 CrossRef CAS.
- R. Sharma, V. Palled, R. R. Sharma-Shivappa and J. Osborne, Appl. Biochem. Biotechnol., 2013, 169, 761–772 CrossRef CAS PubMed.
- Y. Jin, T. Huang, W. Geng and L. Yang, Bioresour. Technol., 2013, 137, 294–301 CrossRef CAS PubMed.
- Y. Chen, M. A. Stevens, Y. Zhu, J. Holmes and H. Xu, Biotechnol. Biofuels, 2013, 6, 8 CrossRef CAS PubMed.
- G. Banerjee, S. Car, J. S. Scott-Craig, D. B. Hodge and J. D. Walton, Biotechnol. Biofuels, 2011, 4, 16 CrossRef CAS PubMed.
- J. M. Gould, Biotechnol. Bioeng., 1984, 26, 46–52 CrossRef CAS PubMed.
- G. D. Saratale and M. Oh, RSC Adv., 2015, 5, 97171–97179 RSC.
- Z. Yuan, Y. Wen and N. S. Kapu, Bioresour. Technol., 2018, 247, 242–249 CrossRef CAS PubMed.
- L. J. Jonsson and C. Martin, Bioresour. Technol., 2016, 199, 103–112 CrossRef PubMed.
- J. H. P. Utley, in Topics in Current Chemistry, ed. E. Steckhan, Springer, Berlin, 2005, pp. 131–165 Search PubMed.
- S. K. Green, J. Lee, H. J. Kim, G. A. Tompsett, W. B. Kim and G. W. Huber, Green Chem., 2013, 15, 1869–1879 RSC.
- N. Singh, Y. Song, O. Y. Gutiérrez, D. M. Camaioni, C. T. Campbell, J. A. Lercher and M. Abdelrahim, ACS Catal., 2016, 6, 7466–7470 CrossRef CAS.
- C. H. Lam, C. B. Lowe, Z. Li, K. N. Longe, J. T. Rayburn, M. A. Caldwell, C. E. Houdek, J. B. Maguire, C. M. Saffron and D. J. Miller, Green Chem., 2015, 17, 601–609 RSC.
- Z. Li, M. Garedew, C. H. Lam, J. E. Jackson, D. J. Miller and C. M. Saffron, Green Chem., 2012, 14, 2540–2549 RSC.
- Z. Li, S. Kelkar, C. H. Lam, K. Luczek, J. E. Jackson, D. J. Miller and C. M. Saffron, Electrochim. Acta, 2012, 64, 87–93 CrossRef CAS.
- Z. Li, S. Kelkar, L. Raycraft, M. Garedew, J. E. Jackson, D. J. Miller and C. M. Saffron, Green Chem., 2014, 16, 844–852 RSC.
- H. J. Kim, J. Lee, S. K. Green, G. W. Huber and W. B. Kim, Chemsuschem, 2014, 7, 1051–1056 CrossRef CAS PubMed.
- Y. Kwon, S. C. Lai, P. Rodriguez and M. T. Koper, J. Am. Chem. Soc., 2011, 133, 6914–6917 CrossRef CAS PubMed.
- J. C. Yu, M. M. Baizer and K. Nobe, J. Electrochem. Soc., 1988, 135, 83–87 CrossRef CAS.
- K. Uneyama, A. Isimura, K. Fujii and S. Torii, Tetrahedron Lett., 1983, 24, 2857–2860 CrossRef CAS.
- C. Carpetis, Int. J. Hydrogen Energy, 1982, 7, 287–310 CrossRef CAS.
- W. Fan, C. Chen, H. Bai, B. Luo, H. Shen and W. Shi, Appl. Catal., B, 2016, 195, 9–15 CrossRef CAS.
- A. Kudo and Y. Miseki, Chem. Soc. Rev., 2009, 38, 253–278 RSC.
- X. Chen, S. Shen, L. Guo and S. S. Mao, Chem. Rev., 2010, 110, 6503–6570 CrossRef CAS PubMed.
- Z. Zou, J. Ye, K. Sayama and H. Arakawa, Nature, 2001, 414, 625–627 CrossRef CAS PubMed.
- T. K. Sato, T. Liu, L. S. Parreiras, D. L. Williams, D. J. Wohlbach, B. D. Bice, I. M. Ong, R. J. Breuer, L. Qin, D. Busalacchi, S. Deshpande, C. Daum, A. P. Gasch and D. B. Hodge, Appl. Environ. Microbiol., 2014, 80, 540–554 CrossRef PubMed.
- A. Sluiter, B. Hames, R. Ruiz, C. Scarlata, J. Sluiter, D. Templeton and D. Crocker, Determination of Structural Carbohydrates and Lignin in Biomass, National Renewable Energy Laboratory (NREL), 2011 Search PubMed.
- M. G. Jackson, Anim. Feed Sci. Technol., 1977, 2, 105–130 CrossRef CAS.
- T. B. Vinzant, C. I. Ehrman, W. S. Adney, S. R. Thomas and M. E. Himmel, Appl. Biochem. Biotechnol., 1997, 62, 99–104 CrossRef CAS.
- C. A. Mooney, S. D. Mansfield, M. G. Touhy and J. N. Saddler, Bioresour. Technol., 1998, 64, 113–119 CrossRef CAS.
- S. I. Mussatto and I. C. Roberto, Bioresour. Technol., 2004, 93, 1–10 CrossRef CAS PubMed.
- M. H. Thomsen, A. Thygesen and A. B. Thomsen, Appl. Microbiol. Biotechnol., 2009, 83, 447–455 CrossRef CAS PubMed.
- S. Venkatesan, in Separation and Purification Technologies in Biorefineries, ed. S. Ramaswamy, H. Huang and B. V. Ramarao, John Wiley & Sons, Ltd, Hoboken, New Jersey, 2013, pp. 101–148 Search PubMed.
- E. Casey, M. Sedlak, N. W. Ho and N. S. Mosier, FEMS Yeast Res., 2010, 10, 385–393 CrossRef CAS PubMed.
- D. B. Hodge, C. Andersson, K. A. Berglund and U. Rova, Enzyme Microb. Technol., 2009, 44, 309–316 CrossRef CAS.
- Hydrogen Production: Electrolysis, http://energy.gov/eere/fuelcells/hydrogen-production-electrolysis, accessed 20 March 2017.
- K. Bullis, Cheap Hydrogen from Sunlight and Water, http://www.technologyreview.com/s/521671/cheap-hydrogen-from-sunlight-and-water/, accessed 22 April 2017 Search PubMed.
Footnote |
| † Current address: Energy and Transportation Sciences Division, Oak Ridge National Laboratory, 1 Bethel Valley Road, Oak Ridge, TN 37830, USA. |
| This journal is © The Royal Society of Chemistry 2017 |

