 Open Access Article
Long non-coding RNA MEG3 regulates proliferation and apoptosis in non-small cell lung cancer via the miR-205-5p/LRP1 pathway
Pei Wang†
 *,
Dong Chen†,
Hongbing Ma and
Yong Li
Department of Cardiothoracic Surgery, Huaihe Hospital of Henan University, No. 8 Baobei Road, Gulou District, Kaifeng 475000, China. E-mail: peigwang@yeah.net; Tel: +86-0371-23906599
First published on 25th October 2017
Abstract
Long non-coding RNA (lncRNA) MEG3 has been identified as a tumor suppressor in various cancers including non-small cell lung cancer (NSCLC). However, its molecular mechanisms in the development and progression of NSCLC have not been thoroughly elucidated until now. Here, we identified that the expression levels of MEG3 and miR-205-5p were respectively down-regulated and up-regulated in human NSCLC tissues and cells. Bioinformatics analysis, luciferase reporter assays, and RNA immunoprecipitation (RIP) assays combined with western blot assays further validated that MEG3 inhibited miR-205-5p expression via direct interaction. Function and mechanism analysis revealed that the exogenous expression of MEG3 hindered proliferation and induced apoptosis by acting as a miR-205-5p sponge to enhance low-density lipoprotein (LDL) receptor-related protein-1 (LRP1) expression in NSCLC. Moreover, a transplantation experiment demonstrated that MEG3 exerted an oncosuppressive effect via the miR-205-5p/LRP1 axis. Taken together, our study demonstrates that MEG3 represses tumorigenesis through regulating the miR-205-5p/LRP1 pathway in NSCLC.
1. Introduction
Lung cancer is categorized into two groups by the WHO according to its histological characteristics: non-small cell lung cancer (NSCLC) and small cell lung cancer (SCLC). NSCLC, representing 85% of all lung cancer cases, contains three major histology types: squamous cell carcinoma, large-cell carcinoma, and adenocarcinoma.1 It is estimated that lung cancer ranks second in all newly diagnosed cancer cases (14% in men and 13% in women) and it occupied the first position in cancer-related mortality in 2016 (27% in males and 26% in females).2 The 5-year survival rate for lung cancer patients is only 17.4%, and this declines further to about 2% for patients diagnosed at the metastatic stage.3 Thus, there is still an urgent need to explore the underlying molecular mechanism involved in NSCLC development to inform research into new and reliable therapeutic targets.Long non-coding RNAs (lncRNAs), a group of transcripts with lengths over 200 nucleotides (nts) and without protein coding potential, have attracted broad attention due to their regulatory functions in various diseases including cancers.4 LncRNA-targeted therapy for lung cancer has become a hot topic in recent years. For instance, some lncRNAs (such as MALAT1, CCAT2, HOTAIR, PVT1, UCA1 and AK126698) act as oncogenes to facilitate the progression of NSCLC, whereas other lncRNAs (such as MEG3, GAS6-AS1, GAS5, PANDAR and BANCR) serve as tumor suppressors to hamper the development of NSCLC.5,6 Maternally expressed gene 3 (MEG3), an imprinted gene located on human chromosome 14q32.3, is widely expressed in a variety of normal tissues. However, MEG3 expression is decreased in several cancers, probably triggered by gene deletion or promoter hypermethylation.7 MEG3 has been demonstrated to suppress tumorigenesis in several kinds of malignancies, including prostate cancer,8 breast cancer9 and cervical cancer.10 Also, MEG3 contributes to NSCLC progression via regulating cell proliferation, apoptosis, invasion, the epithelial-to-mesenchymal transition (EMT) and migration through different targets and signaling pathways.11–14 Nevertheless, the underlying molecular mechanisms for the effects of MEG3 in NSCLC have not been well elaborated until now.
MiRNAs have been indicated to be aberrantly expressed in lung cancer and involved in lung carcinogenesis.15 Numerous literature studies have reported contradictory findings relating to miR-205 in distinctive types of cancers,16 such as antioncogene activity in breast cancer17 and oncogene activity in endometrial cancer.18 In NSCLC, miR-205 was found to be up-regulated and to drive the development of malignant phenotypes.19,20 However, little is known about the interaction between MEG3 and miR-205-5p in NSCLC.
Here, we demonstrated that MEG3 expression was down-regulated and miR-205-5p expression was up-regulated in human NSCLC tissues and cells. Overexpression of MEG3 repressed cell growth and induced apoptosis by regulating miR-205-5p. Ectopic expression of miR-205-5p improved cell proliferation and suppressed apoptosis through targeting low-density lipoprotein (LDL) receptor-related protein-1 (LRP1). Moreover, MEG3 performed as a competing endogenous RNA (ceRNA) of miR-205-5p to enhance the expression of its target gene LRP1. All these data suggest a novel MEG3/miR-205-5p/LRP1 regulatory axis in NSCLC, providing a theoretical basis for the potential application of MEG3 in NSCLC therapy.
2. Materials and methods
2.1. Tissue collection and cell culture
NSCLC tissues and corresponding normal counterparts were obtained from 60 NSCLC patients receiving primary surgical resection at Huaihe Hospital. All tissue samples were immediately frozen in liquid nitrogen and then stored at −80 °C for RNA extraction. Our study gained the approval of the Research Ethics Committee of Huaihe Hospital and every patient signed the informed consent before surgery.NSCLC cell lines (A549, H1975, and H1299) and normal bronchial epithelial cell line 16HBE were obtained from the Institute of Biochemistry and Cell Biology of the Chinese Academy of Sciences (Shanghai, China). All cells were cultured in RPMI 1640 medium (Invitrogen, Carlsbad, CA, USA) supplemented with 10% fetal bovine serum (Invitrogen) and antibiotics, in humidified air with 5% CO2 at 37 °C.
2.2. Construction of stable MEG3-knockdown NSCLC cell lines
To generate stable MEG3-deficient NSCLC cells, sh-MEG3 sequences were designed and subcloned into pLKO.1 vectors. Then pLKO.1-sh-MEG3 plasmid was co-transfected with pspAX2 and pMD2.G into 293T cells to obtain sh-MEG3 lentivirus, which was subsequently used to infect A549 cells. A549 cells with the lentivirus infection were identified by screening with puromycin over 7 days. The surviving sh-MEG3-A549 cells were used to establish nude mice xenografts of NSCLC. The sh-MEG3 sequences were as follows: sh-MEG3, 5′-CCGGATAG AGGAGGTG ATCAGCAA ACTCGAGT TTGCTGAT CACCTCCT CTATTTTT TG-3′ (forward oligo), 5′-AATTCAAA AAATAGAG GAGGTGAT CAGCAAAC TCGAGTTT GCTGATCA CCTCCTCT AT-3′ (reverse oligo).2.3. Transient transfection
The MEG3 and LRP1 sequences were synthesized by PCR, subcloned into pcDNA3.1 empty vectors (Invitrogen), and named as pcDNA3.1-MEG3 (MEG3) and pcDNA3.1-LRP1 (LRP1), respectively. Small interfering RNA (siRNA) specifically targeting MEG3 (si-MEG3) and a matching siRNA control (si-NC), siRNA specifically targeting LRP1 (si-LRP1) and the corresponding siRNA control (si-NC), a miR-205-5p mimic (miR-205-5p) and scrambled control (miR-NC), and a miR-205-5p inhibitor (anti-miR-145-5p) and scrambled inhibitor control (anti-miR-NC) were all purchased from GenePharma Co., Ltd (Shanghai, China). All transfection assays were carried out using Lipofectamine 2000 reagent (Invitrogen) according to the manufacturer's instructions.2.4. Western blot assays
Total protein was obtained from NSCLC cells or tissues using pre-cooled RIPA buffer (Beyotime, Shanghai, China) containing a protease inhibitor cocktail (Roche, Basle, Switzerland). Total protein (50 μg) was separated by SDS-PAGE gels, transferred to PVDF membranes (Millipore, Bedford, MA, USA) and incubated with appropriate concentrations of antibodies against P53, P21, LRP1, cleaved caspase-3 and β-actin (Santa Cruz Biotechnology, Dallas, TX, USA). The membranes were then probed with horseradish peroxidase (HRP)-conjugated secondary antibodies. The protein signal was enhanced for 5 min using the Pierce™ ECL Western Blotting Substrate (Thermo Scientific, Waltham, Massachusetts, USA) and visualized by Quantity One 4.1 (Bio-Rad Laboratories, Hercules, CA). The gray values analysis of protein bands was performed using Image J software.2.5. qRT-PCR assays
The total RNA in tissues and cells was extracted by TRIzol reagent (Invitrogen) following the manufacturer's protocols. Then the total RNA was used as the template to synthesize cDNA first strands using PrimeScript RT reagent kits (Perfect Real Time; Takara, Tokyo, Japan). SYBR Premix Ex Taq kit (TaKaRa) was employed to detect the MEG3 expression levels with GAPDH as an endogenous control. The quantitative analysis of miR-205-5p was performed using a mirVana™ qRT-PCR miRNA Detection Kit (Thermo Fisher Scientific, Waltham, MA, USA) and U6 snRNA served as the internal reference to normalize miR-205-5p expression. The qPCR primer sequences were as follows: MEG3, 5′-CTGCCCATCTACACCTCACG-3′ (forward) and 5′-CTCTCCGCCGTCTGCGCTAGGGGCT-3′ (reverse); GAPDH, 5′-GTCAACGGATTTGGTCT GTATT-3′ (forward) and 5′-AGTCTTCTGGGTGGCAGTGAT-3′ (reverse); miR-205-5p, 5′-TCCACCGGAGTCTGTCTCAT-3′ (forward) and 5′-GCTGTCAACGATACGCTACG-3′ (reverse); U6, 5′-CTCGCTTCGGCAGCACA-3′ (forward) and 5′-AACGCTTCACGAATTTGCGT-3′ (reverse); LRP1, 5′-CACCTTAACGGGAGCAATGT-3′ (forward) and 5′-GTCACCCCAGTCTGTCCAGT-3′ (reverse); P21, 5′-GTGGACCTGTCACTGTCTT-3′ (forward) and 5′-GCGTTTGGAGTGGTAGAAATC-3′ (reverse); P53, 5′-TCAGTCTACCTCCCGCCATA-3′ (forward) and 5′-TTACATCTCCCAAACATCCCT-3′ (reverse).2.6. RNA immunoprecipitation (RIP) assays
RIP assays were carried out using the Magna RIP RNA-Binding Protein Immunoprecipitation Kit (Millipore) on the basis of the manufacturer's instructions. Briefly, A549 cells were harvested and lysed with RIP lysis buffer containing protease inhibitor cocktail (Roche). Then the cell supernatants were incubated with magnetic beads conjugated with antibody against Ago2 (Abcam, Cambridge, MA, USA) and IgG (Millipore) for 2 h at 4 °C. Following this, RNase-free DNase I and Proteinase K were consecutively used to remove DNA and protein in the RIP complex. The gained RNA was subjected to qRT-PCR in order to detect the enrichment patterns of MEG3 and miR-205-5p.2.7. Luciferase reporter assays
The MEG3 fragment or LRP1-3′UTR region containing wild-type or mutant-type miR-205-5p binding sites were amplified from human genomic DNA and then inserted into psiCHECK-2 luciferase reporter vectors (Promega, Madison, WI, USA), generating WT-MEG3, MUT-MEG3, WT-LRP1-3′ UTR and MUT-LRP1-3′ UTR reporter plasmids. These luciferase reporter plasmids were respectively co-transfected with miR-NC or miR-205-5p into A549 and H1975 cells. Cells were harvested 48 h after transfection for luciferase activity analysis using a dual luciferase reporter assay kit (Promega) following the manufacturer's protocols.2.8. Flow cytometry assays
At 48 h after transfection, apoptotic rates were analyzed by FACSan flow cytometry (Becton Dickinson, Franklin Lakes, NJ, USA) using AnnexinV-FITC/PI Apoptosis Detection Kits (Becton Dickinson). To assess the cell cycle distribution, cells were also treated with propidium iodide (PI) using CycleTEST™ PLUS DNA reagent kits (Becton Dickinson) and then analyzed by FACSan flow cytometry (Becton Dickinson).2.9. XTT assays
Cell proliferation was evaluated using the Cell Proliferation Kit II (XTT; Roche Molecular Biochemicals, Mannheim, Germany). Briefly, transfected cells were plated in 96-well plates and maintained in complete medium. Cell viability was detected at the indicated time points (0, 24, 48, 72 h) following the manufacturer's directions.2.10. Tumor formation in BALB/c nude mice
Male BALB/c athymic nude mice (4–6 weeks old) were obtained from Hubei Research Center of Laboratory Animal (Wuhan, China). All manipulations on mice were performed according to the Guide for the Care and Use of Laboratory Animals of Huaihe Hospital. To construct the NSCLC xenograft model, 8 × 10⁶ A549 cells (NC), or sh-MEG3-A549 cells (sh-MEG3) were subcutaneously injected into the posterior flanks of the nude mice. The mice were separated into 4 groups: NC, sh-MEG3, anti-miR-205-5p (isolated from the NC group), and sh-MEG3 + anti-miR-205-5p (separated from the sh-MEG3 group). The miR-205-5p inhibitor (anti-miR-205-5p) was injected into the implanted tumors once every 4 days in the relevant groups (anti-miR-205-5p, and sh-MEG3 + anti-miR-205-5p) starting 8 days after transplantation. The tumor volumes were measured with calipers. The tumors were excised, weighted, and harvested for western blot analysis on day 36.2.11. Statistical analyses
Each experiment was repeated at least three times and the data are presented as mean ± standard deviation (SD). A Student's t-test or one-way ANOVA was used to assess the significance of differences between groups. P < 0.05 represented a statistically significant difference.3. Results
3.1. MEG3 expression was down-regulated and miR-205-5p expression was up-regulated in human NSCLC tissues and cells
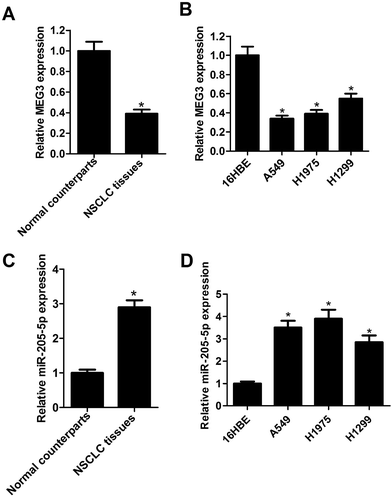
Firstly, the expression patterns of MEG3 and miR-205-5p in human NSCLC tissues and cells were assessed by qRT-PCR assays. As shown in Fig. 1A and C, the mean expression levels of MEG3 were remarkably decreased, and miR-205-5p expression was significantly elevated in NSCLC tissues when compared with their matched adjacent normal lung tissues (data were obtained from 60 paired samples). As expected, lower expression of MEG3 was observed in the NSCLC cell lines (A549, H1975, H1299) when compared with the normal bronchial epithelial cell line 16HBE (Fig. 1B). On the contrary, the miR-205-5p expression level was strikingly up-regulated in the NSCLC cell lines when compared with 16HBE cells (Fig. 1D). Moreover, we assessed the association of MEG3 expression with clinicopathological parameters in NSCLC. The results showed that high expression of MEG3 was negatively correlated with tumor size (P = 0.023), lymph node metastasis (P < 0.001) and tumor, node and metastasis (TNM) stage (P = 0.027) (Table 1). All these data revealed that the dysregulation of MEG3 and miR-205-5p might play vital roles in the development of NSCLC.| Clinicopathological features | n | Relative MEG3 expression | ||
|---|---|---|---|---|
| High | Low | P-Valuea | ||
| a Chi-square test.b P < 0.05. | ||||
| Age | ||||
| ≤60 | 25 | 12 | 13 | 0.484 |
| >60 | 35 | 20 | 15 | |
![[thin space (1/6-em)]](https://www.rsc.org/images/entities/char_2009.gif) |
||||
| Gender | ||||
| Male | 43 | 18 | 25 | 0.714 |
| Female | 17 | 8 | 9 | |
![[thin space (1/6-em)]](https://www.rsc.org/images/entities/char_2009.gif) |
||||
| Histology | ||||
| Squamous cell carcinoma | 29 | 12 | 17 | 0.297 |
| Adenocarcinoma | 31 | 17 | 14 | |
![[thin space (1/6-em)]](https://www.rsc.org/images/entities/char_2009.gif) |
||||
| Tumor size | ||||
| ≤4 cm | 25 | 16 | 9 | 0.023b |
| >4 cm | 35 | 12 | 23 | |
![[thin space (1/6-em)]](https://www.rsc.org/images/entities/char_2009.gif) |
||||
| Site of tumor | ||||
| Right lung | 39 | 22 | 17 | 0.681 |
| Left lung | 21 | 13 | 8 | |
![[thin space (1/6-em)]](https://www.rsc.org/images/entities/char_2009.gif) |
||||
| Differentiation | ||||
| Well, moderate | 28 | 12 | 16 | 0.755 |
| Poor | 32 | 15 | 17 | |
![[thin space (1/6-em)]](https://www.rsc.org/images/entities/char_2009.gif) |
||||
| Lymph node metastasis | ||||
| Yes | 36 | 8 | 28 | <0.001b |
| No | 24 | 17 | 7 | |
![[thin space (1/6-em)]](https://www.rsc.org/images/entities/char_2009.gif) |
||||
| TNM stage | ||||
| I | 22 | 14 | 8 | 0.027b |
| II/III/IV | 38 | 13 | 25 | |
3.2. MEG3 acted as a molecular sponge for miR-205-5p
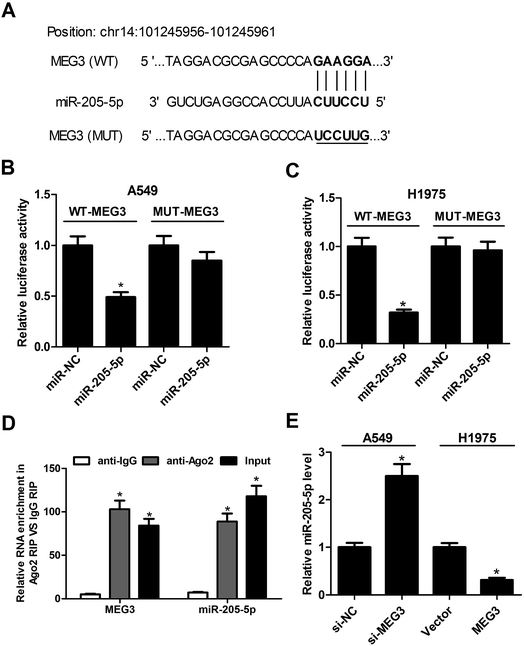
Recently, emerging evidence has indicated that lncRNAs can act as miRNA sponges to down-regulate expression. Therefore, bioinformatics prediction analysis was performed using the miRcode online website to figure out the potential target miRNAs of MEG3. The results showed that some complementary base pairing exists between MEG3 and miR-205-5p (Fig. 2A). To further confirm the prediction result, dual luciferase reporter assays were carried out by co-transfecting either the WT-MEG3 or the MUT-MEG3 luciferase reporter vector together with miR-NC or miR-205-5p into A549 and H1975 cells. The outcomes revealed that miR-205-5p overexpression prominently suppressed the luciferase activity of the WT-MEG3 reporter system, while it had no apparent impact on the luciferase activity of the MUT-MEG3 reporter system (Fig. 2B and C). It is well known that Ago2, a key component of the RNA-induced silencing complex (RISC), plays critical roles in the biogenesis and maturation of miRNAs.21 Therefore, potential miRNA targets can be separated and obtained from the complex by Ago2 co-immunoprecipitation.22 To assess whether or not MEG3 was associated with the RISC complex, a RIP assay with an Ago antibody was performed. As presented in Fig. 2D, MEG3 and miR-205-5p were substantially enriched in Ago2-containing beads compared with those harboring control IgG, indicating that endogenous binding might occur between MEG3 and miR-205-5p. To further investigate the specific regulatory effect of MEG3 on miR-205-5p, A549 cells were transfected with si-MEG3, and H1975 cells were transfected with pcDNA-MEG3. The results implied that the knockdown of MEG3 notably facilitated the expression of miR-205-5p in A549 cells, while MEG3 overexpression restrained the miR-205-5p level in H1975 cells (Fig. 2E). In summary, MEG3 could act as a sponge to directly inhibit miR-205-5p expression.3.3. Reintroduction of miR-205-5p partially reversed the effects of MEG3 on proliferation and apoptosis in NSCLC cells
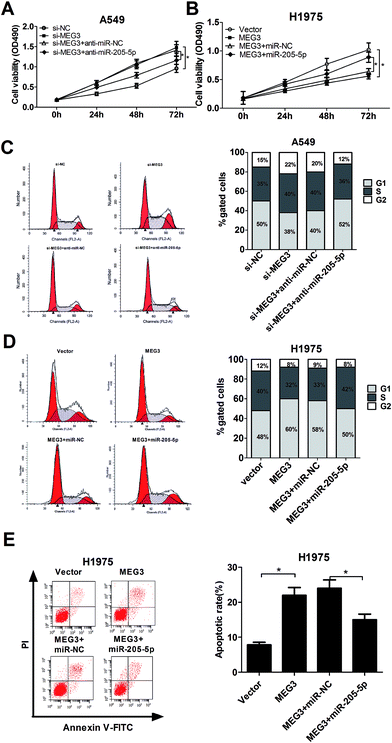
According to the above results, we concluded that MEG3 might influence NSCLC progression by modulating miR-205-5p. To verify our hypothesis, A549 cells were transfected with si-MEG3 with or without anti-miR-205-5p, and H1975 cells were transfected with pcDNA-MEG3 with or without miR-205-5p; analysis of cell proliferation, the cell cycle and apoptosis was then performed. XTT assays disclosed that MEG3 knockdown promoted A549 cell proliferation, and this effect was dramatically attenuated after co-transfection with anti-miR-205-5p (Fig. 3A). Conversely, MEG3 up-regulation hindered H1975 cell growth, which was obviously abated by miR-205-5p overexpression (Fig. 3B). To examine whether or not the effect of MEG3 on NSCLC cell growth was associated with cell cycle regulation, cell cycle progression was analyzed with flow cytometry. As presented in Fig. 3C, MEG3 knockdown resulted in an apparent decrease in the proportion of cells in the G1 phase and an evident increase in the S-phase cell proportion in A549 cells, whereas transfection of anti-miR-205-5p significantly reversed the promotive effect of si-MEG3 on cell cycle progression. In contrast, H1975 cells overexpressing MEG3 exhibited a higher percentage of cells in the G1 phase and a lower percentage of cells in the S phase, and ectopic expression of miR-205-5p weakened the cell cycle arrest induced by MEG3 (Fig. 3D). To further investigate whether or not MEG-induced growth inhibition was mediated by cell apoptosis, flow cytometry analysis was performed to measure the apoptotic rate in H1975 cells transfected with either pcDNA-MEG3 alone, or in combination with the miR-205-5p mimic. The results indicated that MEG3 overexpression greatly enhanced the apoptotic rate, however, the reintroduction of miR-205-5p partly lowered the pro-apoptotic effect of MEG3 (Fig. 3E). All of these results indicated that MEG3 might exert its tumor suppressive function partially by modulating miR-205-5p.3.4. LRP1 was a direct target of miR-205-5p
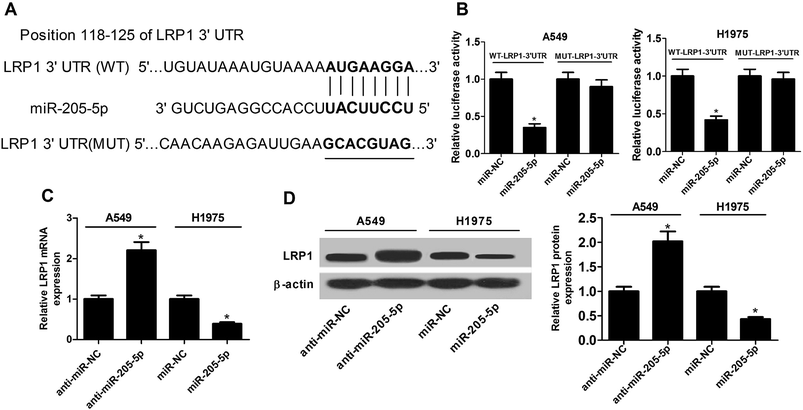
As is well-known, miRNAs exert functions via interactions with the 3′-UTR of target mRNA. Consequently, the TargetScan online website was employed to search for potential targets of miR-205-5p. The results revealed that the LRP1-3′-UTR has some complementary base pairing with the seed region of miR-205-5p (Fig. 4A). Next, luciferase reporter assays were used to assess whether or not LRP1 was indeed regulated by miR-205-5p. The results showed that the up-regulation of miR-205-5p suppressed luciferase activity in A549 and H1975 cells transfected with reporter plasmid containing the WT-LRP1-3′-UTR compared with the miR-NC group, whereas no significant difference was observed for the reporter plasmid carrying MUT-LRP1-3′-UTR between the miR-205-5p group and the miR-NC group (Fig. 4B). Then, the effect of miR-205-5p on LRP1 expression at the mRNA and protein levels was explored in A549 and H1975 cells. The results revealed that suppressing miR-205-5p in A549 cells enhanced LRP1 expression at the mRNA (Fig. 4C) and protein (Fig. 4D) levels, and up-regulating miR-205-5p in H1975 cells diminished the mRNA (Fig. 4C) and protein (Fig. 4D) expression of LRP1. Collectively, our findings suggested that miR-205-5p inhibited LRP1 expression by directly targeting the 3′-UTR of LRP1.3.5. miR-205-5p exerted an oncogenic function partially through down-regulation of LRP1
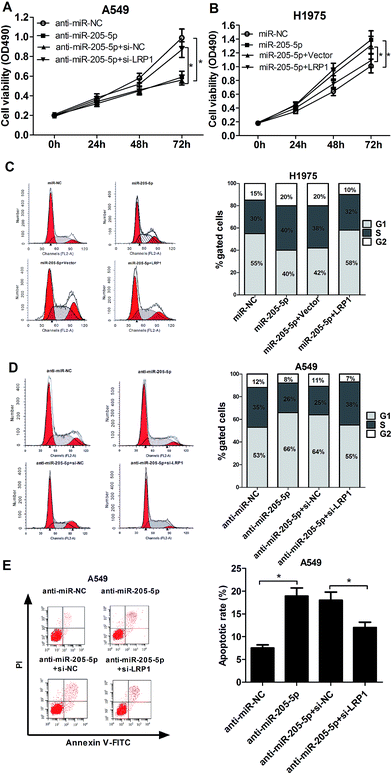
Due to the fact that miR-205-5p inhibited LRP1 expression, we further investigated the effect of miR-205-5p on NSCLC development, as well as its possible molecular mechanism. A549 cells were transfected with anti-miR-205-5p with or without si-LRP1, and H1975 cells were transfected with miR-205-5p with or without pcDNA-LRP1. XTT assays revealed that the transfection of anti-miR-205-5p significantly blocked cell proliferation, but this effect was largely abolished following LRP1 knockdown (Fig. 5A). Inversely, overexpression of miR-205-5p strikingly improved cell growth, and restoration of LRP1 expression notably suppressed this miR-205-5p-mediated pro-proliferative effect on H1975 cells (Fig. 5B). Flow cytometry assays elucidated the down-regulation of the miR-205-5p induced cell cycle arrest (Fig. 5C) and apoptosis (Fig. 5E) in A549 cells, while these effects were substantially retarded after suppressing LRP1 expression. Moreover, enforced expression of miR-205-5p promoted cell cycle progression in H1975 cells, whereas overexpressing LRP1 greatly lessened this effect (Fig. 5D). All these data supported the hypothesis that miR-205-5p contributed to NSCLC tumorigenesis partially via the inhibition of LRP1.3.6. MEG3 up-regulated LRP1 and P53 expression by acting as a sponge for miR-205-5p in NSCLC cells
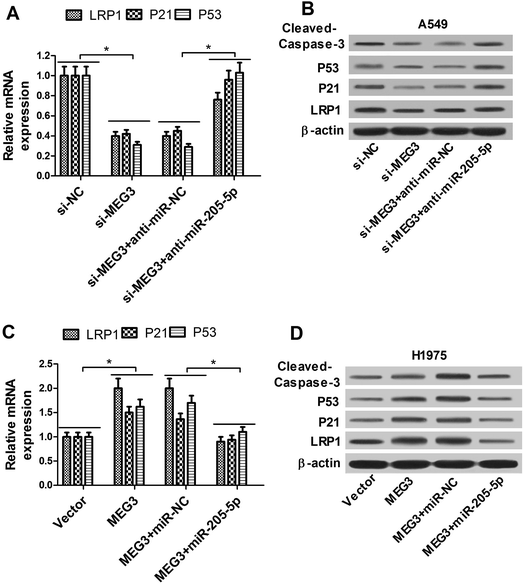
As demonstrated above, we assumed that MEG3 exerted its anti-tumor function partly through the miR-205-5p/LRP1 regulation pathway. A549 cells were transfected with si-MEG3 with or without anti-miR-205-5p, and H1975 cells were transfected with the MEG3 overexpression plasmid with or without the miR-205-5p mimic. qRT-PCR and western blot results demonstrated that knockdown of MEG3 inhibited LRP1 expression at the mRNA (Fig. 6A) and protein (Fig. 6B) levels, while introduction of anti-miR-205-5p relieved the si-MEG3-elicited decrease of LRP1 expression in A549 cells (Fig. 6A and B). In contrast, overexpression of MEG3 enhanced LRP1 expression at the mRNA (Fig. 6C) and protein (Fig. 6D) levels, while increased levels of miR-205-5p alleviated the promotion effect of MEG3 on LRP1 expression in H1975 cells (Fig. 6C and D). These data indicated that MEG3 up-regulated LRP1 expression via interacting with miR-205-5p. MEG3 has been reported as a tumor suppressor via activation of the P53 pathway.23,24 However, the molecular mechanism by which MEG3 activates P53 is still obscure, and it is unknown whether or not miRNAs are involved. Thus, we further evaluated the protein expression of P53, as well as its target gene P21 (a cyclin dependent kinase inhibitor) and cleaved-caspase-3 (a critical indicator of apoptosis). The results showed that the depletion of MEG3 markedly decreased P53 and P21 at the mRNA (Fig. 6A) and protein (Fig. 6B) levels and suppressed cleaved-caspase-3 protein expression (Fig. 6B), while these inhibition effects were partly reversed by down-regulating miR-205-5p in A549 cells (Fig. 6A and B). In contrast, enforced expression of MEG3 stimulated P53 and P21 at the mRNA (Fig. 6C) and protein (Fig. 6D) levels and induced cleaved-caspase-3 protein expression (Fig. 6D), while restoration of miR-205-5p expression partially abrogated these effects in H1975 cells (Fig. 6C and D). These data suggested that MEG3-induced P53 accumulation was mediated at least in part by down-regulating miR-205-5p.3.7. MEG3 blocked NSCLC tumor growth in vivo by regulating the miR-205-5p/LRP1 axis
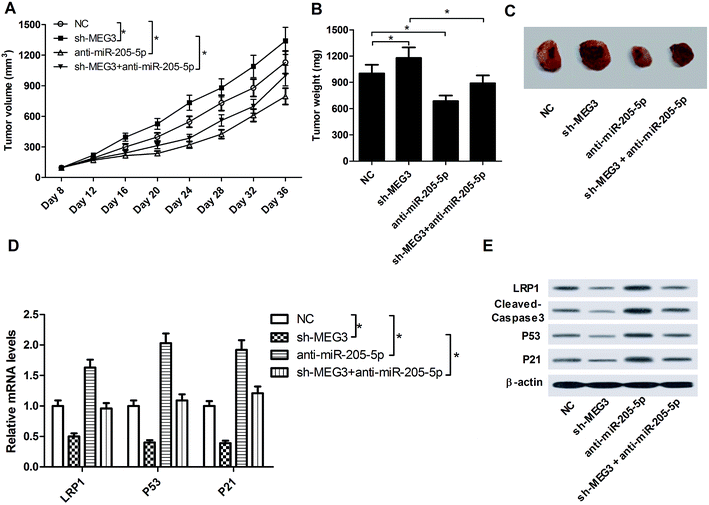
To investigate the effect of MEG3 on NSCLC tumorigenesis in vivo, A549 cells (NC) or sh-MEG3-transfected A549 cells were subcutaneously inoculated into nude mice. At the eighth day after implantation, the generated xenografts were injected with or without anti-miR-205-5p, and this was subsequently repeated once every 4 days. As shown in Fig. 7A–C, MEG3 knockdown strikingly facilitated tumor growth (compare the sh-MEG3 group with the NC group). On the other hand, anti-miR-205-5p injection significantly suppressed tumor growth. Moreover, the sh-MEG3-induced tumor growth was significantly repressed after introduction of anti-miR-205-5p. Furthermore, the expression patterns of LRP1, cleaved-caspase-3, P53 and P21 in excised tumor masses were detected by qRT-PCR and western blot assays. The results revealed that compared with the NC group, mRNA (Fig. 7D) and protein (Fig. 7E) levels of LRP1, P53 and P21 together with protein expression of cleaved-caspase-3 (Fig. 7E) were all down-regulated in tumors which originated from sh-MEG3 cells, whereas these proteins were all up-regulated following anti-miR-205-5p treatment. In addition, anti-miR-205-5p reversed the sh-MEG3-mediated inhibition of LRP1, cleaved-caspase-3, P53 and P21 expression. Collectively, all these results indicated that MEG3 exerted an anti-tumor function in NSCLC via the miR-205-5p/LRP1 axis in vivo.4. Discussion
Recent studies have revealed that lncRNAs play vital roles in the carcinogenesis and development of various cancers.25 MEG3 has been identified as a tumor suppressor and is expressed at lower levels in diverse cancers including NSCLC, colorectal cancer, prostate cancer and gastric cancer.13,26–28 Nevertheless, the mechanisms involving MEG3 in NSCLC have not been fully elucidated. In NSCLC, miR-205 was found to be up-regulated and to drive the development of malignant phenotypes.19,20 Moreover, bioinformatics analysis revealed that MEG3 might interact with miR-205-5p. Therefore, we aimed to further investigate whether or not MEG3 exerted its anti-cancer function by regulating miR-205-5p in NSCLC.Firstly, we assessed the expression patterns of MEG3 and miR-205-5p, and the results showed decreased MEG3 expression and increased miR-205-5p expression in human NSCLC tissues and cells. Bioinformatics analysis indicated that miR-205-5p had the potential to interact with MEG3, and this conclusion was further validated by dual luciferase reporter assays and RIP assays. Moreover, depletion of MEG3 promoted miR-205-5p expression in A549 cells, while up-regulation of MEG3 hampered miR-205-5p expression in H1975 cells. Functional and mechanistic studies revealed that MEG3 inhibited cell proliferation and cell cycle progression, and facilitated apoptosis by impeding miR-205-5p expression in NSCLC cells.
As is well-known, miRNAs exert functions by means of binding to the 3′-UTR of target mRNAs. The TargetScan online website combined with luciferase reporter analysis indicated that LRP1 was a direct target of miR-205-5p. LRP1 has been identified as a critical mediator in the progression of various cancers.29,30 For instance, LRP1 contributed to tumor development in glioblastoma,31 whereas LRP1 acted as a tumor suppressor in hepatocarcinoma.32 Also, a previous document identified that LRP1 expression was decreased and was positively correlated with favorable clinical outcomes in lung adenocarcinoma, indicating its oncosuppressive role in lung cancer.33 Here, we demonstrated that miR-205-5p promoted cell proliferation and cell cycle progression, and inhibited apoptosis, while these effects were partially reversed by LRP1 in NSCLC cells.
Recently, many researchers have favored a hypothesis that lncRNAs act as ceRNAs to isolate miRNAs like a “sponge”, which in turn gets rid of the inhibition effect of miRNAs on target mRNAs.34 Hence, western blot assays were performed to further validate that MEG3 overexpression and knockdown respectively enhanced and inhibited the expression of LRP1 in NSCLC cells. Furthermore, the reintroduction of anti-miR-205-5p and miR-205-5p attenuated the effects of si-MEG3 and pcDNA-MEG3, respectively, on LRP1 expression. These data indicated that MEG3 might serve as a sponge of miR-205-5p, leading to increased expression of LRP1. MEG3 has been shown to function as a tumor suppressor via interacting with P53 to activate P53-mediated transcriptional activity and affect the expression of partial P53 target genes in hepatoma cells,24 breast cancer35 and cervical cancer.10 Moreover, a previous study demonstrated that MEG3 inhibited cell proliferation and induced apoptosis in NSCLC by regulating P53 expression.13 Here, we further measured the expression profiles of P53, P21 and cleaved-caspase-3 by western blot assays in NSCLC cells. As expected, the results showed that MEG3 enhanced P53, P21 and cleaved-caspase-3 protein expression, while the introduction of miR-205-5p reversed this MEG3-elicited increase in P53, P21 and cleaved-caspase-3, indicating that miR-205-5p suppression may partly contribute to the P53 activation induced by MEG3. However, P53 was previously revealed to be able to directly bind to the upstream region of miR-205, causing the up-regulation of miR-205 expression in triple negative breast cancer.36 Therefore, more research is required to elaborate the detailed molecular mechanism of the interactions between MEG3, miR-205-5p and P53 in the progression of NSCLC. Subsequently, in vivo experiments found that MEG3 inhibited NSCLC tumor growth possibly via the miR-205-5p/LRP1 regulatory axis.
5. Conclusions
In conclusion, our findings revealed that MEG3 acted as a tumor suppressor to inhibit tumorigenesis and progression of NSCLC via the miR-205-5p/LRP1 axis, providing new evidence for molecular mechanisms involving MEG3 in NSCLC, and highlighting a potential therapy target for NSCLC.Authors' contributions
Pei Wang and Dong Chen designed and performed the experiments. Dong Chen and Hongbing Ma analyzed the data and wrote the manuscript. Pei Wang and Yong Li supervised the study and reviewed the manuscript.Conflicts of interest
There is no conflict of interest regarding the publication of this paper.References
- D. S. Ettinger, D. E. Wood, W. Akerley, L. A. Bazhenova, H. Borghaei, D. R. Camidge, R. T. Cheney, L. R. Chirieac, T. A. D'Amico and T. L. Demmy, J. Natl. Compr. Cancer Network, 2014, 12, 1738–1761 CrossRef.
- R. L. Siegel, K. D. Miller and A. Jemal, Ca-Cancer J. Clin., 2016, 66, 7–30 CrossRef PubMed.
- D. S. Ettinger, D. E. Wood, W. Akerley, L. A. Bazhenova, H. Borghaei, D. R. Camidge, R. T. Cheney, L. R. Chirieac, T. A. D'Amico and T. J. Dilling, J. Natl. Compr. Cancer Network, 2016, 14, 255–264 CrossRef.
- E. L. Mathieu, M. Belhocine, L. T. Dao, D. Puthier and S. Spicuglia, Med. Sci., 2014, 30, 790–796 Search PubMed.
- J. Chen, R. Wang, K. Zhang and L. B. Chen, J. Cell. Mol. Med., 2014, 18, 2425–2436 CrossRef CAS PubMed.
- B. Ricciuti, C. Mencaroni, L. Paglialunga, F. Paciullo, L. Crinò, R. Chiari and G. Metro, Med. Oncol., 2016, 33, 18 CrossRef PubMed.
- Y. Zhou, X. Zhang and A. Klibanski, J. Mol. Endocrinol., 2012, 48, R45–R53 CrossRef CAS PubMed.
- D. Hu, C. Su, M. Jiang, Y. Shen, A. Shi, F. Zhao, R. Chen, Z. Shen, J. Bao and W. Tang, Biochem. Biophys. Res. Commun., 2016, 471, 290–295 CrossRef CAS PubMed.
- C. Y. Zhang, M. S. Yu, X. Li, Z. Zhang, C. R. Han and B. Yan, Tumor Biol., 2017, 39, 1010428317701311 Search PubMed.
- J. Zhang, T. Yao, Y. Wang, J. Yu, Y. Liu and Z. Lin, Cancer Biol. Ther., 2016, 17, 104–113 CrossRef CAS PubMed.
- T. L. Kruer, S. M. Dougherty, L. Reynolds, E. Long, S. T. De, W. W. Lockwood and B. F. Clem, PLoS One, 2016, 11, e0166363 Search PubMed.
- M. Terashima, S. Tange, A. Ishimura and T. Suzuki, J. Biol. Chem., 2017, 292, 82–99 CrossRef CAS PubMed.
- K. H. Lu, W. Li, X. H. Liu, M. Sun, M. L. Zhang, W. Q. Wu, W. P. Xie and Y. Y. Hou, BMC Cancer, 2013, 13, 461 CrossRef PubMed.
- C. Jin, J. Li, D. Shi, P. Hua, G. Zhang and B. Wang, Int. J. Clin. Exp. Pathol., 2017, 10, 7144–7153 Search PubMed.
- Y. Jiang and L. Chen, Mol. Med. Rep., 2012, 5, 890–894 CrossRef CAS PubMed.
- H. Vosgha, A. Salajegheh, R. A. Smith and A. K. Lam, Curr. Cancer Drug Targets, 2014, 14, 621–637 CrossRef CAS PubMed.
- O. Elgamal, J. K. Park and T. D. Schmittgen, Cancer Res., 2013, 73, 4204 Search PubMed.
- C. Jin and R. Liang, J. Obstet. Gynaecol. Res., 2015, 41, 1653–1660 CrossRef CAS PubMed.
- J. Cai, L. Fang, Y. Huang, R. Li, J. Yuan, Y. Yang, X. Zhu, B. Chen, J. Wu and M. Li, Cancer Res., 2013, 73, 5402–5415 CrossRef CAS PubMed.
- H. Y. Lee, S. S. Han, H. Rhee, J. H. Park, J. S. Lee, Y. M. Oh, S. S. Choi, S. H. Shin and W. J. Kim, Mol. Med. Rep., 2015, 11, 2034–2040 CrossRef CAS PubMed.
- G. Hutvagner and M. J. Simard, Nat. Rev. Mol. Cell Biol., 2008, 9, 22–32 CrossRef CAS PubMed.
- F. V. Karginov, C. Conaco, Z. Xuan, B. H. Schmidt, J. S. Parker, G. Mandel and G. J. Hannon, Proc. Natl. Acad. Sci. U. S. A., 2007, 104, 192911–192916 CrossRef PubMed.
- Y. Zhou, Y. Zhong, Y. Wang, X. Zhang, D. L. Batista, R. Gejman, P. J. Ansell, J. Zhao, C. Weng and A. Klibanski, J. Biol. Chem., 2007, 282, 24731–24742 CrossRef CAS PubMed.
- J. Zhu, S. Liu, F. Ye, Y. Shen, T. Yi, J. Zhu, L. Wei, Y. Jin, H. Fu and Y. Wu, PLoS One, 2015, 10, e0139790 Search PubMed.
- M. Huarte, Nat. Med., 2015, 21, 1253–1261 CrossRef CAS PubMed.
- D. D. Yin, Z. J. Liu, E. Zhang, R. Kong, Z. H. Zhang and R. H. Guo, Tumor Biol., 2015, 36, 4851–4859 CrossRef CAS PubMed.
- G. Luo, M. Wang, X. Wu, D. Tao, X. Xiao, L. Wang, F. Min, F. Zeng and G. Jiang, Cell. Physiol. Biochem., 2015, 37, 2209–2220 CrossRef CAS PubMed.
- W. Peng, S. Si, Q. Zhang, C. Li, F. Zhao, F. Wang, J. Yu and R. Ma, J. Exp. Clin. Cancer Res., 2015, 34, 79 CrossRef PubMed.
- L. Lin and K. Hu, Int. J. Mol. Sci., 2014, 15, 22887–22901 CrossRef CAS PubMed.
- S. Dedieu and B. Langlois, Cell Adhes. Migr., 2008, 2, 77–80 CrossRef.
- H. Song, Y. Li, J. Lee, A. L. Schwartz and G. Bu, Cancer Res., 2009, 69, 879–886 CrossRef CAS PubMed.
- X. Y. Huang, G. M. Shi, R. P. Devbhandari, A. W. Ke, Y. Wang, X. Y. Wang, Z. Wang, Y. H. Shi, Y. S. Xiao and Z. B. Ding, PLoS One, 2012, 7, e32775 CAS.
- H. Meng, G. Chen, X. Zhang, Z. Wang, D. Thomas, T. Giordano, D. G. Beer and M. M. Wang, Clin. Cancer Res., 2011, 17, 2426–2433 CrossRef CAS PubMed.
- J. H. Yoon, K. Abdelmohsen and M. Gorospe, Semin. Cell Dev. Biol., 2014, 34, 9–14 CrossRef CAS PubMed.
- L. Sun, Y. Li and B. Yang, Biochem. Biophys. Res. Commun., 2016, 478, 323–329 CrossRef CAS PubMed.
- C. Piovan, D. Palmieri, G. D. Leva, L. Braccioli, P. Casalini, G. Nuovo, M. Tortoreto, M. Sasso, I. Plantamura and T. Triulzi, Mol. Oncol., 2012, 6, 458–472 CrossRef CAS PubMed.
Footnote |
| † These authors contributed equally to this work. |
| This journal is © The Royal Society of Chemistry 2017 |

