 Open Access Article
Creative Commons Attribution 3.0 Unported Licence
Endonuclease-like activity of the N-terminal domain of Euplotes octocarinatus centrin†
Wenlong Zhanga,
Enxian Shiab,
Yanan Fenga,
Yaqin Zhao a and
Binsheng Yang
 *a
*a
aKey Laboratory of Chemical Biology and Molecular Engineering of Ministry of Education, Insitute of Molecular Science, Taiyuan 030006, China. E-mail: yangbs@sxu.edu.cn; Tel: +86-351-7016358
bDepartment of Pharmacy, Shanxi Medical University, Taiyuan 030006, China
First published on 7th November 2017
Abstract
Euplotes octocarinatus centrin (EoCen) is a member of the EF-hand superfamily of calcium-binding proteins, which refer to nucleotide excision repair (NER). However, the role of centrin in NER is not clear. To explore the possible role of centrin, we initiated a physicochemical study of the N-terminal domain of Euplotes octocarinatus centrin (N-EoCen) with DNA in the absence or presence of Ca(II) in 10 mM Hepes at pH 7.4. N-EoCen shows unusual affinity for double-stranded DNA. The interaction results in the protein exposing more hydrophobic surface along with a certain perturbation taking place in the double helix structure. Interestingly, N-EoCen exhibits endonuclease-like activities via a hydrolysis pathway, which induces DNA strand breaks, such as supercoiled DNA into nicked circular and linear DNA. Importantly, mutation of serine (Ser) and threonine (Thr) to alanine (Ala) demonstrates that Ser and Thr, in particular Ser located at 22 (Ser22), may be the key residues responsible for DNA cleavage activity. The coordination of apoN-EoCen with Ca(II) can promote the binding to DNA and raise the cleavage activities. In contrast, the binding to Ca(II) of mutant proteins may trigger a conformational change so that the cleavage activity decreases dramatically, as confirmed by protein hydrolysis activity experiments. This is first report of the endonuclease-like activity of centrin, which provides valuable information for understanding a novel property of centrin, as well as knowledge of the functional diversity of centrin.
1 Introduction
Interaction between protein and nucleic acid is the basis of cell life, which relates to lots of crucial processes consisting of the regulation of gene expression, DNA replication and repair.1,2 Many techniques have been developed for the mapping of DNA–protein interaction.3–6 The interaction between protein and DNA involves van der Waals, hydrogen bonding, electrostatic and water-mediated interactions.7 Most of the interactions are nonspecific and related to the sugar-phosphate backbone of DNA,8 which provides stability to enhance the specific association rate by initially binding to DNA anywhere followed by intramolecular translocation to the specific binding site.9 For example, non-specific protein–DNA interactions control I-CreI target binding and cleavage.10 Sometimes specific base sequences also take part in the interactions. One classical example is Fe(II)-Fur, Fe(II)-dependent ferric uptake regulator, dimerizes and then binds to the specific sequence to repress gene transcription.11 Thus, nonspecific protein–DNA interaction is a critical intermediate step in the process of sequence-specific recognition and binding.12 Nonspecific reactions generally refer to a highly dynamic process, which the protein can bind to and readily move between multiple binding sites on the DNA.13Centrins are small, highly conserved members of the EF-hand superfamily of calcium-binding proteins that are found throughout eukaryotes.14 They are related to the Ca(II)-binding protein, calmodulin, their common structural and functional unit is the EF-hand motif. Ca(II) sensor EF-hand domains change conformation upon Ca(II) binding, from a closed to an open form.
The protein is mostly concentrated in the microtubule-organizing centers (MTOCs), functionally related to the regulation of the MTOC duplication, separation during the cell cycle, and the nuclear mRNA export machinery in yeast.15,16 Similarly with calmodulin being a calcium signal protein, a general view of how centrin works is that the binding of calcium facilitates target peptide recognition by the protein, with low-affinity peptide binding sites becoming activated in the presence of calcium, as in the case of Scherffelia dubia centrin.17 Moreover, the literature have suggested that dubia centrin forms extended filamentous structures in a calcium-dependent manner.17 Besides, calcium-binding capacity of centrin is required for linear POC5 assembly.18 Despite sharing similarity with calmodulins, centrin has mass different properties, such as self-assembly based on a disordered region of first 20 amino acids.19 Interestingly, aside from the roles of centrin in ciliogenesis and possible functions in centriole activities, there are several emerging questions on its functions in DNA repair. It was found that only 10% of the total centrin is localized in MTOCs.20 Centrin defective Arabidopsis plants are hypersensitive to UV-C and exhibit a reduced efficiency of DNA synthesis-dependent repair of UV induced DNA damage.21 Centrin-defcient cells of vertebrate are markedly sensitive to UV irradiation and require centrin for effcient DNA repair.22 centrin interacts directly with XP group C responsible gene product (XPC), and that centrin, in cooperation with human homologue of Rad23B (HR23B), stabilizes XPC, which stimulates NER activity in vitro.23–25 Namely. They are localised appropriately to the sites of DNA damage by XPC and in turn control XPC stability and function. These findings implicate centrins in a recognition process in NER away from the centrosome. However, the research about centrin-DNA direct interactions remain lacking. Understanding of centrin functions, and particularly the Ca(II) dependence,26 requires a detailed description of the molecular and structural properties of the isolated proteins and of their interactions with relevant cellular targets.
N-Terminal domain of Ciliate Euplotes octocarinatus centrin (N-EoCen), containing a pair of EF-hands referred to as site I and site II of 101 residues,27 exhibits a more compact conformation. N-EoCen can bind two Ca(II) with moderate affinity.27,28 The protein has three tyrosines (Tyr), located at position 46, 72, 79 respectively, which are considered as intrinsic fluorescence probes to monitor protein conformational changes, and intermolecular interactions. We therefore initiated a molecular and thermodynamic research aimed to determine the detailed N-EoCen and DNA binding parameters and Ca(II)-dependent functional properties of the N-EoCen.
In the present work, the N-EoCen–DNA complexes were examined by spectroscopy, polyacrylamide gel electrophoresis (native-PAGE), isothermal titration calorimetry (ITC) and DNA cleavage experiments. The data showed that N-EoCen binds to DNA with moderate affinities, and that it can cleave DNA in the absence or presence of Ca(II).
2 Experimental
2.1 Materials
4-(2-Hydroxyethyl)-1-piperazineethanesulfonic acid (Hepes), 2,6-p-toluidinonaphthalene sulfonate (TNS), bromophenol blue, Coomassie brilliant blue R-250, pBR322 DNA and calf thymus DNA (CT-DNA) were purchased from Sigma. The chemicals and the proteins are of the highest commercially available purity. Ethidium bromide (EB) was from Molecular Probes and 4-nitrophenyl acetate (4NPA) from acros organics. Calcium chloride (CaCl2) was purchased from Sangon Biotech from Shanghai in China. The solution of TNS was prepared by dissolving weighed samples. In this study, we considered the concentration of base pairs (bp) of the DNA to be the overall concentration of DNA excluding the calculation of binding constant studies where the concentration of DNA was estimating by the concentration of base pairs divided by 1402 (GenBank: J00037.1). The filtered DNA solution gave an ultraviolet (UV) absorbance ratio (A260/A280) of 1.92, indicating that DNA was sufficiently free from protein.29 The concentration of bp was determined from the absorption at 260 nm (ε260 = 6600 M−1 cm−1, T = 298 K). All experiments were carried out in Hepes buffer at pH 7.4. Protein preparation and the measurement of protein concentration were detailed in our previous work.27 SA N-EoCen gene which Ser (serine) located at 22 and 43 are replaced by Ala (alanine), TA N-EoCen gene which Thr (threonine) located at 38, 41 and 90 are replaced by Ala, and STA N-EoCen gene which all Ser and Thr are replaced by Ala were synthesized by Sangon Biotech in Shanghai of China. The mutation proteins were confirmed by DNA sequencing assay. Mutation proteins were expressed and purified using the same procedure as that for apoN-EoCen.2.2 CD measurements
CD measurements were performed with an MOS 450 (BioLogic, France) spectropolarimeter. All spectra were the average of three scans with a step size of 0.2 nm and a band width of 1 nm. CD spectra were recorded between 200 and 320 nm using 1 cm path length quartz cells. All experiments were done at room temperature in Hepes (pH 7.4).2.3 Native polyacrylamide gel electrophoresis (native-PAGE)
Different concentrations of CT-DNA, N-EoCen and 2 mM Ca(II) (only the reaction was performed in the presence of Ca(II)) were incubated in Hepes (10 mM, pH 7.4), at 4 °C for 12 h. Then loading buffer (1/5 volume) consisting of 50% glycerol, 0.5% bromophenol blue, was supplemented to the sample completed before electrophoresis. Samples were analyzed in 15% native polyacrylamide gel (acrylamide/bis-acrylamide = 29![[thin space (1/6-em)]](https://www.rsc.org/images/entities/char_2009.gif) :
:![[thin space (1/6-em)]](https://www.rsc.org/images/entities/char_2009.gif) 1) containing tris-glycine buffer at the constant potential 80 V. Positions of protein was visualized by staining with Coomassie brilliant blue R-250 staining solution (0.25% Coomassie brilliant blue R-250, 45% methyl alcohol, 10% glacial acetic acid) using ZHGP-70I film illuminator from ProteinSimple.
1) containing tris-glycine buffer at the constant potential 80 V. Positions of protein was visualized by staining with Coomassie brilliant blue R-250 staining solution (0.25% Coomassie brilliant blue R-250, 45% methyl alcohol, 10% glacial acetic acid) using ZHGP-70I film illuminator from ProteinSimple.
2.4 Fluorescence lifetime and time-resolved anisotropy
Fluorescence lifetimes and time-resolved anisotropy decays measurements were detailed in previous work.30 Fluorescence decays, I(t), were measured in 10 mM Hepes, pH 7.4, at 25 °C. The excitation wavelength and emission wavelength are 280 nm and 306 nm, respectively. The fluorescence decay of Tyr was analyzed using a sum of exponentials: I(t) = ∑Bi![[thin space (1/6-em)]](https://www.rsc.org/images/entities/char_2009.gif) exp(−t/τi), where Bi and τi are the amplitude and lifetime, respectively.
exp(−t/τi), where Bi and τi are the amplitude and lifetime, respectively.
2.5 DNA melting
DNA melting experiments were performed in 1 cm quartz cells using a Varian-Cary Eclipes UV-Vis spectrophotometer. Samples were continuously heated with a 5 °C interval of temperature increase while monitoring the absorbance changes at 260 nm. The investigated interval of temperature ranged from 5 to 90 °C.2.6 Spectrofluorimetric methods
Steady-state emission of TNS and EB were measured with a Varian-Cary Eclipse fluorescence and HORIBA Scientific Fluoromax-4 spectrometer, respectively. The protein and CT-DNA mixed solution was equilibrated for 10 min before addition of TNS or EB. The excitation wavelength was set at 320 nm for TNS and 488 nm for EB. The excitation and emission slits were both 5 nm. In the fluorescence titrations experiments, the DNA binding affinity for N-EoCen was measured by monitoring the fluorescence intensity of Tyr. The fluorimetric titrations experiments were carried out in Hepes (pH 7.4) by keeping the concentration of N-EoCen as constant (10 μM) and varying the concentration of CT-DNA (0–0.45 mM). The protein and CT-DNA mixed solution was equilibrated for 10 min. Spectra were collected on a Cary Eclipse spectrofluorimeter, with excitation at 280 nm. Emission was recorded in the range from 285 to 500 nm. The excitation and emission slits were both 10 nm. Binding constant (Ka) and binding stoichiometry (n) of the CT-DNA to N-EoCen was determined from the eqn (1)
 | (1) |
2.7 ITC titrations
ITC experiments were performed at 298 K using a MicroCal ITC200 device (GE Healthcare Life Sciences). The instrument consists of one sample cell and one reference cell. The reference cell was filled with ultrapure water. 300 μL of protein solution (0.06 mM) was deposited in the sample cell during a typical titration, with stirring at 750 rpm. 1 μL of CT-DNA solution (0.8 mM) was injected at equal 300 s intervals into sample cell (0.4 μL on the first injection). In total, 30.4 μL of CT-DNA solution was added to protein solution. The heat effects due to dilution and mixing were assessed by injecting CT-DNA solution into buffer under the same conditions, and these values were subtracted from the effects produced by the CT-DNA–protein interaction. The heat released by dilution of protein was little and thus neglected. Calorimetric analyses were carried out with “one set of sites” of the Origin™ fitting package.2.8 Cleavage of pBR322 DNA
The cleavage reaction of pBR322 DNA was carried out in the mixture containing 0.025 μg μL−1 of plasmid in 10 mM Hepes buffer (pH 7.4) with various concentrations of proteins. Total reaction volume was 20 μL. Samples were incubated for 2 h unless otherwise stated at room temperature. Soon afterwards, all samples were loaded on the 1% agarose gel, containing 4S Green Plus Nucleic Acid Stain. Electrophoresis was carried out at 110 V in 1× TAE (Tris–acetic–EDTA) buffer. Supercoiled DNA cleavage products, which were visible as bands on the agarose gel, were quantified and analyzed with Alpha Imager. The efficiency of the DNA cleavage was assessed by determining the ability of the species from the supercoiled form (Form I) to nick circular from (Form II) or linear forms (Form III), by quantitatively estimating the intensities of appropriate bands using the GeneTools software (Alpha Imager).Additionally to standard conditions of pBR322 DNA cleavage, some reactions were performed in the presence of several inhibitors, which were included into reaction mixture before apoN-EoCen addition.
2.9 T4-ligase religation assay
The nicked circular and liner forms of pBR322DNA cleavage products by apoN-EoCen and endonuclease BamH I were isolated and purified using Easypure quick Gel Extraction Kit (TransGen biotech). Then the isolated DNA cleavage products were incubated with T4-ligase and ligation buffer for 15 h at 16 °C for ligation reaction. Afterwards, the ligation products were electrophoresed, stained and imaged.2.10 Hydrolysis activity assay
The hydrolysis activities of different protein were evaluated by using 4-nitrophenyl acetate (4NPA) as a substrate. Kinetic experiments were initiated by the addition of 4NPA to a solution containing 5 μM protein in 10 mM Tris–HCl (pH 7.0) at 25 °C. The hydrolysis product of 4-nitrophenoxide was monitored by absorption increase at 400 nm with a Varian-Cary Eclipes UV-Vis spectrophotometer. Spontaneous hydrolysis of 4NPA was also monitored in 10 mM pH 7.0 Tris–HCl buffer. The initial rates were determined from linear fits of the absorbance versus time and observed rate constants (kobs) calculated using an extinction coefficient of ε400 = 18.3 mM−1 cm−1 (ref. 33–35) and protein concentration. The kinetic parameters (kcat and Km) were determined by fitting the curves of kobs versus the concentration of 4NPA to the Michaelis–Menten eqn (2)36
 | (2) |
It was revised by the spontaneous hydrolysis of 4NPA.
2.11 Molecular docking studies
All docking studies were carried out with ZDOCK 3.0.2 (http://zdock.umassmed.edu).37–39 The crystal structures of DNA duplex (PDB:2k0v), apoN-EoCen (PDB:2joj) and modeled holoN-EoCen were obtained from PDB. Prediction of possible complexes using the server proceeds in three steps. Firstly, on the initial submission page, users provide two input structures to be docked. The next step is selection of residues for each submitted crystal structures, which is aided by JMol visualization of each molecule that highlights selected residues for the user. Finally, a link to the results is emailed to users.2.12 Statistical analysis
All experiments were performed in triplicate (n = 3) to ensure accuracy and reliability of the results. In the quantitative evaluations, the results were presented considering the mean value and the respective standard deviation (SD) of three independent experiments. The linear regression analyses for eqn (1) and (2) were performed at a 96% confidence interval using the software Sigma Plot 10.0.3 Results and discussion
3.1 Binding of N-EoCen and DNA
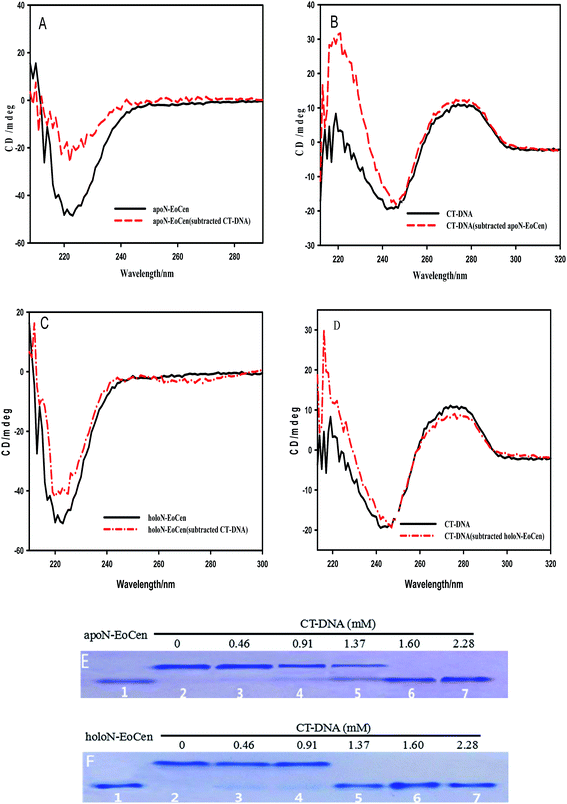
CD provides a rather convenient method for the determination of the structural changes environmentally induced in proteins based on the different forms of the primary secondary structural elements found in proteins (e.g., α-helix, β-sheet, and random loop).40 In order to investigate the interactions and any structural perturbation of the N-EoCen with CT-DNA, the CD spectroscopy was monitored. As seen from Fig. 1A, apoN-EoCen exhibits a negative CD signal at 222 nm, which is commonly used as quantifying α-helix of protein. In addition, CT-DNA in buffer (Fig. 1B), displays a negative CD signal at 244 nm and a positive CD signal at 277 nm that is characteristic of B-DNA structure.41 Upon mixing the two solutions, a dramatic difference in the shape and intensity between the subtraction spectra and single-component spectra is observed. In Fig. 1A, a drastic decrease is detected after addition CT-DNA into protein even if the CD profiles of apoN-EoCen in buffer remains essentially similar to that in the presence of CT-DNA. It suggests that a significant conformation change of protein induced by CT-DNA happens. Simultaneously, a strong variation of the CD profile of CT-DNA is displayed (Fig. 1B). In more detail, the negative peak at 244 nm shifts to 247 nm while the negative band becomes narrow, and the positive peak enhances in the presence of apoN-EoCen, suggesting that double helix structure changes a lot associated with the protein–DNA complex formation.
Based on our previous reports, the coordination with Ca(II) has less effects on the α-helix of apoN-EoCen,42 as seen in Fig. 1C. A slight increase in molar ellipticity at 222 nm is indicated after addition of Ca(II) into apoN-EoCen. Similarly to apoN-EoCen, holoN-EoCen also shows reduced α-helix content than that of holoN-EoCen alone, upon addition of CT-DNA (Fig. 1C). For CT-DNA in the presence of holoN-EoCen (Fig. 1D), the negative peak (244 nm) shifts as well as the band narrows. Beyond that, the positive band of DNA at 277 nm weakens after holoN-EoCen-CT–DNA complex formation, which may attribute to the binding of Ca(II) to CT-DNA. Therefore, we reasons that holoN-EoCen can also react with CT-DNA.
| τ1 (%) | τ2 (%) | 〈τ〉 | |
|---|---|---|---|
| a Bi, τi and 〈τ〉 are the amplitude (refer to the in parenthesis), lifetime and average lifetime, respectively. | |||
| apoN-EoCen | 1.08 ± 0.02 (51.28%) | 2.64 ± 0.03 (48.72%) | 1.84 ± 0.01 |
| apoN-EoCen–CT-DNA | 0.35 ± 0.02 (57.83%) | 1.80 ± 0.04 (38.24%) | 0.89 ± 0.02 |
| holoN-EoCen | 1.19 ± 0.04 (34.60%) | 2.78 ± 0.02 (65.40%) | 2.23 ± 0.01 |
| holoN-EoCen + CT-DNA | 0.31 ± 0.01 (56.43%) | 2.15 ± 0.07 (37.25%) | 0.98 ± 0.03 |
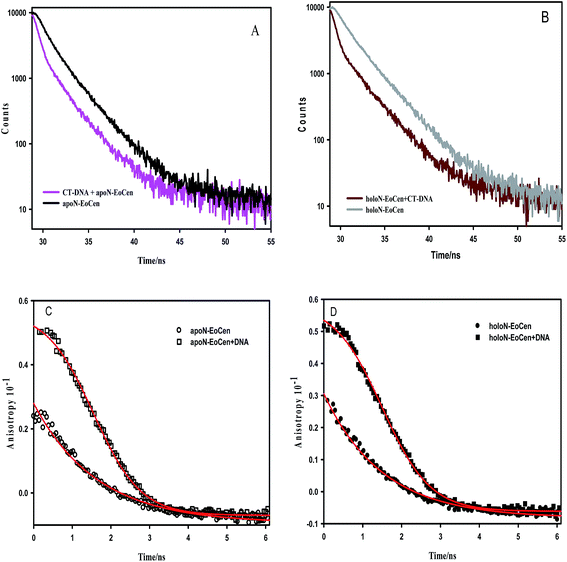
Just as the combination of calmodulin with calcium leads to α-helix orientation change and hydrophobic residues exposing to the solvent, holoN-EoCen also undergoes conformation change.46,47 As shown in the Table 1, the fluorescence average decay time of holoN-EoCen is (2.23 ± 0.01) ns. Upon adding to CT-DNA, the fluorescence average decay time of holoN-EoCen ((0.98 ± 0.03) ns) decreases by 56% (Fig. 2B), demonstrating that the local environment of Tyr in holoN-EoCen bound with CT-DNA changes more.
To further elucidate the interaction of protein and DNA, the fluorescence anisotropy was monitored. As shown in Fig. 2C, apoN-EoCen in the presence of CT-DNA has a relatively higher initial anisotropy value (0.051 ± 0.002) compared with that of apoN-EoCen (0.021 ± 0.001), reflecting that the considerable interaction of the protein with CT-DNA leads to the Tyr in protein not to easily rotation. As for holoN-EoCen–DNA complex, Tyr residue in protein also shows reduced rotational freedom (Fig. 2D).
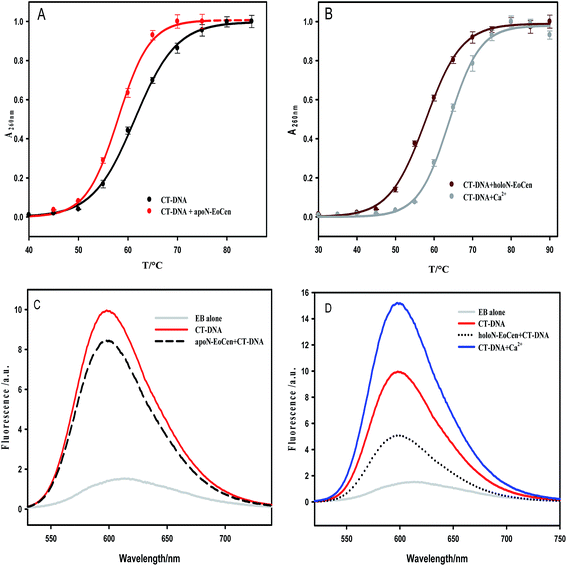
In Fig. S1b,† TNS fluorescence intensity increases more in the presence of holoN-EoCen than that of apoN-EoCen, which is in accordance with the early report.45 In other words, holoN-EoCen can expose more hydrophobic surface. CT-DNA–holoN-EoCen exhibits significant enhancement in TNS fluorescence intensity, which reveals that more hydrophobic surface is exposed because of DNA binding to holoN-EoCen. In brief, the interaction with DNA leads to holoN-EoCen unfolding more hydrophobic surface. It is may originated from that the open conformation induced by Ca(II) is closely related to the interaction of protein and DNA.
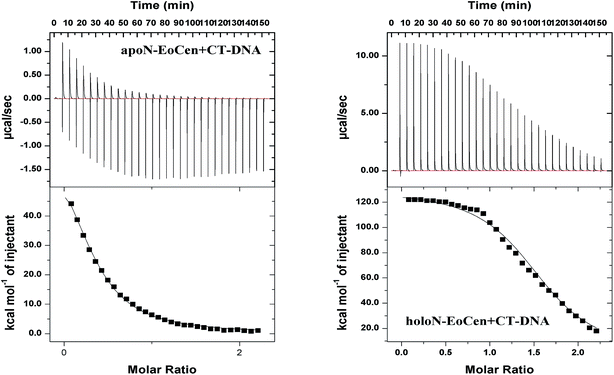
For the purpose of further understanding the binding nature between protein and DNA, the binding constants were calculated by using eqn (1) and listed in Table 2. The most notable result is that holoN-EoCen binds CT-DNA with a binding constant of 2.48 × 10⁶ M−1 at 298 K, about 8-fold tighter than that of apoN-EoCen. A plausible explanation is that the binding with Ca(II) render conformation of protein change from closed to open, which exactly contribute to the binding of protein to DNA. One binding site suggests that one protein molecular can bind with one DNA molecular.
| Protein | Temperature/K | Ka (M−1 × 10⁵) | n | ΔG (kJ mol−1) | ΔH (kJ mol−1) | ΔS (kJ mol−1 K−1) |
|---|---|---|---|---|---|---|
| a Data from spectrofluorimetric titrations.b Data from ITC titrations. | ||||||
| apoN-EoCen | 298 | 2.79 ± 0.2a | 0.962 ± 0.05a | −24.7 | 315 | 1.14 |
| 0.812 ± 0.4b | 0.998 ± 0.03b | |||||
| holoN-EoCen | 24.8 ± 0.1a | 1.07 ± 0.01a | −29.2 | 534 | 1.89 | |
| 2.22 ± 0.2b | 1.58 ± 0.01b | |||||
Together, all results obtained in the present study confirm that the formation of a protein–DNA complex arises possibly as a result of the interaction between the amino acid residues on the protein with DNA. The binding process induces a larger conformation change, such as the hydrophobic cavity exposing of protein and distortion of DNA structure. Obviously, one protein molecular can bind with a DNA molecular, which refers to 35 bp. Additionally, the conformation change from closed to open can be a good explanation of the facilitated of holoN-EoCen to the binding protein and DNA.
3.2 Endonuclease-like activity of DNA
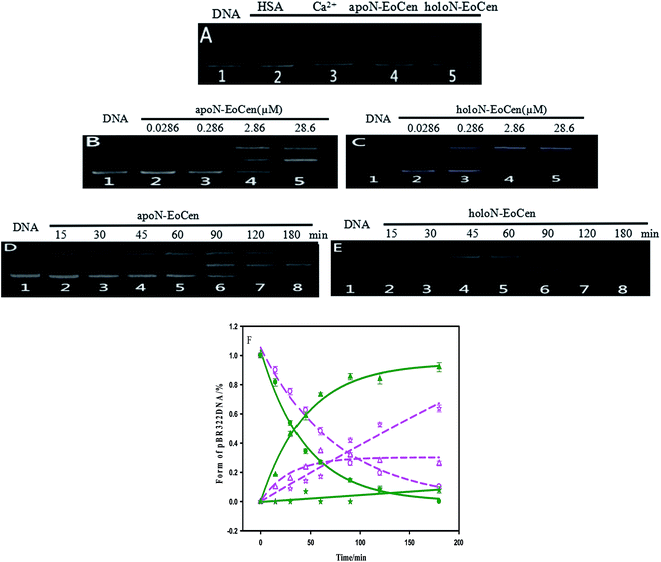
It is can be found that DNA can be cleaved by N-EoCen after longer time incubation, as shown in Fig. 5A. The supercoiled DNA (Form I, lower band in lane 1) breakage results in the formation of nicked circular DNA (Form II, upper band in lane 4) in the presence of apoN-EoCen. Linear DNA (Form III, middle band in lane 5) appears in the presence of holoN-EoCen. However, the nicked circular and linear DNA does not appear in the presence of human serum albumin (HSA) (lane 2) or metal ions (lane 3) under the similar conditions. Therefore, the conversion of the supercoiled to the nicked circular DNA and linear DNA exhibits that N-EoCen has endonuclease-like activity at physiological pH and room temperature. The cleavage capacity of holoN-EoCen is stronger than that of apoN-EoCen. This is first report of the endonuclease-like activity of the centrin, which may be closely related to its cellular functions in living creature. To further investigate the cleavage behaviors of N-EoCen, the gel electrophoresis experiments were performed.3.3 DNA cleavage mechanism
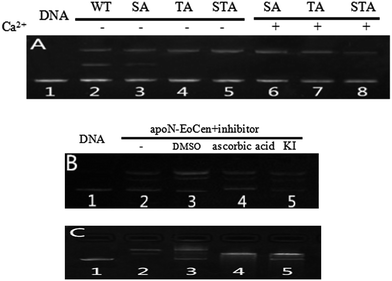
As for the functional amino acids in the cleavage process, there are various opinions. Steitz TA and Shulman RG thought of that Ser plays critical roles in the enzyme activity of serine proteases.59 Furthermore, the works by Zhao Yufen and coworkers60,61 have shown that the cleavage of the dipeptide serine histidine (SH) to DNA is referred to the hydroxyl group in Ser. The replaced by Thr still has cleavage activity. An appropriate distance is the essential to the cleavage of protein to DNA, so that nucleophilic attack to phosphorus center occurs and a pentacoordinate phosphorus transition state is formed, ultimately DNA is cleaved.60 Soon afterwards, they further verified that Ser is the necessary amino acid in the cleavage process by a QM-MM calculation method.61 In addition, research referred to endonuclease puts forward that Ser and Thr are essential for DNA cleavage.62 Interestingly, these amino acids are kept on in different endonuclease. Besides, the group of Lin Yingwu63 believes that a distinct distal hydrogen-bonding network of L29E Mb is responsible for efficient DNA cleavage. In fact, N-EoCen has two Ser (position 22, 43) and three Thr (position 38, 41, 90). Among which, Thr located at 41 and Ser located at 43 take part in the coordination with Ca(II). Thus we speculate that the cleavage of DNA by N-EoCen observed here probably attributed to the hydroxyl group of Ser and Thr in protein, so that the protein exhibits an excellent ability of double stranded DNA cleavage.To speculate the possible amino acids in the cleavage process, the DNA cleavage activity of mutant proteins was evaluated using agarose gel electrophoresis assay. As shown in Fig. 6A, apoN-EoCen is found to effectively cleave double strand DNA, leading to the formation of ∼28% nicked circular and ∼22% linear DNA after 1 h incubation at room temperature (lane 2). Control experiment shows that no DNA cleavage takes place for untreated DNA alone (lane 1). More interestingly, only nicked circular DNA is formed by SA apoN-EoCen (lane 4) and STA apoN-EoCen (lane 5) under the same condition. TA apoN-EoCen also shows reduced cleavage activity, with a result of ∼27% nicked circular DNA and ∼12% linear DNA (lane 3). Surprisingly, Ca(II) loaded mutant proteins merely produce little nicked circular DNA (lane 6, 7, 8). Results reflect that Ser and Thr, in particular Ser, are crucial in DNA cleavage process.
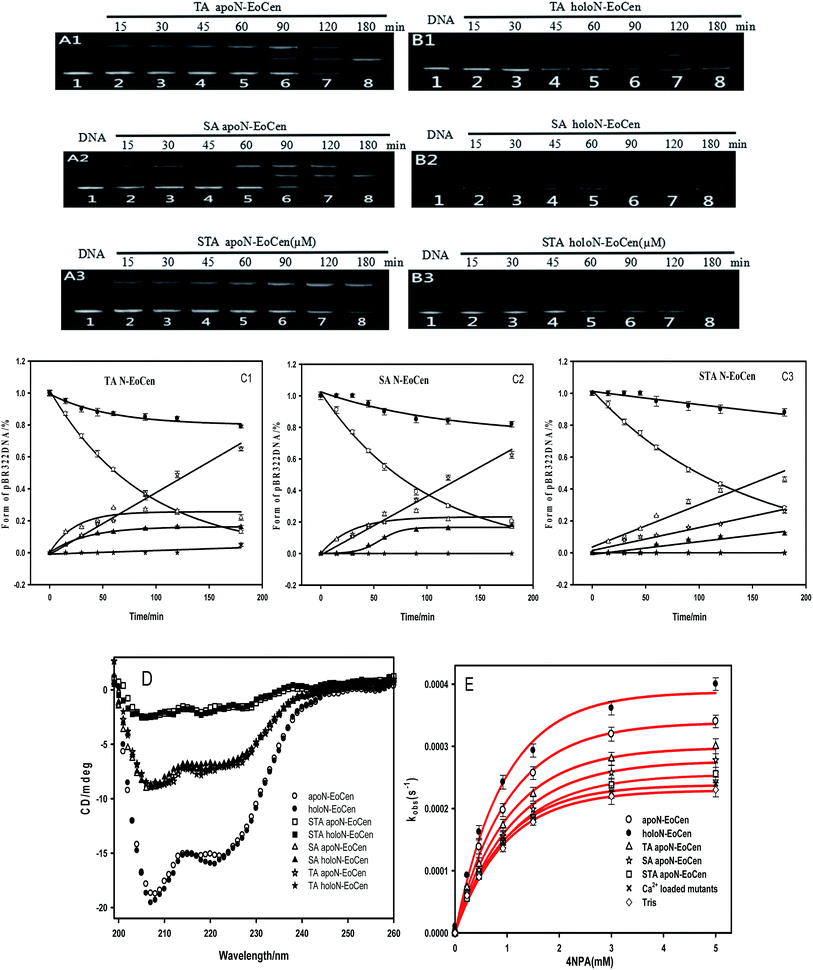
Results suggest that Ser and Thr of N-EoCen, in particular Ser, may be primarily responsible for DNA cleavage under these conditions. The hydroxyl group of Ser and Thr can nucleophilic attack to phosphorus center and results in DNA cleavage. Even though Ser located at 43 (Ser43) and Thr located at 41 (Thr41) in the first EF-hand loop take part in coordination with Ca(II), holoN-EoCen displays increasing cleavage activity. The activity may mainly derive from Ser22, Thr38 and Thr90, in particular Ser. Moreover, holoN-EoCen with more surface-exposed seems to be favour of the contact between these amino acids and DNA phosphorus center, further increasing the cleavage activity. Compared with apoN-EoCen, mutant proteins with partial exposure critical amino acid residues undoubtedly exhibit reduced rapidly cleavage activity. The minor cleavage activity of mutant proteins may have association with the large conformation change induced by mutant. As shown in Fig. 7D, the alteration in the local environment molecular composition of mutant proteins leads to large secondary structural change. A remarkable decrease of the signal at 222 nm of mutant proteins in CD spectra is observed, which suggests mutant proteins with less α-helix, particularly for STA N-EoCen. Such conformational dynamics changes may weaken the attack to phosphorus center by hydroxyl group of Ser and Thr. Apparently, the substitute of coordination amino acids by Ala can affect substantially Ca(II) binding. Perhaps, great conformation change of Ca(II) loaded mutant proteins may relate to the less endonuclease-like activity. Note that human serum albumin (HSA) also has Ser and Thr distribution on the surface of protein. Nevertheless, HSA exhibits no cleavage activity to DNA under the similar conditions, as shown in Fig. 5A. It seems that HSA cannot bind with DNA effectively. Thus HSA has no cleavage activity. It emphasizes the combination prior of cleavage is critical for the endonuclease-like activity of N-EoCen.
| Protein | kcat (s−1 × 10⁻⁴) | Km (mM) | kcat/Km (M−1 s−1) |
|---|---|---|---|
| apoN-EoCen | 4.08 ± 0.11 | 0.91 ± 0.05 | 0.45 |
| TA apoN-EoCen | 3.58 ± 0.12 | 0.95 ± 0.05 | 0.38 |
| SA apoN-EoCen | 3.33 ± 0.10 | 0.99 ± 0.06 | 0.34 |
| STA apoN-EoCen | 3.22 ± 0.08 | 0.99 ± 0.05 | 0.33 |
| holoN-EoCen | 4.75 ± 0.08 | 0.92 ± 0.03 | 0.52 |
| TA holoN-EoCen | 2.83 ± 0.10 | 0.88 ± 0.06 | 0.32 |
| SA holoN-EoCen | 2.83 ± 0.10 | 0.88 ± 0.06 | 0.32 |
| STA holoN-EoCen | 2.83 ± 0.10 | 0.88 ± 0.06 | 0.32 |
The results suggest that N-EoCen exactly performs catalytic hydrolysis activity, involving in Ser and Thr amino acid residues. Compared with apoN-EoCen, holoN-EoCen promotes whereas mutant proteins inhibit the catalytic hydrolysis of 4NPA. It is likely due to the fact that holoN-EoCen with open conformation as well as several Ser and Thr located at the protein surface may regulate the accessible volume for the substrate. In the hydrolysis process, Ser residue may play much more role than Thr residue. Additionally, Ca(II) loaded mutant proteins show less hydrolysis activity than Ca(II) depleted state mutant proteins. It seems that the mutant proteins with variational conformation further render the active amino acids inaccessible to substrate.
On the other hand, the Km values of different proteins indicate that both Ca(II) depleted and loaded mutant proteins have a lower affinity to the substrate of 4NPA. Based on the kcat and Km values, apoN-EoCen and holoN-EoCen show overall catalytic activity (kcat/Km) of 0.45 M−1 s−1 and 0.52 M−1 s−1, respectively. Meanwhile, TA apoN-EoCen, SA apoN-EoCen, and STA apoN-EoCen show gradually decreasing catalytic hydrolysis activity (Table 3). Ca(II) binding mutant proteins only exhibit minor catalytic efficiency than mutant proteins.
Further support for the view comes from the close inspection of protein structure, providing possible reasons why holoN-EoCen has relative high hydrolysis activity than others. Fig. 8A displays sequence alignments of apoN-EoCen and various mutant proteins. Blue and red shading represent potential Ca(II) coordinating residues and mutant amino acids, respectively. Fig. 8B shows the coordination environment of both Ca(II) binding loop of EF-hand of N-EoCen vividly. Thr41 and Ser43 residues of the functional Ca(II) binding loop I are substituted by Ala, leading to the Ca(II)-binding capacity decrease. Moreover, a computational molecular model of holoN-EoCen structure was built using the SwissModel server (DOI: 10.1093/nar/gku340)65 with default parameters to compare with apoN-EoCen (PDB:2joj). The best template, a mouse centrin 1, was used to build the model. They share a high sequence identity of 56.16%. A detailed comparison of apoN-EoCen with holoN-EoCen structure shows in Fig. 8C. It clearly shows that holoN-EoCen with open conformation displays large differences consisting of the important inter-helical angles and Ca(II) binding loops. Additionally, the critical amino acid residues involved in the cleavage to DNA are slight difference with those of apoN-EoCen, except Ser located at 22 (Ser22). Significantly, Ser22 clearly points towards inside upon Ca(II) binding, which may constitute the foundation of major hydrolysis activity.
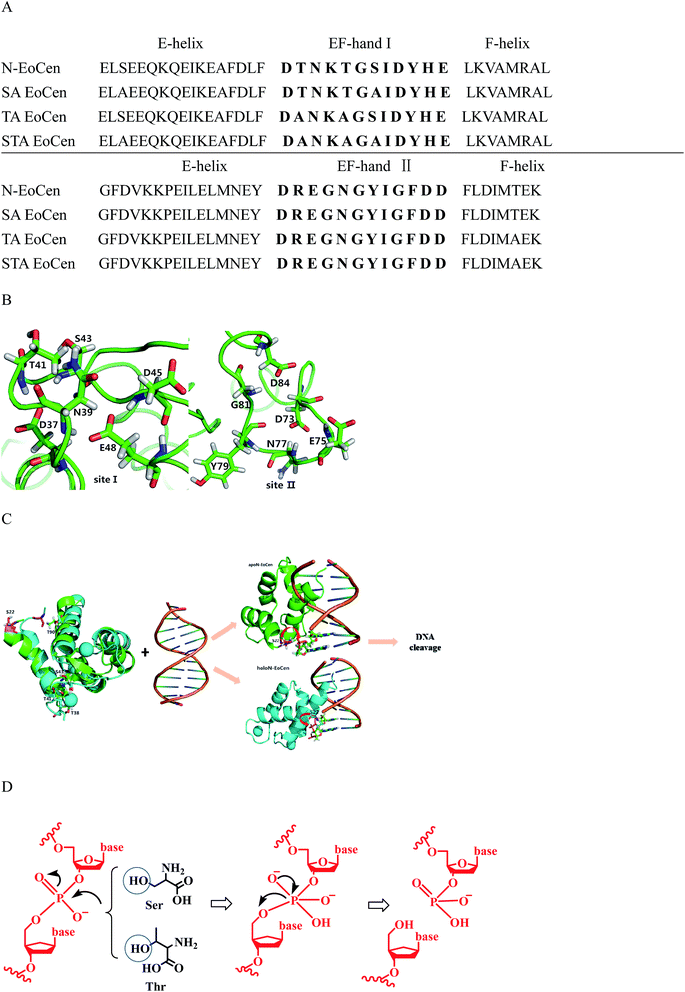 | ||
| Fig. 8 Schematic representation the interaction of apoN-EoCen (PDB:2joj, green) and modelled holoN-EoCen (cyan) with CT-DNA. (A) Sequence alignments of N-EoCen and various mutant proteins. Blue and red shading represent potential Ca2+ coordinating residues and mutant amino acids, respectively. (B) Structural models of the Ca2+ binding loops I and II for the N-EoCen. Amino acids are numbered according to their position. D stands for aspartate, N for asparagine, T for threonine, S for serine, E for glutamate, Y for tyrosine, G for glycine. (C) Schematic representation the interaction of apoN-EoCen and modeled holoN-EoCen with CT-DNA by ZDOCK 3.0.2. S and T are shown as stickmodels (S22 is in pink sticks). The coordinated Ca2+ is shown as a cyan sphere. HoloN-EoCen structure was obtained by using the SwissModel server with default parameters based on best template. N-EoCen may be inserted into the groove with its α-helix portion and cleavage is proceeded. (D) Proposed mechanism for hydrolytic DNA cleavage by key amino acid residues. | ||
Based on obtained experiment results, a speculated schematic representation the interaction of N-EoCen with CT-DNA by ZDOCK 3.0.2 are presented on Fig. 8C. Usually, helix-loop-helix proteins can recognize specific DNA sequences by its helix, which is the most common protein structural element.66 Taking into account the structure feature, it is presumable that N-EoCen inserts into the groove with its F-helix portion of EF-hand II embedded more deeply. holoN-EoCen populated open conformation triggers Ser22 more be accessible to the phosphorus center, favoring the hydrolysis to occur. Hence, Ser22 may play significant role in the endonuclease-like activity of N-EoCen. In contrast, mutant proteins with less α-helix may react with DNA in another way. Due to partial exposure of critical amino acids and less α-helix, mutant proteins perform little hydrolysis activity. With regard to Ca(II) binding mutant proteins with markedly reduced activity, the most reasonable explain may be linked to the presence of a large conformation variation.
Finally, a plausible mechanism is shown in Fig. 8D, hydroxyl group of Ser and Thr nucleophilic attacks to phosphorus center, resulting in the formation of a pentacoordinate phosphorus transition state and efficient DNA cleavage taking place.
In addition to the description of the bulk of cellular centriole-related functions of centrin, cell fractionation experiments have positioned it within the nucleus. As for the functions within the nucleus, it has been found that centrin participates in the recognition process of NER. NER is a complicated process involved in much steps and more than thirty proteins. It is well known that centrin can stimulate NER activity in vitro by interacting directly with XPC in cooperation with human homologue of HR23B. However, the research about centrin-DNA direct interactions remain lacking. Some proteins, similarly to centrin and belonging to the members of calmodulin superfamily, can interact with specific sequence in DNA.67 Literature has found the existence of interactions between centrin and DNA, which can result in abolishment of stimulation.68 Based on the reported literature, the binding and cleavage activity of centrin to DNA represented currently may link to the functions within nucleus or NER. The activity may be enhanced in the presence of XPC. The research provides clues for further work. However, much more work remain needs to be done because it is unclear for the precise roles of centrin played in the process.
4 Conclusion
In summary, N-EoCen has been found to exhibit unusual affinity to double stranded DNA. The binding constants of holoN-EoCen and DNA are higher than that of apoN-EoCen under the same condition. The interaction profile probably may be that one protein molecular bind with one DNA molecular involved in about 35 bp. The binding of protein to the helix is entirely controlled by entropy change. Ultimately, the helix structure of DNA is subjected to perturbation. Meanwhile, the protein secondary structure as well as the Tyr environment changes to a large extent. More interestingly, N-EoCen exhibits endonuclease-like activity to DNA via a hydrolysis pathway. Ser and Thr, in particular Ser22, may be primarily responsible for DNA cleavage under these conditions. The flexibility of Ser located at 22 of EF-hand domains may explain the differences in cleavage activity between apoN-EoCen and holoN-EoCen. Note that the cleavage products are mainly nicked circular DNA for holoN-EoCen and linear DNA for apoN-EoCen, respectively. To date, there has been no evidence for the biochemical role of N-EoCen–DNA reaction. It is possible to relate to the cellular function of the protein in NER. The results on the protein–DNA interaction may find its future importance in the investigation of centrin more features.Conflicts of interest
There are no conflicts to declare.Acknowledgements
This work was supported by the National Natural Science Foundation of PR China [grant numbers 20771068, No. 20901048 and No. 21571117], the PhD Programs Foundation of the Ministry of Education of China (grant number 20131401110011). We thank T. Zhang of scientific instrument center of Shanxi University for her excellent technical assistance in ITC.References
- F. J. Blanco and G. Montoya, FEBS J., 2011, 278, 1643–1650 CrossRef CAS PubMed.
- D. Vuzman and Y. Levy, Mol. BioSyst., 2012, 8, 47–57 RSC.
- B. Dey, S. Thukral, S. Krishnan, M. Chakrobarty, S. Gupta, C. Manghani and V. Rani, Mol. Cell. Biochem., 2012, 365, 279–299 CrossRef CAS PubMed.
- X. M. Ding, X. Y. Pan, C. Xu and H. B. Shen, Curr. Comput.-Aided Drug Des., 2010, 6, 197–206 CrossRef CAS PubMed.
- B. Y. Jiang, M. Wang, F. Z. Li, L. Yu and J. Q. Xie, Biosens. Bioelectron., 2015, 64, 429–433 CrossRef CAS PubMed.
- A. D. Robison and I. J. Finkelstein, FEBS Lett., 2014, 588, 3539–3546 CrossRef CAS PubMed.
- N. M. Luscombe, R. A. Laskowski and J. M. Thornton, Nucleic Acids Res., 2001, 29, 2860–2874 CrossRef CAS PubMed.
- N. R. Steffen, S. D. Murphy, L. Tolleri, G. W. Hatfield and R. H. Lathrop, Bioinformatics, 2002, 18, S22–S30 CrossRef PubMed.
- S. E. Halford and J. F. Marko, Nucleic Acids Res., 2004, 32, 3040–3052 CrossRef CAS PubMed.
- R. Molina, P. Redondo, S. Stella, M. Marenchino, M. D'Abramo, F. L. Gervasio, J. C. Epinat, J. Valton, S. Grizot, P. Duchateau, J. Prieto and G. Montoya, Nucleic Acids Res., 2012, 40, 6936–6945 CrossRef CAS PubMed.
- Z. Q. Deng, Q. Wang, Z. Liu, M. F. Zhang, A. C. D. Machado, T. P. Chiu, C. Feng, Q. Zhang, L. Yu, L. Qi, J. G. Zheng, X. Wang, X. M. Huo, X. X. Qi, X. R. Li, W. Wu, R. Rohs, Y. Li and Z. Z. Chen, Nat. Commun., 2015, 6, 7462 CrossRef PubMed.
- L. Jen-Jacobson, Biopolymers, 1997, 44, 153–180 CrossRef CAS PubMed.
- S. S. Narayanan and S. K. Pal, Langmuir, 2007, 23, 6712–6718 CrossRef CAS PubMed.
- R. Errabolu, M. A. Sanders and J. L. Salisbury, J. Cell Sci., 1994, 107, 9–16 CAS.
- T. Fischer, S. Rodriguez-Navarro, G. Pereira, A. Racz, E. Schiebel and E. Hurt, Nat. Cell Biol., 2004, 6, 840–848 CrossRef CAS PubMed.
- K. K. Resendes, B. A. Rasala and A. D. J. Forbes, Mol. Cell. Biol., 2008, 28, 1755–1769 CrossRef CAS PubMed.
- L. Radu, I. Durussel, L. Assairi, Y. Blouquit, S. Miron, J. A. Cox and C. T. Craescu, Biochemistry, 2010, 49, 4383–4394 CrossRef CAS PubMed.
- T. J. Dantas, O. M. Daly, P. C. Conroy, M. Tomas, Y. Wang, P. Lalor, P. Dockery, E. Ferrando-May and C. G. Morrison, PLoS One, 2013, 8, e68487 CAS.
- T. J. Dantas, O. M. Daly and C. G. Morrison, Cell. Mol. Life Sci., 2012, 69, 2979–2997 CrossRef CAS PubMed.
- A. Paoletti, M. Moudjou, M. Paintrand, J. L. Salisbury and M. Bornens, J. Cell Sci., 1996, 109, 3089–3102 CAS.
- L. Liang, S. Flury, V. Kalck, B. Hohn and J. Molinier, Plant Mol. Biol., 2006, 61, 345–356 CrossRef CAS PubMed.
- T. J. Dantas, Y. Wang, P. Lalor, P. Dockery and C. G. Morrison, J. Cell Biol., 2011, 193, 307–318 CAS.
- M. Araki, C. Masutani, M. Takemura, A. Uchida, K. Sugasawa, J. Kondoh, Y. Ohkuma and F. Hanaoka, J. Biol. Chem., 2001, 276, 18665–18672 CrossRef CAS PubMed.
- R. Nishi, W. Sakai, D. Tone, F. Hanaoka and K. Sugasawa, Nucleic Acids Res., 2013, 41, 6917–6929 CrossRef CAS PubMed.
- E. X. Shi, W. L. Zhang, Y. Q. Zhao and B. S. Yang, RSC Adv., 2017, 7, 27139–27149 RSC.
- M. R. Beccia, S. S. Merle, D. Lemaire, N. Brémond, R. Pardoux, S. Blangy, P. Guilbaud and C. Berthomieu, J. Biol. Inorg Chem., 2015, 20, 905–919 CrossRef CAS PubMed.
- L. X. Ren, Y. Q. Zhao, J. Y. Feng, X. J. He, A. H. Liang and B. S. Yang, Chin. J. Inorg. Chem., 2006, 22, 87–90 CAS.
- W. Liu, L. Duan, Y. Q. Zhao, A. H. Liang and B. S. Yang, Chin. Sci. Bull., 2010, 55, 3118–3122 CrossRef CAS.
- J. Marmur, J. Mol. Biol., 1961, 3, 208–218 CrossRef CAS.
- Z. Song, J. Ming and B. S. Yang, J. Biol. Inorg Chem., 2014, 19, 359–374 CrossRef CAS PubMed.
- Z. Song, J. L. Wang and B. S. Yang, Spectrochim. Acta, Part A, 2014, 118, 454–460 CrossRef CAS PubMed.
- J. R. Lakowicz, Principles of fluorescence spectroscopy, Kluwer Academic/Plenum, 1983, pp. 260–265 Search PubMed.
- B. S. Der, D. R. Edwards and B. Kuhlman, Biochemistry, 2012, 51, 3933–3940 CrossRef CAS PubMed.
- J. Zeng, Y. Zhao, W. Li, X. S. Tan, G. B. Wen and Y. W. Lin, J. Mol. Catal. B: Enzym., 2015, 111, 9–15 CrossRef CAS.
- F. J. Kezdy and M. L. Bender, Biochemistry, 1962, 1, 1097–1106 CrossRef CAS PubMed.
- W. W. Cleland, Biochim. Biophys. Acta, 1965, 67, 104–137 CrossRef.
- B. G. Pierce, K. Wiehe, H. Hwang, B. H. Kim, T. Vreven and Z. Weng, Bioinformatics, 2014, 30, 1771–1773 CrossRef CAS PubMed.
- B. G. Pierce, Y. Hourai and Z. Weng, PLoS One, 2011, 6, e24657 CAS.
- J. Mintseris, B. Pierce, K. Wiehe, R. Anderson, R. Chen and Z. Weng, Proteins, 2007, 69, 511–520 CrossRef CAS PubMed.
- N. J. Greenfield, Nat. Protoc., 2006, 1, 2876–2890 CrossRef CAS PubMed.
- J. Kypr, L. Kejnovska, D. Renciuk and M. Vorlickova, Nucleic Acids Res., 2009, 37, 1713–1725 CrossRef CAS PubMed.
- Z. J. Wang, Y. Q. Zhao, L. X. Ren, G. T. Li, A. H. Liang and B. S. Yang, J. Photochem. Photobiol., A, 2007, 186, 178–186 CrossRef CAS.
- L. Duan, W. Liu, Z. J. Wang, A. H. Liang and B. S. Yang, J. Biol. Inorg Chem., 2010, 15, 995–1007 CrossRef CAS PubMed.
- Y. Q. Zhao, L. Song, A. H. Liang and B. S. Yang, J. Photochem. Photobiol., B, 2009, 95, 26–32 CrossRef CAS PubMed.
- M. Zhangh, T. Tanaka and M. Ikura, Nat. Struct. Mol. Biol., 1995, 2, 758–767 Search PubMed.
- Y. Q. Zhao, J. Y. Feng, A. H. Liang and B. S. Yang, Spectrochim. Acta, Part A, 2009, 71, 1756–1761 CrossRef PubMed.
- W. O. Mcclure and G. M. Edelman, Biochemistry, 1966, 5, 1908–1919 CrossRef CAS PubMed.
- Z. J. Wang, L. X. Ren, Y. Q. Zhao, G. T. Li, L. Duan, A. H. Liang and B. S Yang, Spectrochim. Acta, Part A, 2008, 70, 892–897 CrossRef PubMed.
- T. R. Prytkova, E. Ibrahim, S. Brian, N. Son-Binh and G. C. Schatz, J. Phys. Chem. B, 2010, 114, 2627–2634 CrossRef CAS PubMed.
- A. Y. Solovyev, S. I. Tarnovskaya, I. A. Chernova, L. K. Shataeva and Y. A. Skorik, Int. J. Biol. Macromol., 2015, 78, 39–45 CrossRef CAS PubMed.
- L. Mcfail-Isom, C. C. Sines and L. D. Williams, Curr. Opin. Struct. Biol., 1999, 9, 298–304 CrossRef CAS PubMed.
- A. Sigel, H. Sigel and R. K. O. Sigel, Interplay between metal ions and nucleic acids, Springer, 2012, vol. 10, p. 38 Search PubMed.
- W. Chen, N. J. Turro and D. A. Tomalia, Langmuir, 2000, 16, 15–19 CrossRef CAS.
- M. Voicescu, M. Heinrich and P. Hellwig, J. Fluoresc., 2008, 19, 257–266 CrossRef PubMed.
- J. Eisinger, M. Gueron, R. G. Shulman and T. Yamane, Proc. Natl. Acad. Sci. U. S. A., 1966, 55, 1015–1020 CrossRef CAS.
- S. A. Coulocheri, D. G. Pigis, K. A. Papavassiliou and A. G. Papavassiliou, Biochimie, 2007, 89, 1291–1303 CrossRef CAS PubMed.
- I. V. Korendovych, D. W. Kulp, Y. Wu, H. Cheng, H. Roder and W. F. DeGrado, Proc. Natl. Acad. Sci. U. S. A., 2011, 108, 6823–6827 CrossRef CAS PubMed.
- S. W. Wong-Deyrup, C. Prasannan, C. M. Dupureur and S. J. Franklin, J. Biol. Inorg Chem., 2011, 17, 387–398 CrossRef PubMed.
- T. A. Steitz and R. G. Shulman, Annu. Rev. Biophys. Bioeng., 1982, 11, 419–444 CrossRef CAS PubMed.
- Y. F. Li, Y. W. Sha, Y. Ma and Y. F. Zhao, Biochem. Biophys. Res. Commun., 1995, 213, 875–880 CrossRef CAS PubMed.
- R. G. Zhong, L. J. Zhao and Y. F. Zhao, Acta Chim. Sin., 2004, 62, 2444–2446 CAS.
- J. Prieto, P. Redondo, D. Padro, S. Arnould, J. C. Epinat, F. Paques, F. J. Blanco and G. Montoya, Nucleic Acids Res., 2007, 35, 3262–3271 CrossRef CAS PubMed.
- Y. Zhao, K. J. Du, S. Q. Gao, B. He, X. S. Tan and Y. W. Lin, J. Inorg. Biochem., 2016, 156, 113–121 CrossRef CAS PubMed.
- M. S. Deshpande, S. Junedi, H. Prakash, S. Nagao, M. Yamanaka and S. Hirota, Chem. Commun., 2014, 50, 15034–15036 RSC.
- K. Arnold, L. Bordoli, J. Kopp and T. Schwede, Bioinformatics, 2006, 22, 195–201 CrossRef CAS PubMed.
- C. W. Garvie and C. Wolberger, Mol. Cell, 2001, 8, 937–946 CrossRef CAS PubMed.
- R. Kushwaha, A. Singh and S. Chattopadhyay, Plant Cell, 2008, 20, 1747–1759 CrossRef CAS PubMed.
- Y. S. Krasikova, N. I. Rechkunova, E. A. Maltseva, C. T. Craescu and O. I. Lavrik, Biochemistry, 2012, 77, 346–353 CAS.
Footnote |
| † Electronic supplementary information (ESI) available. See DOI: 10.1039/c7ra07907a |
| This journal is © The Royal Society of Chemistry 2017 |

