 Open Access Article
A thermal-fluid coupling numerical study on the characteristics of air–oil two phase flow and heat transfer in a micro UAV bearing chamber
Peng Lu *a,
Xingwen Zhenga,
Wei Liac,
Peijie Yanga,
Hulin Huang*b and
Yezhen Yud
aKey Laboratory of Thermal Environment and Thermal Structure of Ministry of Industry and Information Technology, Jiangsu Province Key Laboratory of Aerospace Power System, College of Energy and Power Engineering, Nanjing University of Aeronautics and Astronautics, Nanjing 210016, China. E-mail: plu@nuaa.edu.cn
bCollege of Astronautics, Nanjing University of Aeronautics and Astronautics, Nanjing 210016, China. E-mail: hlhuang@nuaa.edu.cn
cMing Yang Smart Energy Group Co., Ltd., Zhongshan 528400, China
dSchool of Energy and Mechanical Engineering, Nanjing Normal University, Nanjing 210042, China
First published on 15th September 2017
Abstract
Design of lubrication systems, particularly of bearing chambers, requires a sufficient understanding of the physical characteristics of the air–oil two phase flow. Due to a high shaft rotating speed of micro UAV (Unmanned Aerial Vehicle) engines, the heat production of bearings often results in a poor cooling effect on the bearings. In the present work, numerical simulation was conducted on the above topic for a certain type of UAV engine. Firstly, the heat production in the bearings was theoretically analysed, and a three dimensional structural model of the bearing chamber was built by Unigraphics (UG) software. Then on the FLUENT platform, some key physical fields, such as path lines, velocity and temperature distributions were presented and discussed, with the simulated results were verified by measured values under typical working conditions. Afterwards, the influences of some important operating conditions, including revolving speed, oil supply, and air inlet velocity were investigated. Finally, optimal values were suggested for each operating condition, taking into consideration the cooling effect, lubrication effect and engine efficiency.
1. Introduction
The bearing chamber is one of the crucial components in the lubrication system of an aero engine. In this chamber, due to the shaft rotation, the lubricating oil mixes with sealing air flow and they form a complicated air–oil two phase flow. High-pressure and high-temperature working conditions, along with the frictional heat production in bearings, lead to very complex characteristics of flow and heat transfer inside. The lubrication oil plays an important role in lubricating and heat removal, which is beneficial to bearing life and operation; however, the oil may coke or even burn if the temperature is excessively high, which consequently degrades the safety and reliability of the aero engine. Therefore, understanding the characteristics of air–oil two phase flow and heat transfer in the bearing chamber is of great significance for stable and efficient operation of an aero engine.Adequately resolving the airflow field is important to subsequent computational modeling of two-phase fluids transport and heat transfer characteristics. C. W. Lee et al.1 investigated the single-phase velocity field of a model aero engine bearing chamber, with comparison of computational fluid dynamics (CFD) with particle image velocimetry (PIV) data. Similarly, J. Aidarinis et al.2 examined the air-flow field development in an aero engine front bearing chamber, by combination of experimental measurements and CFD modeling.
Besides, the movement of lubrication oil droplet also has strong impacts on the two phase flow and heat transfer inside the bearing chamber. In order to obtain the composition of the liquid (oil) and gas (air) phases, M. Farrall et al.3 computed the air/oil flow in a commercial aero engine bearing chamber, with focus on the flow exiting the chamber, which showed good agreement with available experimental data. To describe the effect of oil droplet deformation on the motion, B. Chen et al.4 proposed a modified droplet deformation model, by which he calculated the droplet deformation, motion, and the associated mass and momentum transfer in an aero engine bearing chamber. Based on the oil film force balance analysis and wave theory, H. C. Sun et al.5 calculated Sauter Mean Diameter (SMD) of the oil droplet, as functions of the rotating disk radius, rotating speed, oil flow rate and oil properties; later on, by adding temperature solution to the oil droplet motion analysis, they further promoted the calculation accuracy of the droplet trajectory, velocity, and temperature.6
Furthermore, the oil film, which is very important for the bearing chamber lubrication and heat transfer calculation, is another research topic. M. Farrall et al.7 developed a two-phase numerical modeling approach to predict air, oil droplet and oil film behavior in an aero engine bearing chamber including strong droplet/film interactions. P. Gorse et al.8 focused on the experimental determination of the film thickness, aiming to find out the influence of various operating conditions and geometries. Taking in consideration of droplet size distribution, G. D. Chen et al.9 put forward an integrated model combined with droplet movement, droplet/wall impingement and oil film flow, in order to reveal the configuration and flow of wall oil film. W. Kurz et al.10 believed that different flow regimes correspond to different oil film distributions inside an aero engine bearing chamber, and proposed an approach for the flow regime prediction.
In addition to the above researches on the flow characteristics, the impacts of temperature distribution and heat transfer process inside bearing chambers deserve enough attention. For this reason, M. Flouros11 developed correlations for heat generation and outer ring temperature which consider the influence of the direction of oil ingestion relative to the direction of the axial load. On an engine demonstrator, he examined the two-phase flow heat transfer in the vent and scavenge pipe analytically and numerically.12 A further step research was carried out on the active outer ring cooling of ball bearings, by using a spiral groove engraved in the outer ring with oil as the cooling medium.13
Nowadays, aircraft engines, e.g. UAV engines, are developing towards lighter weight and more compact structure, which consequently put forward higher demands on lubrication systems, not only in terms of bearings lubrication, but also in terms of the removal of the vast amounts of heat generation. The flow field is more complicated compared to that in a common aero engine, due to high shaft rotating speed, geometric configurations and a strong interaction between air flow and lubricant oil. Therefore, it is of great significance to understand the characteristics of flow and heat transfer in UAV engine bearing chamber, so as to optimize its design and operation.
However, few literatures can be referred to regarding the above topic in UAV engines. In the present paper, based on a theoretical analysis into the main heat sources inside the chamber, a three dimensional investigation is carried out on the physical fields, namely path lines, the velocity distributions, and temperature distributions, in a turbojet engine generally applied to unmanned target drones. The impacts of operating conditions, including the rotating speed, oil supply, and air inlet velocity are determined, respectively.
2. Modeling
2.1 Model set-up
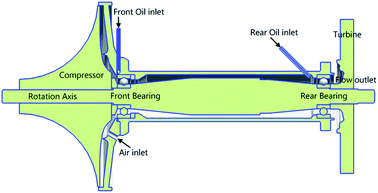
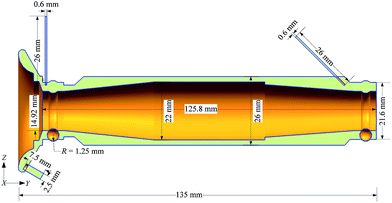
The schematic structure of a micro UAV engine is depicted in Fig. 1. An open-type system is employed, where lube oil and air are pushed into the engine periodically to make sure that the bearings and their accessories work in good condition. This system, which has simple structure as there are no mechanical components for lube circulation, is usually used in engines working at high temperature and for short time. Accordingly, the structural model built by 3D Unigraphics (UG) software is depicted in Fig. 2, including the detailed geometric parameters.2.2 Mesh generation
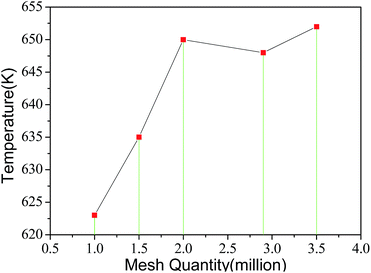
The above model is then meshed by appropriate selection of structured or unstructured grids. Specifically, for the central region between the shaft and wall, and the inlet and outlet regions of lube oil, where the structures are relatively simple, structured grids are selected; while for the regions of bearings with rotors, where the structures are far more complicated, unstructured grids are more suitable.After that, the mesh quantity is set at 1 × 10⁶, 1.5 × 10⁶, 2 × 10⁶, 2.9 × 10⁶ and 3.5 × 10⁶ respectively, and the average temperatures at central cross-section of the rear bearing, calculated by different mesh quantities, are presented in Fig. 3. It can be inferred that the optimal mesh quantity is 2 × 10⁶, both to save the calculation time and to ensure the simulation accuracy.
2.3 Physical properties and boundary conditions
Physical properties of the lube oil can be calculated by the equations below.14Density
| ρ = 0.75(293 − T) + 779.6 kg m−3 |
Specific heat capacity
| Cp = 0.003762T + 0.44 J kg−1 K−1 |
Heat conductivity coefficient
| λ = 0.12 − 0.00016T W m−1 K−1 |
Kinematic viscosity
lg(v + 0.73) = 10(8.9765−3.8265![[thin space (1/6-em)]](https://www.rsc.org/images/entities/char_2009.gif) lg lg![[thin space (1/6-em)]](https://www.rsc.org/images/entities/char_2009.gif) T) mm2 s−1 T) mm2 s−1 |
On FLUENT platform, mixture model combined with RNG k-ε turbulent model is employed to investigate the air–oil two phase flows in the bearing chamber of a UAV engine. Velocity boundary condition is applied at the air inlet, flow rate boundary condition is used at the oil inlets, and pressure boundary condition is applied at the outlet of bearing chamber, with total pressure of 377![[thin space (1/6-em)]](https://www.rsc.org/images/entities/char_2009.gif) 334 Pa and static pressure of 366
334 Pa and static pressure of 366![[thin space (1/6-em)]](https://www.rsc.org/images/entities/char_2009.gif) 844 Pa. Besides, SIMPLE scheme is used to resolve pressure–velocity coupling equation. Second-order upwind difference scheme is also applied to improve the computational accuracy, with the convergence accuracy 10−6 of the residual monitor.
844 Pa. Besides, SIMPLE scheme is used to resolve pressure–velocity coupling equation. Second-order upwind difference scheme is also applied to improve the computational accuracy, with the convergence accuracy 10−6 of the residual monitor.
The initial temperatures at key points are listed in Table 1. In addition, due to high-speed friction between rotors and track inside bearings, the heat production needs to be calculated, based on friction moments.15 Frictional heat production model, proposed by Palmgren of SKF (Svenska Kullagerfabriken), is employed here.
| Temperatures | Values (K) |
|---|---|
| Tli | 300 |
| Tai | 464 |
| Tef | 464 |
| Ter | 1180 |
Total heat production
| Q = 2πMn10−3/60 W |
Total friction moment
| M = M0 + M1 N mm |
Viscous friction moment by lube
Load moment
| M1 = f1F1Dm N mm |
Di and Do are inner circle diameter and outer circle diameter of the bearing, respectively.
It is assumed that each one of total 11 rotors produces the same quantity of heat in a high-speed rolling bearing, thus the heat production flux over the total heat transfer area is:
3. Results and discussion
3.1 Verification of the simulated results
The typical working conditions are presented in Table 2. Numerical simulation was carried out under these conditions, and the simulation results were in good agreement with the practical measured values, shown in Table 3.| Conditions | Values |
|---|---|
| n (rpm) | 96![[thin space (1/6-em)]](https://www.rsc.org/images/entities/char_2009.gif) 000 000 |
| mif (g s−1) | 4.2 |
| mir (g s−1) | 8.4 |
| Tli (K) | 300 |
| vai (m s−1) | 60 |
| Tai (K) | 464 |
| Po (Pa) | 366![[thin space (1/6-em)]](https://www.rsc.org/images/entities/char_2009.gif) 844 844 |
| Parameters | Simulation results | Measured values | Relative errors |
|---|---|---|---|
| vo (m s−1) | 110 | 138 | 20.3% |
| Ti (K) | 1165 | 1180 | 1.3% |
| Tr (K) | 665 | 670 | 0.7% |
3.2 Physical fields
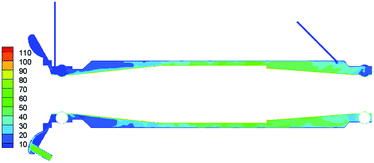
In the rear zone near the inclined inlet of lube oil, the velocity decreases again due to the slow inflow of oil, and it drops further when fluids flow through the rear bearing, caused by the flow resistance in the rear bearing.
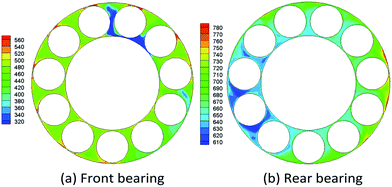
In order to further understand the cooling effects on the two bearings, the temperature distribution along the cross section of the two bearings are separately showed in Fig. 7. Note that the highest temperature on the rear bearing is 780 K, compared to 560 K on the front one, which indicates that cooling the rear bearing is more crucial for the entire bearing chamber. Moreover, Fig. 7(b) illustrates that the temperature at the inner circle is relatively low, while the highest temperature spots exist at the outer circle, since the exterior surrounding temperature is 1180 K, which is much higher than those at other points, as presented in Table 1. By comparison, the heat source along the inner circle, which results from the friction with rotors, is of lower temperature. Therefore, in the following sections, detailed research will be conducted on how each operating condition will affect the cooling for the rear bearing.
3.3 Influences of operating conditions
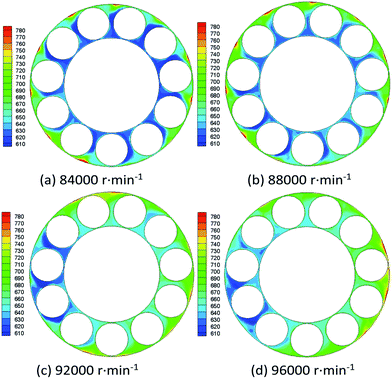
At a lower revolving speed (84![[thin space (1/6-em)]](https://www.rsc.org/images/entities/char_2009.gif) 000 rpm or 88
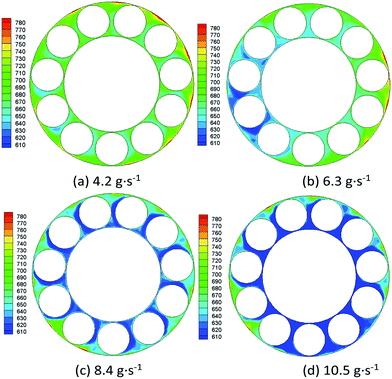
000 rpm or 88![[thin space (1/6-em)]](https://www.rsc.org/images/entities/char_2009.gif) 000 rpm), the heat production by friction is relatively less, thus the fluids can “take away” heat from the bearing timely, in other words, the cooling effect on rotors and inner circle of the bearing is satisfactory, as it can be seen from Fig. 8(a) and (b). With the revolving speed increases to 92
000 rpm), the heat production by friction is relatively less, thus the fluids can “take away” heat from the bearing timely, in other words, the cooling effect on rotors and inner circle of the bearing is satisfactory, as it can be seen from Fig. 8(a) and (b). With the revolving speed increases to 92![[thin space (1/6-em)]](https://www.rsc.org/images/entities/char_2009.gif) 000 rpm and 96
000 rpm and 96![[thin space (1/6-em)]](https://www.rsc.org/images/entities/char_2009.gif) 000 rpm, both the heat production by friction and the heat transfer coefficient between fluids and solid walls grow consequently. Given the temperature of exterior surrounding at the rear bearing may reach up to 1180 K (Table 1), as a result, the fluids temperature increases, shown in Fig. 8(c) and (d).
000 rpm, both the heat production by friction and the heat transfer coefficient between fluids and solid walls grow consequently. Given the temperature of exterior surrounding at the rear bearing may reach up to 1180 K (Table 1), as a result, the fluids temperature increases, shown in Fig. 8(c) and (d).
As for the temperature distribution on the outer circle of the rear bearing, it is noticed that at a lower revolving speed (84![[thin space (1/6-em)]](https://www.rsc.org/images/entities/char_2009.gif) 000 rpm), more high-temperature spots are observed, approximately 9 red spots (Fig. 8(a)), resulting from a lower heat transfer coefficient between fluids and the outer circle, compared to only 3 red high-temperature spots (Fig. 8(d)) at a higher revolving speed (96
000 rpm), more high-temperature spots are observed, approximately 9 red spots (Fig. 8(a)), resulting from a lower heat transfer coefficient between fluids and the outer circle, compared to only 3 red high-temperature spots (Fig. 8(d)) at a higher revolving speed (96![[thin space (1/6-em)]](https://www.rsc.org/images/entities/char_2009.gif) 000 rpm) when the heat transfer is much better. Moreover, with the heat transfer coefficient increasing, the temperature distribution over the cross section of the bearing is more uniform.
000 rpm) when the heat transfer is much better. Moreover, with the heat transfer coefficient increasing, the temperature distribution over the cross section of the bearing is more uniform.
To summarize, an excessively high revolving speed may result in overtemperature for rotors and inner circle of the bearing. However, a lower revolving speed may cause a poor cooling effect on the outer circle of the bearing. Take the above factors into consideration, it is suggested that the optimal revolving speed be 92![[thin space (1/6-em)]](https://www.rsc.org/images/entities/char_2009.gif) 000 rpm.
000 rpm.
| vai (m s−1) | Tm (K) | Tic (K) | Toc (K) | Tr (K) |
|---|---|---|---|---|
| 20 | 717 | 708 | 743 | 718 |
| 40 | 672 | 671 | 730 | 683 |
| 60 | 665 | 667 | 715 | 678 |
| 80 | 600 | 595 | 698 | 608 |
| 100 | 587 | 585 | 680 | 600 |
| 120 | 580 | 578 | 670 | 589 |
4. Conclusions
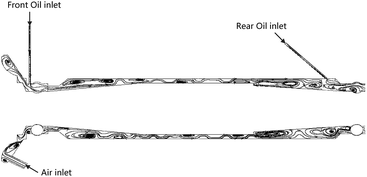
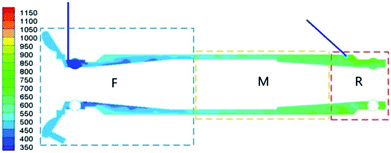
High shaft rotating speed of micro UAV engines often causes a poor cooling effect. It is necessary to investigate the characteristics of flow and heat transfer in the bearing chamber and to understand the impacting factors. In the present paper, a thermal-fluid coupling numerical study is carried out on FLUENT Platform for a certain type of micro UAV engine. Some key physical fields, such as path lines, velocity and temperature distributions were obtained and discussed. Based on that, the impacts of revolving speed, oil supply, and air inlet velocity were respectively determined, with the conclusion as follows:(1) Path lines of the fluids along the bearing chamber feature vortexes of different sizes at different locations, due to the effects of local channel geometry, interaction between air and oil, collisions between fluids and walls, and oil injection.
(2) The velocity distribution is mainly influenced by the obstruction of bearings, channel geometry, the radial distance to the revolving shaft, and the friction from the stationary wall, etc. Similarly, the temperatures in the bearing chamber are affected by the exterior surrounding temperature, the frictional heat production of bearings, and the radial location in bearings.
(3) Both the velocity distribution and the temperature distribution are closely associated with the path lines. More specifically, the vortexes of fluids in the figure of path lines have immediate impacts on the local velocity and temperature.
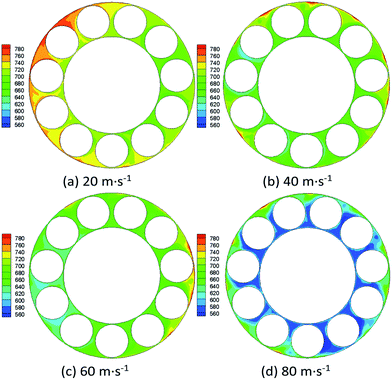
(4) Shaft rotating speed determines the frictional heat production of rotors, and the cooling effect on the outer circle of the bearing as well. In general, more lubrication oil supply contributes to better cooling effect on the bearing; however, it will meanwhile consume more power and reduce the engine efficiency. Additionally, raising the air velocity will, on the one hand, be beneficial to the bearings' cooling; on the other hand, degrade the fluids lubrication capability.
(5) Taking into consideration of the cooling effect, lubrication effect and engine efficiency, the suggested values for rotating speed, lubrication oil supply and air velocity are around 92![[thin space (1/6-em)]](https://www.rsc.org/images/entities/char_2009.gif) 000 rpm, 8.4 g s−1 and 80 m s−1 respectively, with respect to the micro UAV engine in the present paper.
000 rpm, 8.4 g s−1 and 80 m s−1 respectively, with respect to the micro UAV engine in the present paper.
Conflicts of interest
There are no conflicts to declare.Nomenclature
| Cp | Specific heat capacity of lube oil |
| Da | Diameter of the rotor |
| Di | Inner circle diameter of the bearing |
| Dm | Circle diameter of bearing pitch |
| Do | Outer circle diameter of the bearing |
| f0 | Coefficient determined by bearing type and lubrication |
| f1 | Coefficient determined by bearing structure and loads |
| F1 | Bearing load |
| mif | Inlet mass flow rate of lube at the front bearing |
| mir | Inlet mass flow rate of lube at the rear bearing |
| M | Total friction moment |
| M0 | Viscous friction moment by lube |
| M1 | Load moment |
| N | Revolving speed of the bearing |
| Po | Outlet static pressure of fluids |
| Q | Heat production flux |
| Q | Total heat production |
| T | Temperature of lube oil |
| Tai | Inlet air temperature |
| Tef | Temperature of exterior surrounding at the front |
| Ter | Temperature of exterior surrounding at the rear |
| Tic | Average temperature on the inner circle |
| Tli | Inlet lube temperature |
| Tm | Average temperature of fluids on the cross section |
| To | Outlet temperature the fluids |
| Toc | Average temperature on the outer circle |
| Tr | Average temperature on rotors |
| vai | Inlet air velocity |
| vo | Outlet velocity of the fluids |
| X | Axis |
Greek symbols
| ρ | Density of lube oil |
| Λ | Heat conductivity coefficient of lube oil |
| ν | Kinematic viscosity of lube oil |
Acknowledgements
This work is supported by “the Fundamental Research Funds for the Central Universities” (No. NJ20160041); and “National Natural Science Foundation of China” (No. 51506087).References
- C. W. Lee, P. C. Palma, K. Simmons and S. J. Pickering, J. Eng. Gas Turbines Power, 2005, 127, 697–703 CrossRef.
- J. Aidarinis, D. Missirlis, K. Yakinthos and A. Goulas, J. Eng. Gas Turbines Power, 2011, 133, 082504 CrossRef.
- M. Farrall, S. Hibberd, K. Simmons and D. Giddings, Proc. Inst. Mech. Eng., Part G, 2006, 220, 197–202 CrossRef.
- B. Chen, G. Chen, H. Sun and Y. Zhang, Proc. Inst. Mech. Eng., Part G, 2012, 228, 206–218 CrossRef.
- H. C. Sun, G. D. Chen, L. N. Wang and F. Wang, Int. J. Aerosp. Eng., 2015, 769862 Search PubMed.
- H. C. Sun, G. D. Chen, Y. H. Zhang and L. N. Wang, Proc. Inst. Mech. Eng., Part G, 2016, 230, 2596–2614 CrossRef.
- M. Farrall, S. Hibberd and K. Simmons, J. Eng. Gas Turbines Power, 2008, 130, 012501 CrossRef.
- P. Gorse, S. Busam and K. Dullenkopf, J. Eng. Gas Turbines Power, 2006, 128, 103–110 CrossRef.
- G. D. Chen, H. C. Sun and J. Wang, Chin. J. Aeronaut., 2011, 24, 355–362 CrossRef.
- W. Kurz and H. J. Bauer, Proceedings of the Asme Turbo Expo: Turbine Technical Conference and Exposition, Dusseldorf, 2014, pp. 1–8 Search PubMed.
- M. Flouros, Aerosp. Sci. Technol., 2006, 10, 611–617 CrossRef.
- M. Flouros, J. Turbomach., 2010, 132, 011008 CrossRef.
- M. Flouros, M. Hirschmann, F. Cottier, P. Gloeckner and K. Dullenkopf, J. Eng. Gas Turbines Power, 2013, 135, 081902 CrossRef.
- S. H. Tong, Master, Nanjing University of Aeronautics and Astronautics, 2013.
- Y. C. Zhou, Master, Lanzhou University of Technology, 2013.
| This journal is © The Royal Society of Chemistry 2017 |

