DOI:
10.1039/C7RA07816A
(Paper)
RSC Adv., 2017,
7, 41471-41478
Correlation of montmorillonite exfoliation with interlayer cations in the preparation of two-dimensional nanosheets
Received
16th July 2017
, Accepted 18th August 2017
First published on 25th August 2017
Abstract
Montmorillonite (MMT) could be easily exfoliated into two-dimensional (2D) MMT nanosheets, leading to potential applications in many fields. In this work, the varying exfoliation properties of Na– and Ca–MMTs were investigated through atomic force microscopy (AFM) and molecular dynamics simulation for energy calculation in order to understand the effect of interlayer cations on the preparation of 2D MMT nanosheets. AFM results showed direct evidence that Na–MMT is easier to be exfoliated than Ca–MMT in the 2D nanosheet preparation. This observation was due to Ca–MMT having a higher interlayer binding energy (IBE) than Na–MMT because of the charge effect of the cations. Besides, the interaction energy between the water layer and two MMT layers (EW–M) of Na–MMTs was lower than that of Ca–MMTs at the same water content. In addition, it was found the exfoliated Ca–MMT had a larger particle diameter than that of exfoliated Na–MMT. These findings might be helpful for the preparation and application of 2D MMT nanosheets through controlling the exfoliation of MMT.
1. Introduction
Two-dimensional (2D) materials have attracted enormous research interests due to their extraordinary physical, chemical and mechanical properties.1,2 Graphene, as the first example of the 2D material family, has a wide variety of applications in electronics, sensors, and energy devices.3 The isolation of graphene has provided the methodology to study other 2D layered materials such as transition metal dichalcogenides (TMDs),4–6 layered double hydroxides7–9 and layered aluminosilicate minerals.10 Montmorillonite (MMT) is a typical layered aluminosilicate mineral with a 2![[thin space (1/6-em)]](https://www.rsc.org/images/entities/char_2009.gif) :1 structural unit of two silica tetrahedral sheets sandwiching an alumina octahedral sheet.11 The strong chemical bonds in-plane but weak van der Waals and electrostatic forces between the layers provide MMT with the ability to form freestanding atomic layers after exfoliation.12 The possible route to obtain exfoliated nanosheets involves the method of stirring and ultrasound or shearing treatment.13–15 The exfoliated MMT nanosheet is a promising matrix material for assembling nanoparticles due to its 2D sheet-like morphology, large specific surface area, and abundant hydroxyl groups.10 MMT nanosheets also exhibit excellent adsorption capability in removing dyes from aqueous solutions or heavy metal ions in water.16 Moreover, the 2D MMT nanosheet has wide application in industry for its better mechanical/heat stability properties, barrier properties or gas absorbability than graphene nanosheets.14 Thus, the exfoliated nanosheets of MMT may have potential application in the fields of hydrogen accumulators, catalysts and other potential fields.17
:1 structural unit of two silica tetrahedral sheets sandwiching an alumina octahedral sheet.11 The strong chemical bonds in-plane but weak van der Waals and electrostatic forces between the layers provide MMT with the ability to form freestanding atomic layers after exfoliation.12 The possible route to obtain exfoliated nanosheets involves the method of stirring and ultrasound or shearing treatment.13–15 The exfoliated MMT nanosheet is a promising matrix material for assembling nanoparticles due to its 2D sheet-like morphology, large specific surface area, and abundant hydroxyl groups.10 MMT nanosheets also exhibit excellent adsorption capability in removing dyes from aqueous solutions or heavy metal ions in water.16 Moreover, the 2D MMT nanosheet has wide application in industry for its better mechanical/heat stability properties, barrier properties or gas absorbability than graphene nanosheets.14 Thus, the exfoliated nanosheets of MMT may have potential application in the fields of hydrogen accumulators, catalysts and other potential fields.17
MMT mineral typically consists of stacked sheets connected via cations, such as Na+ and Ca2+. In the presence of water these cations tend to hydrate, leading to the entrance of water molecules into the interlayers and the hydration swelling of MMT.18 The interlayer cations have different ion radius and charge exhibiting different hydration properties, which were thought playing an important role in influencing hydration swelling.19 And hydration swelling of cations would give rise to the different basal spacing, interlayer binding energy (IBE), and swelling capacity of MMT.11,20,21 However, no research reported on the effect of varing interlayer cations on the exfoliation of MMTs into 2D nanosheets. An understanding of the exfoliation properties of different MMTs can help to predict and control the properties of MMT nanosheets. Moreover, the exfoliation of MMT is crucial for the application of the MMT nanosheets e.g. the synthesis of polymer nanocomposites.22–24 Therefore, the fundamental research based on the exfoliation properties of MMTs with varying metal cations in interlayers are of great significance for the preparation and application of 2D nanosheets.
In this work, an attempt has been made to investigate the effect of interlayer ions on the exfoliation properties of MMTs. The varying exfoliation properties of Na– and Ca–MMTs were first investigated through atomic force microscopy (AFM) technique and molecular dynamics simulation. A series of research works were carried out on Na– and Ca–MMTs which were prepared by cation exchange from the same MMT. AFM was performed to study the morphologies, thickness distribution and particle diameter of MMTs, which would show direct evidence of varying exfoliation properties of Na– and Ca–MMTs. The IBE and the energy between the water layer and two MMT layers (EW–M) were calculated by molecular dynamics simulation to reveal the mechanism of varying effects of cations on MMT exfoliation. Besides, the particle size analyzer was performed to characterize the particle size distribution of exfoliated Na– and Ca–MMT nanosheets.
2. Experimental
2.1. Materials and chemicals
Nature Na–MMT sample used in this work was collected from Chifeng Ningcheng MMT Co., Ltd (Inner Mongolia, China). Sodium chloride (NaCl), calcium chloride (CaCl2) and hydrochloric acid (HCl) were purchased from Sinopharm Chemical Reagent Co., Ltd (Shanghai, China). Milli-Q ultrapure water with a resistivity of 18.2 MΩ cm was used throughout.
2.2. Sample preparation
MMT was purified according to the following steps: first, 50 g Na–MMT was dispersed in 1000 mL ultrapure water by mechanical stirring (IKA RW 20, Germany) with 500 rpm for 3 h to form a suspension with the proportion of 5% (MMT-to-water, wt%). Then, the suspension was centrifuged using a Sorvall ST16 centrifuge (Thermo Fisher Scientific, U.S.A.) at 188 × g for 1 min to remove sedimentated impurities. After that, the supernatant was collected and centrifuged at 10956 × g for 5 min to remove water. Finally, the dehydrated MMT slurry was freeze-dried, and the purified MMT sample was gotten after grinding.
The purified MMT was modified by cation exchange as following steps: 20 g purified MMT was dispersed in 400 mL NaCl, CaCl2 solution (1 mol L−1), respectively, stirring with 500 rpm for 3 h at 70 °C. The suspension with the proportion of 5% (MMT-to-water, wt%) was centrifuged at 10956 × g for 5 min and MMT sediment was collected. Then, the collected MMT sediment was dispersed in 400 mL NaCl, CaCl2 solution (1 mol L−1) to start the second cation exchange. Finally, the MMT sediment was collected after the third cation exchange and washed by ultrapure water. After solid–liquid separation by centrifuge at 10956 × g for 5 min, the ionic-exchange MMT sediments were gotten and saved without freeze drying. The exfoliation of ionic-exchange MMTs was performed by a CP505 ultrasonic dispersion instrument (Vernon Hills, U.S.A.) at a strength of 40% for 4 min throughout. It should be pointed out that the clay concentration was found to be insensitive to the exfoliation kinetics. But MMTs tend to form gel after exfoliation in the high clay concentration, which should be avoided in the ultrasonic exfoliation.
Fig. 1 and the inset of Fig. 1 give the X-ray diffraction (XRD) patterns and small-angle XRD patterns of the samples after cation exchange form purified MMT. The XRD patterns confirm the crystal phase of MMTs and indicate that MMTs after purification and cation exchange are of high purity. Moreover, the (001) peaks of MMTs are observed at 2θ = 7.4° and 5.6°, from which the basal spacing d001 calculated by Bragg's law were 1.21 nm and 1.56 nm, respectively. It indicated that the Na– and Ca–MMTs were successfully prepared by cation exchange. X-Ray fluorescence spectrometer (XRF) was performed to know the chemical compositions of the MMT samples. The datas of nature MMT and purified MMT are given in Table 1, which shows that the alumina and silica oxide are present in major quantities and some impurities (some components consisting of P, S, Ti, Mn or Ca elements) are reduced after purification.
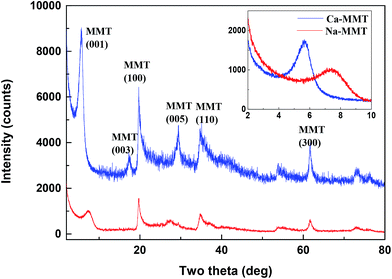 |
| | Fig. 1 XRD patterns of the Na– and Ca–MMTs in the range of 2–80°. Inset figure shows small-angle XRD patterns of the Na– and Ca–MMTs in the range of 2–10°. | |
Table 1 Chemical composition of nature MMT and purified MMT (wt%)
| Composition |
MMT |
Purified MMT |
| SiO2 |
58.59 |
55.43 |
| Al2O3 |
14.65 |
13.88 |
| Fe2O3 |
5.89 |
6.04 |
| MgO |
5.13 |
4.83 |
| CaO |
2.51 |
2.42 |
| Na2O |
1.70 |
1.31 |
| TiO2 |
0.95 |
0.97 |
| P2O5 |
0.32 |
0.09 |
| K2O |
0.28 |
0.28 |
| MnO |
0.08 |
0.05 |
| SO3 |
0.13 |
0.05 |
| L.O.I. |
9.77 |
14.65 |
2.3. Measurements
2.3.1. XRD and XRF measurement. XRD patterns of MMT were obtained using a D8 advance diffractometer (Bruker, Germany) with Cu Kα radiation. The accelerating voltage was 40 kV and the anode current was 150 mA. The wide-angle diffraction patterns were collected in the range of 10–80° (2θ) with a scanning speed of 5° min−1, while the small-angle diffraction patterns were collected in the range of 2–10° (2θ) with a scanning speed of 0.5° min−1. The chemical compositions of the MMT samples were measured by AXIOS X-ray fluorescence spectrometer (PANalytical.B.V, Holland).
2.3.2. AFM measurement. The observation of MMT was performed using a MultiMode 8 AFM (Bruker, USA) with PeakForce Tapping mode in air. ScanAsyst-Air Si3N4 probe with a radius of 2 nm was used in AFM experiments. The MMT suspension sample for AFM experiments was first prepared by diluting purified MMTs sediment 300 times with water. Then, the sample for AFM measurement was prepared by dropping 10 μL MMT suspension dispersions on a freshly cleaved mica surface (area of 1 cm2). After samples were dried at room temperature, images in air were captured with automatically optimized scan parameters including setpoint, feedback response, and scan rate. In order to obtain the distribution of sheet thickness, 50 original purified MMT sheets and 250 exfoliated MMT sheets were captured. Thickness datas were obtained using NanoScope Analysis 1.5 software.
2.3.3. Particle size measurement. The particle size distribution of exfoliated Na– and Ca–MMTs was determined by Mastersizer 2000 Laser Particle Analyzer (Malvern, U.K.). Moreover, the krumbein diameter of MMT nanosheets in the AFM images was also determined by NanoScope Analysis software. 50 MMT nanosheets were measured and the arithmetic average of these 50 measurements was calculated.
2.4. Molecular dynamics simulation
Molecular dynamics simulation was performed to calculate the IBE of MMT. The determination of interlayer binding energy is defined as the energy required removing one single layer from the neighbouring single layer,25 as shown in eqn (1):| | |
IBE = Etotal − Elayer1 − Elayer2
| (1) |
Moreover, molecular dynamics simulation was also performed to calculate EW–M according to eqn (2):
| | |
E(W–M) = Etotal − Elayer1 − Elayer2 − Ewater
| (2) |
where
Etotal is the total energy of the crystal before being separated, while
Elayer1 and
Elayer2 are energies of two layers,
Ewater is the energy of interlayer water with ions around.
The tasks of energy optimization and molecular dynamics simulation in this work were all carried out in Forcite module of Materials Studio 8.0. The clay force field (CLAYFF) was choosed for simulation running. The space group of MMT is C2/m. The structure model of MMT was built according to the empirical models introduced by Skipper.26,27 The fundamental cell parameters were a = 0.523 nm, b = 0.906 nm, c = 0.960 nm, and α = γ = 90°, β = 99°. Table 2 shows the atomic coordinate of MMT unit cell.28 Super-cell model included two clay layers where each layer contained 2 × 2 × 1 unit cell. While two Al ions were substituted by two Mg ions in alumina octahedral sheet, and two Si ions were substituted by two Al ions in silica tetrahedron sheet. The negative charge of MMT layer was balanced by interlayer cations. H2O molecules were randomly placed in the interlayer of MMT in all simulations. In the simulation process, the geometry optimization task was first carried on the structure models. After that, molecular dynamics simulation was run under NPT ensemble (isobaric–isothermal ensemble: particle number (N), pressure (P) and temperature (T) are constant) conditions for 250 ps. The time step was 0.001 ps and the temperature was controlled at 298 K according to the Nosé–Hoover scheme.
Table 2 Atomic coordinates of MMT unite cell
| Atomic |
X |
y |
z |
| Al |
0.000 |
3.020 |
12.500 |
| Si |
0.472 |
1.510 |
9.580 |
| O |
0.122 |
0.000 |
9.040 |
| O |
−0.686 |
2.615 |
9.240 |
| O |
0.772 |
1.510 |
11.200 |
| O(OH) |
0.808 |
4.530 |
11.250 |
| H(OH) |
−0.103 |
4.530 |
10.812 |
| M+ |
0.000 |
4.530 |
6.250 |
3. Results and discussion
3.1. Thickness distribution of MMTs determined by AFM
Fig. 2a shows the AFM images of the original purified MMT without ultrasonic exfoliation. The 2D and 3D morphologies of original MMT were typically displayed as stacked sheets with varying thickness. Fig. 2b shows the thickness distribution of the original purified MMTs determined by AFM. It could be known that the thickness of original purified MMTs was mainly distributed in the range of 50–100 nm, and the percentage was 48%. Moreover, around 20% and 32% original purified MMTs had thickness ranging from 0–50 nm and 100–500 nm.
 |
| | Fig. 2 Typical 2D and 3D AFM morphology images (10 × 10 μm, 512 pixels) (a) and thickness distribution (b) of original purified MMT without ultrasonic exfoliation. | |
Fig. 3a shows the typical AFM image of exfoliated Na–MMT and cross section analysis along the line in AFM images of some individual sheets. The morphology of Na–MMT after ultrasonic exfoliation was displayed as nanosheets and the monolayer MMT nanosheets have a uniform distribution of thicknesses averaging ≈1.6 nm. However, a monolayer MMT nanosheet comprising 7 atomic layers between the top and bottom O atoms, the total thickness was approximately 1 nm.29 The 1.6 nm thickness of monolayer nanosheets is slightly larger than the expected ≈1 nm, which was likely due to hydration occurred on MMT nanosheets.14,28 Besides, the thickness distribution of the Na–MMTs after ultrasound exfoliation was shown in Fig. 3b. The percentage of Na–MMT nanosheets in thickness less than 10 nm was 97.6%, indicating that 2D MMT nanosheets were well prepared. Moreover, the percentage of Na–MMT nanosheets in thickness of 1–2 nm was 62.4%, demonstrating that most of Na–MMTs were exfoliated into monolayer nanosheets. Therefore, the exfoliation of MMT with monovalent Na+ in interlayer is of efficient implementations.
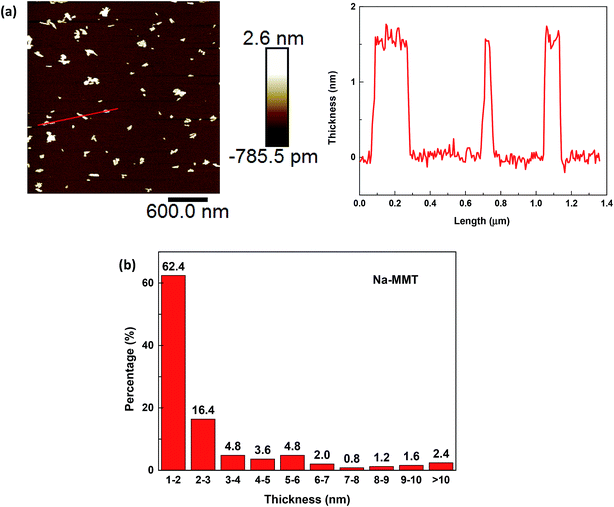 |
| | Fig. 3 Typical AFM morphology image (3 × 3 μm, 512 pixels) of Na–MMT nanosheets and topographic profile along the red line in the corresponding image (a). Thickness distribution of the Na–MMTs after ultrasonic exfoliation (b). | |
Fig. 4a shows the typical AFM image of exfoliated Ca–MMT as well as the topographic profile along lines in the corresponding image. The morphology of exfoliated Ca–MMT was in the form of few stacked nanosheet with varying thickness. Some Ca–MMTs were exfoliated into monolayer nanosheets which were also in thickness of approximately 1.6 nm (red line), some were in thickness of 5–6 nm (blue line), while some were in thickness of 25.0 nm (black line). Fig. 4b showed the thickness distribution of the Ca–MMTs after ultrasonic exfoliation. It could be known that total of 35.2% exfoliated Ca–MMTs had thickness ranging from 1–10 nm, thus 35.2% exfoliated Ca–MMTs were thought to be prepared into 2D nanosheets. However, only 8% Ca–MMTs were exfoliated into monolayer nanosheets. Comparing with the results that 97.6% and 62.4% Na–MMTs were exfoliated into 2D nanosheets and monolayer nanosheets, it was found that Ca–MMT is more difficult to be exfoliated into 2D nanosheets under the same exfoliation condition. The varying exfoliation properties of MMTs might lead to different characters of MMT nanosheets e.g. specific surface area, which might affect the surface-adsorption capacity of clay for water treatment.16,30
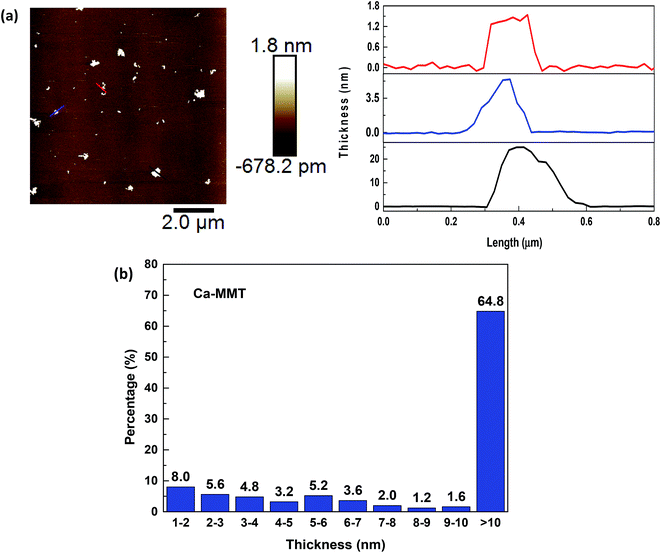 |
| | Fig. 4 Typical AFM image (10 × 10 μm, 512 pixels) of exfoliated Ca–MMT and the topographic profile along lines in the corresponding image (a). Thickness distribution of the Ca–MMTs after ultrasonic exfoliation (b). | |
3.2. IBE and E(W–M) of Na– and Ca–MMTs
The structure models of original Na– and Ca–MMTs after substitutions are displayed in Fig. 5. It was observed that two tetravalent Si atoms and two trivalent Al atoms were substituted by two Al atoms and two Mg atoms. Two 2:1 structural unit layers were mirror images. Four Na ions or two Ca ions were in interlayer to balance the negative charge of MMT layers. The IBE of original Na– and Ca–MMTs were calculated through molecular dynamics simulation according to the eqn (1). The results showed the IBE of original Na– and Ca–MMTs were 389.94 kcal mol−1 and 694.57 kcal mol−1, respectively. It might be due to that Ca ions have higher charge density than Na ions,31 leading to greater electrostatic interaction between the Ca ions and MMT unit layers. Therefore, the charge effect of the cations on the IBE is one of reason for varying exfoliation properties of Na– and Ca–MMTs.
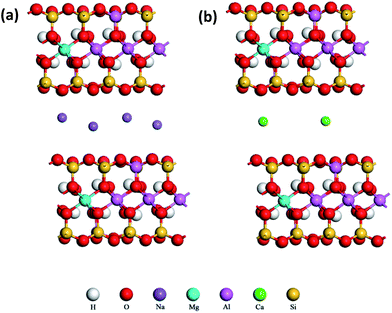 |
| | Fig. 5 Original structure models of Na–MMT (a) and Ca–MMT (b) after isomorphic substitution. Four Na ions or two Ca ions were in interlayer to balance the negative charge of MMT layers caused by isomorphic substitution. | |
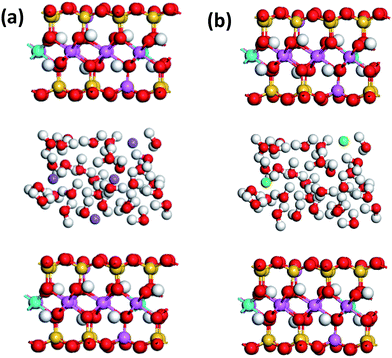
It was known that the interlayer cations tend to hydrate in the water, which would lead to the entrance of water molecules into interlayer and the hydration swelling of MMT.18 Thus, it has necessary to take into account the effect of the interlayer species containing water on the exfoliation of MMT layers. In this work, 30, 45, 60H2O molecules were adsorbed into MMT interlayer, and the E(W–M) of Na– and Ca–MMTs with those interlayer water were studied. The typical structure models of Na– and Ca–MMTs with 30H2O molecules in interlayer were shown in Fig. 6. It was observed that 30H2O molecules were randomly placed in the interlayer of original Na– and Ca–MMTs after substitutions. The molecular dynamics simulations were performed on the MMT–water–ion systems to calculate the E(W–M) of Na– and Ca–MMTs according to the eqn (2). The results of E(W–M) of Na– and Ca–MMTs were shown in Fig. 7. The values of E(W–M) of Na–MMTs with 30, 45, 60H2O molecules in interlayer were 588.18 kcal mol−1, 611.55 kcal mol−1, 998.55 kcal mol−1, while the case for Ca–MMTs were 782.86 kcal mol−1, 1112.24 kcal mol−1, 1479.97 kcal mol−1, respectively. It could be found that the E(W–M) of Na–MMT is always lower than that of Ca–MMTs at the same water content. This might be mainly attributed to that the higher charge density of Ca ions leaded to greater electrostatic interaction between the Ca ions and MMT unit layers,31 so that greater attractive force existed between the MMT layers and interlayer water with Ca ions around. Moreover, Na and Ca ions might have varying effect on the hydrogen bond dynamics of interlayer water which, in turn, may fluence the equilibrium and dynamical properties of ions and water molecules in the interlayer spaces.31,32 All in all, another reason for the easier exfoliation of Na–MMT than Ca–MMT might be the weaker interaction of the water layer with Na–MMT unit layers than that with Ca–MMT unit layers.
 |
| | Fig. 6 Typical structure models of Na–MMT (a) and Ca–MMT (b) with 30H2O molecules in interlayer. | |
 |
| | Fig. 7 Values of the E(W–M) of Na– and Ca–MMTs with 30, 45, 60H2O molecules in interlayer. | |
3.3. Particle size of exfoliated Na– and Ca–MMTs
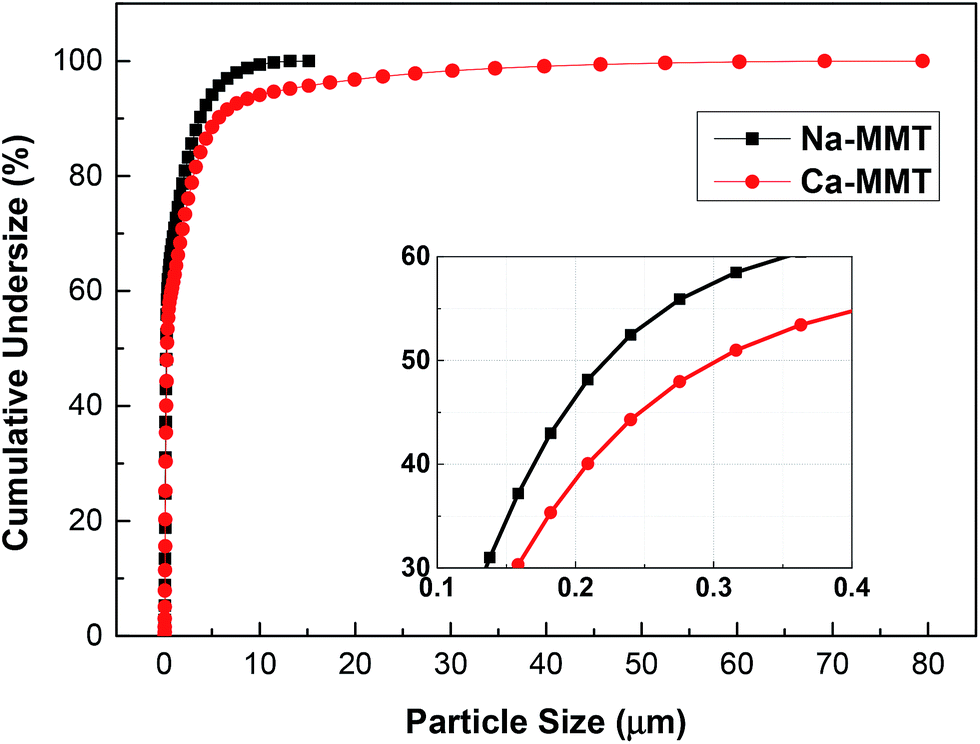
In this part, the particle size distribution and the quantitative particle diameter of exfoliated MMTs were investigated by laser particle size analyzer and AFM image analysis, respectively, for a comprehensive understanding of the properties of exfoliated MMT nanosheets. Fig. 8 shows the particle size distribution of the exfoliated Na– and Ca–MMTs after ultrasonic treatment. The results indicated that Ca–MMT particles had wider distribution range than Na–MMT. Moreover, the inset figure of Fig. 8 shows that the d50 (particle size at 50% cumulative undersize) of the Na– and Ca–MMTs were approximately 0.2 μm and 0.3 μm. And the d90 (particle size at 90% cumulative undersize) of the Na– and Ca–MMTs were approximately 3.7 μm and 5.7 μm. The particle diameter d of MMT nanosheets could be analyzed form AFM images, which was read form the values of horizontal axis in topographic profile as shown in Fig. 3a and 4a. While dNa–MMT = 0.145 ± 0.074 μm and dCa–MMT = 0.365 ± 0.163 μm. These results indicated that Ca–MMT has a larger diameter than Na–MMT after exfoliation.
 |
| | Fig. 8 Particle size distribution of Na– and Ca–MMTs after ultrasonic treatment. Inset figure shows the enlarged view of particle size distribution of the exfoliated Na– and Ca–MMTs in the range of 0.1–0.4 μm. | |
4. Conclusions
In this work, atomic force microscopy (AFM) technique and molecular dynamics simulation were performed to investigate varying exfoliation properties of Na– and Ca–MMTs. Single layer of nanosheets in thickness of 1.6 nm could be prepared form both Na– and Ca–MMTs through ultrasonic exfoliation. However, it is easier to exfoliate Na–MMT than Ca–MMT in the 2D nanosheet preparation. The reason might be due to the higher charge density of Ca ions leading to the higher IBE of Ca–MMT. Another reason might be attributed to the weaker interaction of the MMT layers with water layer with Na ions around than that with Ca ions around. In addition, exfoliated Ca–MMT has a wider particle size distribution and larger particle diameter than exfoliated Na–MMT. These findings might be helpful for the preparation and application of 2D MMT nanosheets through controlling the exfoliation of MMT.
Conflicts of interest
There are no conflicts to declare.
Acknowledgements
The financial supports to this work from the National Natural Science Foundation of China under the projects No. 51474167 and 51674183 were gratefully acknowledged.
References
- K. S. Kim, Y. Zhao, H. Jang, S. Y. Lee, J. M. Kim, K. S. Kim, J. Ahn, P. Kim, J. Choi and B. H. Hong, Nature, 2009, 457, 706 CrossRef CAS PubMed.
- Y. Hou, Z. Wen, S. Cui, X. Guo and J. Chen, Adv. Mater., 2013, 25, 6291 CrossRef CAS PubMed.
- Y. Huang, J. Guo, Y. Kang, Y. Ai and C. M. Li, Nanoscale, 2015, 7, 19358 RSC.
- G. A. Muller, J. B. Cook, H. Kim, S. H. Tolbert and B. Dunn, Nano Lett., 2015, 15, 1911 CrossRef CAS PubMed.
- Y. Zhang, B. Zheng, C. Zhu, X. Zhang, C. Tan, H. Li, B. Chen, J. Yang, J. Chen, Y. Huang, L. Wang and H. Zhang, Adv. Mater., 2015, 27, 935 CrossRef CAS PubMed.
- M. Annamalai, K. Gopinadhan, S. A. Han, S. Saha, H. J. Park, E. B. Cho, B. Kumar, A. Patra, S. Kim and T. Venkatesan, Nanoscale, 2016, 8, 5764 RSC.
- Z. Hu and G. Chen, Adv. Mater., 2014, 26, 5950 CrossRef CAS PubMed.
- G. Abellán, E. Coronado, C. Martí-Gastaldo, A. Ribera, J. L. Jordá and H. García, Adv. Mater., 2014, 26, 4156 CrossRef PubMed.
- J. Zhao, J. Chen, S. Xu, M. Shao, Q. Zhang, F. Wei, J. Ma, M. Wei, D. G. Evans and X. Duan, Adv. Funct. Mater., 2014, 24, 2938 CrossRef CAS.
- K. Peng, L. Fu, J. Ouyang and H. Yang, Adv. Funct. Mater., 2016, 26, 2666 CrossRef CAS.
- X. Zhang, H. Yi, Y. Zhao, F. Min and S. Song, Adv. Powder Technol., 2016, 27, 779 CrossRef CAS.
- V. Nicolosi, M. Chhowalla, M. G. Kanatzidis, M. S. Strano and J. N. Coleman, Science, 2013, 340, 1420 CrossRef CAS.
- C. Mu, X. Li, Y. Zhao, H. Zhang, L. Wang and D. Li, J. Appl. Polym. Sci., 2013, 128, 3141 CrossRef CAS.
- Y. Zhao, H. Yi, F. Jia, H. Li, C. Peng and S. Song, J. Powder Technol., 2017, 306, 74 CrossRef CAS.
- H. Li, Y. Zhao, S. Song and Y. Nahmad, Minerals, 2015, 2, 1 CrossRef.
- M. Matejdes, A. Czímerová and M. Janek, Appl. Clay Sci., 2015, 114, 9 CrossRef CAS.
- Z. Zhang, L. Liao, Z. Xia and C. Li, Appl. Clay Sci., 2012, 55, 75 CrossRef CAS.
- E. S. Boek, P. V. Coveney and N. T. Skipper, J. Am. Chem. Soc., 1995, 117, 12608 CrossRef CAS.
- D. A. Young and D. E. Smith, J. Phys. Chem. B, 2000, 104, 9163 CrossRef CAS.
- F. Jia, B. Yang, Q. Wan and S. Song, Comput. Mater. Sci., 2017, 132, 74 CrossRef CAS.
- J. Liu, Y. Zhao, H. Li, T. Chen and S. Song, J. Dispersion Sci. Technol., 2017, 38, 1035 CrossRef CAS.
- K. Kolman, W. Steffen, G. Bugla-Płoskońska, A. Skwara, J. Pigłowski, H. Butt and A. Kiersnowski, J. Colloid Interface Sci., 2012, 374, 135 CrossRef CAS PubMed.
- T. A. Saleh, Applying Nanotechnology to the Desulfurization Process in Petroleum Engineering, IGI Global, 2015 Search PubMed.
- T. A. Saleh and V. K. Gupta, Nanomaterial and Polymer Membranes: Synthesis, Characterization, and Applications, Elsevier Science & Technology, 2016 Search PubMed.
- Z. Liu, J. Z. Liu, Y. Cheng and Q. Zheng, Phys. Rev. B: Condens. Matter Mater. Phys., 2012, 85, 45 Search PubMed.
- E. S. Boek, P. V. Coveney and N. T. Skipper, J. Am. Chem. Soc., 1995, 117, 12608 CrossRef CAS.
- F. R. C. Chang, N. T. Skipper and G. Sposito, Langmuir, 1995, 11, 2734 CrossRef CAS.
- H. Yi, X. Zhang, Y. Zhao, L. Liu and S. Song, Surf. Interface Anal., 2016, 48, 976 CrossRef CAS.
- J. Zhu, X. Liu, M. L. Geier, J. J. McMorrow, D. Jariwala, M. E. Beck, W. Huang, T. J. Marks and M. C. Hersam, Adv. Mater., 2016, 28, 63 CrossRef CAS PubMed.
- H. A. Sani, M. B. Ahmad and T. A. Saleh, RSC Adv., 2016, 6, 108819 RSC.
- S. Senapati, J. Chem. Phys., 2007, 126, 204710 CrossRef PubMed.
- A. Chandra, Phys. Rev. Lett., 2000, 85, 768 CrossRef CAS PubMed.
|
| This journal is © The Royal Society of Chemistry 2017 |
Click here to see how this site uses Cookies. View our privacy policy here. 
 Open Access Article
 This Open Access Article is licensed under a Creative Commons Attribution-Non Commercial 3.0 Unported Licence
 *ab
*ab