 Open Access Article
Creative Commons Attribution 3.0 Unported Licence
Development of supramolecular solvent based microextraction prior to high performance liquid chromatography for simultaneous determination of phenols in environmental water
Ketsarin Seebunruenga,
Chaiyawat Dejchaiwatanaa,
Yanawath Santaladchaiyakitb and
Supalax Srijaranai *a
*a
aMaterials Chemistry Research Center, Department of Chemistry and Center of Excellence for Innovation in Chemistry, Faculty of Science, Khon Kaen University, Khon Kaen 40002, Thailand. E-mail: supalax@kku.ac.th; Tel: +66 43 009700 ext. 42175
bDepartment of Chemistry, Faculty of Engineering, Rajamangala University of Technology Isan, Khon Kaen Campus, Khon Kaen 40000, Thailand
First published on 27th October 2017
Abstract
A simple and eco-friendly preconcentration method, supramolecular solvent (SUPRAS) based microextraction, combined with high performance liquid chromatography (HPLC) has been developed for the determination of phenols in water. Seven phenols include phenol, 4-nitrophenol, 2-chlorophenol, 2-nitrophenol, 4-chloro-3-methylphenol, 2,4-dichlorophenol and 2,4,6-trichlorophenol. The SUPRAS fulfills the requirement of green and sustainable analytical chemistry in that surfactant was used for extraction in mild conditions without the requirement of heating, organic solvent and acid addition. The SUPRAS was produced from micelles of anionic surfactant (sodium dodecyl sulfate; SDS) and cationic surfactant (tetrabutylammonium bromide; TBABr) at the molar ratio of 1![[thin space (1/6-em)]](https://www.rsc.org/images/entities/char_2009.gif) :
:![[thin space (1/6-em)]](https://www.rsc.org/images/entities/char_2009.gif) 3. After AlCl3 addition, a turbid solution was observed due to the neutralization charge of micellar head groups with the counterion (Al3+) of salt, resulting in liquid–liquid separation. After centrifugation, the SUPRAS was separated by floating on the top layer. Under the optimum conditions, a high enrichment factor (25 to 64), low limit of detection (1 to 4 μg L−1) and good repeatability (RSD ≤ 10.1%) were obtained. The SUPRAS-HPLC was successfully applied for the determination of the studied phenols in environmental water samples with good recoveries (82 to 105%).
3. After AlCl3 addition, a turbid solution was observed due to the neutralization charge of micellar head groups with the counterion (Al3+) of salt, resulting in liquid–liquid separation. After centrifugation, the SUPRAS was separated by floating on the top layer. Under the optimum conditions, a high enrichment factor (25 to 64), low limit of detection (1 to 4 μg L−1) and good repeatability (RSD ≤ 10.1%) were obtained. The SUPRAS-HPLC was successfully applied for the determination of the studied phenols in environmental water samples with good recoveries (82 to 105%).
Introduction
Low molecular-weight phenols are intermediates widely used to manufacture medicines, pesticides, dyes, resins, and explosives.1 These compounds are considered as priority pollutants by the U.S. Environmental Protection Agency (USEPA) as well as by the European Union because of their high toxicity and prevalent presence in the environment.2,3 Thus, the development of analytical methods, both sample preparation and instrumental techniques, for the determination of trace or ultra-trace phenol residues has been required.4,5Extraction is still a popular sample preparation method, however the minimized scale is nowadays the trend for green analytical chemistry as it is faster and safer for the elimination of large consumption of organic solvents which are toxic and harmful to the environment and human health.6 Both solid phase microextraction (SPME)7,8 and liquid phase microextraction (LPME),9 the minimized scale for extraction, have gained enormous attention. Several modes of LPME have been developed such as dispersive liquid–liquid microextraction (DLLME)10,11 and single drop microextraction (SDME).12 Moreover, attention has been paid to the use of alternative solvents, mainly ionic liquids13,14 supercritical fluids15–17 and supramolecular solvents (SUPRASs).18
Supramolecular solvents (SUPRASs),18 the water-immiscible liquids have been widely used in extraction and preconcentration procedures due to their high ability to extract various types of substances including organic and inorganic species.19 The SUPRASs occurs through two steps including (i) aggregation of amphiphile providing supramolecular assembly, micelles or vesicles, in homogeneous solution and (ii) coacervation producing water-immiscible liquids (or SUPRAS phase) that separate from bulk solution. Aggregation of amphiphile molecules is the first self-assembly process in supramolecular solvent formation that autonomously and spontaneously occur when the concentration of amphiphile is higher than critical aggregation concentration (cac). While the second step, liquid–liquid separation, requires the action of external factors or coacervating agents such as amphiphilic counterions, electrolytes, temperature and pH.20
The most well-known SUPRASs extraction using surfactants is called cloud-point extraction (CPE) when the coacervation is obtained from neutrally charged (non-ionic or zwitterionic) surfactants21–23 or coacervative extraction (CAE) that coacervation obtained from ionic amphiphiles.24–26 Although these techniques are simple, cost-effective, rapid and less consumption of organic solvent, there are some limitations for chromatographic. Due to the viscosity and low volatility of SUPRAS phase, the use of these methods in CG is limited. In CPE, phase separation is obtained from non-ionic surfactant by increasing the temperature of the solution, which can be problematic for thermally-labile analytes, while the pH-induced ionic surfactant requires much dilution and adjustment of pH to make it compatible with the chromatographic systems.19
In this work, we present a new SUPRAS based microextraction in mild condition by using dodecyl sulfate anionic micelles in combination with counter-ion and electrolyte salt as dehydration agents for extraction of phenols in water samples prior to high performance liquid chromatography (HPLC). The phase separation was achieved after the centrifugation step without heating and organic solvent added. Phenols, moderately polar compounds with a wide range of pKa values (pKa of 4.08–10.09) were selected as the model analytes. The parameters affecting the extraction efficiency of SUPRAS for phenols were studied including surfactant composition, pH, type and amount of salt, vortex time and centrifugation time.
Experimental
Chemicals and reagents
All reagents used were analytical reagent grade or higher. The analytical standard phenols were obtained from Aldrich (USA) including phenol, 4-nitrophenol (4NP), 2-chlorophenol (2CP), 2-nitrophenol (2NP), 4-chloro-3-methylphenol (4C3MP) and 2,4-dichlorophenol (2,4DCP) except 2,4,6-trichlorophenol (2,4,6TCP) was obtained from Fluka (India). The stock solutions of each phenol were prepared at 1000 mg L−1 by dissolving an appropriate amount in methanol (MeOH). SDS was purchased from BDH (England), while TBABr was purchased from Fluka (India). The individual stock solution of SDS (0.5 mol L−1) and TBABr (1 mol L−1) were prepared in deionized water. Acetonitrile (ACN) and MeOH were obtained from Merck (Germany). Sodium chloride, magnesium chloride and aluminium chloride were purchased from APS (Australia). All solutions were prepared in deionized water with the resistivity of 18.2 MΩ cm from RiOs™ Type I Simplicity 185 (Millipore water, USA).Instruments
An Agilent 1200 liquid chromatography equipped with a diode array detector (DAD), a binary pump and injection valve with a 20 μL loop, was used for HPLC analysis. A reversed phase Symmetry C8 (5 μm, 3.9 × 150 mm) was used as the LC analytical column. An OpenLab CDS ChemStation was used for the system control and the acquisition and analysis of data. The separation of seven studied phenols was performed with isocratic elution using the mixture of ACN and 0.1% (v/v) acetic acid (40![[thin space (1/6-em)]](https://www.rsc.org/images/entities/char_2009.gif) :
:![[thin space (1/6-em)]](https://www.rsc.org/images/entities/char_2009.gif) 60) at a flow rate of 1 mL min−1 and detection at 280 nm. A vortex mixer (50 Hz) from Scientific Industries, INC (USA) was used to mix the solution and a centrifuge (Biomed group Co. Ltd, Thailand) was used for complete phase separation.
60) at a flow rate of 1 mL min−1 and detection at 280 nm. A vortex mixer (50 Hz) from Scientific Industries, INC (USA) was used to mix the solution and a centrifuge (Biomed group Co. Ltd, Thailand) was used for complete phase separation.
Water sample preparation
Water samples studied were collected from lakes (Muang District, Khon Kaen, Thailand) and agricultural field (Banpai District, Khon Kaen, Thailand). The samples were filtered through a Whatman (no. 42) filter paper before analysis. An aliquot of 10 mL sample was used for the extraction by SUPRAS based microextraction method.SUPRAS based microextraction
A 10 mL-aliquot of a standard solution of the phenol mixture or sample solution was placed in a centrifuged tube. Then, 25 mmol L−1 SDS and 75 mmol L−1 TBABr were added into the solution. After the addition of 15% (w/v) of AlCl3, the solution was then vortexed at 1800 rpm for 15 s to form a cloudy solution. The solution was then centrifuged at 3500 rpm for 4 min for complete phase separation. Then, the SUPRAS phase (upper phase) was collected using a micro-syringe and subsequently injected into HPLC for analysis.Results and discussion
Optimization of SUPRAS extraction
The parameters affecting the extraction efficiency were studied. The experiments were performed in triplicate and the extraction efficiency is evaluated in term of enrichment factor (EF).The EF was calculated using the concentration of analytes in the SUPRAS phase (Cex) divided by the initial analyte concentration in the aqueous sample (C0).27
Surfactant composition
Generally, amount of SDS requires for micelle forming is higher than its critical micellar concentration (CMC of 8.3 mmol L−1).26 Thus, SDS concentration was investigated in the range of 10–75 mmol L−1 (as fixed molar ratio SDS![[thin space (1/6-em)]](https://www.rsc.org/images/entities/char_2009.gif) :
:![[thin space (1/6-em)]](https://www.rsc.org/images/entities/char_2009.gif) TBABr of 1
TBABr of 1![[thin space (1/6-em)]](https://www.rsc.org/images/entities/char_2009.gif) :
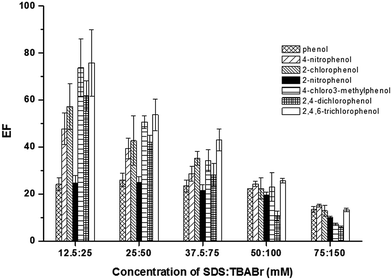
:![[thin space (1/6-em)]](https://www.rsc.org/images/entities/char_2009.gif) 2). The results (Fig. 1) indicated that the highest extraction efficiency of all the studied phenols was obtained at 12.5 mmol L−1 SDS. However, a decrease in the extraction efficiencies was observed, when the concentrations of SDS were increased. It is due to the volume of SUPRAS phase increased by direct proportion of SDS concentration, leading to a dilution effect of the analytes in the SUPRAS phase. However, at low concentration range of SDS (10–12.5 mmol L−1), the infinitesimal volume of SUPRAS phase was obtained, which was difficult to collect. This resulted in low precision of extraction efficiency. Thus, 25 mmol L−1 SDS was chosen for further experiments.
2). The results (Fig. 1) indicated that the highest extraction efficiency of all the studied phenols was obtained at 12.5 mmol L−1 SDS. However, a decrease in the extraction efficiencies was observed, when the concentrations of SDS were increased. It is due to the volume of SUPRAS phase increased by direct proportion of SDS concentration, leading to a dilution effect of the analytes in the SUPRAS phase. However, at low concentration range of SDS (10–12.5 mmol L−1), the infinitesimal volume of SUPRAS phase was obtained, which was difficult to collect. This resulted in low precision of extraction efficiency. Thus, 25 mmol L−1 SDS was chosen for further experiments.
To promote the phase separation, the addition of a co-surfactant with a small head group, an amphiphile counter-ion, was studied to replace the use of concentrate acid in the conventional method.28–30 In this work, SDS was used as dodecyl sulfate anionic micelle, thus the oppositely charge, TBABr, was investigated as the amphiphilic counter-ion to reduce ionic head group repulsion.29 An influence of TBABr (CMC = 588 mmol L−1) was investigated in the concentration range of 50–125 mmol L−1. The results (Fig. 2) revealed that the extraction efficiency of phenols sharply increased with an increase of TBABr concentration. The highest extraction efficiency was obtained at 75 mmol L−1 TBABr. Beyond this point, the extraction efficiency was slightly decreased. According to the concentrations of both surfactants used, the molar ratio of SDS and TBABr was ca. 1![[thin space (1/6-em)]](https://www.rsc.org/images/entities/char_2009.gif) :
:![[thin space (1/6-em)]](https://www.rsc.org/images/entities/char_2009.gif) 3.
3.
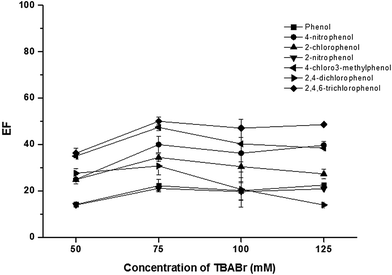 | ||
| Fig. 2 Effect of TBABr. Conditions: sample solution; 10 mL, SDS; 25 mmol L−1, AlCl3; 5% (w/v), vortex agitation time; 30 s, centrifugation time (3500 rpm); 10 min and 50 μg L−1 of each phenol. | ||
Effect of pH
LPME is based on the partition of analytes between two immiscible liquid phases, which organic solvent, either non-polar or weak polar, is generally used to extract the target analytes from aqueous solution. However, extraction of ionizable organic compounds such as phenols (pKa 4.08–10.09), is rather difficult, as they tend to be ionized in aqueous solution. In order to extract these analytes efficiently, the pH of the solutions should be controlled to keep the analytes in their neutral molecular forms. In this study, the pH of preconcentration procedure was studied in acid (pH 3), neutral (pH 7) and basic (pH 9). The results indicated that in the studied pH range, the pH did not significantly affect the extraction efficiency of all the studied phenols in the studied extraction system. It may be because SDS micelles in the studied condition have the capacity to extract both the ionized and neutral forms of phenols. Therefore, to simplify the experimental procedure, the original pH of solution (∼pH 7) was selected as the optimum pH.Effect of salt addition
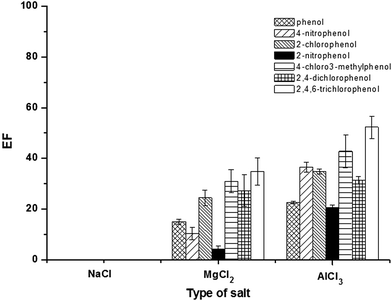
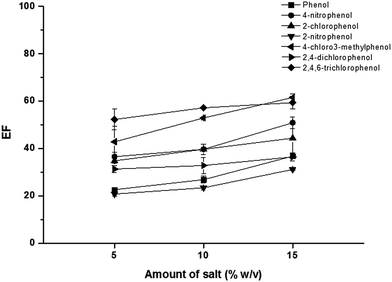
The addition of salt can promote the coagulation of micelles due to a decrease in the electrostatic attraction between oppositely charged, thus inducing the liquid–liquid phase separation and also improving the extraction efficiency due to salting-out effect.18,31 It has been reported that the concentration, hydrated radii, and valency of salts affect the phase separation of SUPRAS.32 In this study, the effect of chloride salt of various cations (Na+, Mg2+ and Al3+) i.e. NaCl, MgCl2, and AlCl3 on the extraction efficiency were investigated at a certain concentration (5%, w/v). As shown in Fig. 3, it is clearly seen that the addition of AlCl3 gave the highest extraction efficiency. This can be explained by the stronger binding of counterions to anionic micelles. This resulted in a reduction in the electrostatic repulsion between the ionic head groups, thus promoting the coacervation.32 Notify that for NaCl, there were low response and interference peaks. Therefore, AlCl3 was chosen for further studies.Amount of AlCl3 was also investigated in the range of 0–20% (w/v), as shown in Fig. 4. The extraction efficiency slightly increased with increasing the amount of AlCl3 from 5% to 15% (w/v). Beyond this point, high viscosity of SUPRAS phase was obtained. Therefore, 15% (w/v) AlCl3 was chosen for optimum extraction.
Effect of vortex extraction time
A vortex extraction time is one of the main factors in extraction procedure to facilitate the mass transfer of the analytes and thus increase the extraction efficiency. The effect of the vortex extraction time was studied over the range of 0–60 s. The results (data not shown) indicated that the extraction efficiency was constant throughout the time. However, at 0 s (without vortex), the result showed low precision due to high % RSD. Thus, 10 s for vortex was used for extraction procedure.Effect of centrifugation time
Centrifugation is a vital step for separating the extraction phase from the aqueous phase. To obtain the highest extraction efficiency, centrifugation times were evaluated from 2 to 10 min at 3500 rpm. The results (data not shown) showed that the highest extraction efficiency of all target analytes was obtained at 4 min of centrifugation time. Beyond this point, longer centrifugation times did not improve the extraction efficiency. Thus, 4 min was chosen as the optimum time throughout the studies.Analytical characteristics and method validations
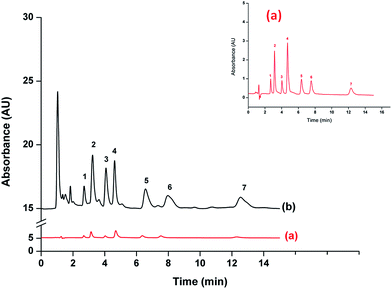
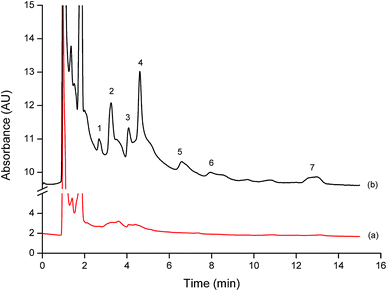
Fig. 5 shows the comparison chromatograms obtained from direct injection analysis at 500 μg L−1 of Ph, 4NP, 2CP and 2NP and 1000 μg L−1 of 4C3MP, 2,4DCP and 2,4,6TCP (Fig. 5(a)) and after preconcentration using the proposed method at 25 μg L−1 of 4NP and 2NP and 50 μg L−1 of Ph, 2CP, 4C3MP, 2,4DCP and 2,4,6TCP (Fig. 5(b)). The result indicates that the proposed method provided high sensitivity for phenols analysis.The analytical performance and validation parameters including linear ranges, limits of detection (LODs), limits of quantitation (LOQs), precisions (intra-day and inter-day) and enrichment factors (EF) were evaluated. The results are listed in Table 1. Good linearity was obtained in the range of 5–150 μg L−1 with a coefficient of determination (R2) greater than 0.9975. LOD and LOQ were evaluated by the analytes concentration giving the signal to noise ratio (S/N) of 3 and 10, respectively. LODs of the studied phenols were from 1 to 4 μg L−1, while LOQs ranged between 4 and 9 μg L−1. The intra-day (repeatability) precision (n = 5) and inter-day (reproducibility) precision (n = 5 × 3) of proposed method were evaluated as the relative standard deviations (RSD of the standard phenol mixture at 50 μg L−1). High precision was achieved with RSD less than 1.3% for retention time and 10.1% for peak area. The EF, defined as the ratio of slope of calibration obtained from preconcentration to that of without preconcentration, was also investigated. The proposed method provided EF in the range from 25 to 64.
| Compound | Linearity (μg L−1) | Linear equation | R2 | LOD (μg L−1) | LOQ (μg L−1) | EF | Intra-day (n = 5), % RSD | Inter-day (n = 5 × 3 days), % RSD | ||
|---|---|---|---|---|---|---|---|---|---|---|
| tR | Area | tR | Area | |||||||
| a Values reported in parentheses obtained from the standards without preconcentration (direct injection). | ||||||||||
| Phenol | 10–150 (500–7000)a | y = 0.3064x + 1.0338 (y = 0.0107x − 0.2935) | 0.9994 (0.9999) | 2 (30) | 7 (90) | 29 | 0.2 | 3.2 | 0.5 | 7.0 |
| 4-Nitrophenol | 5–75 (500–7000) | y = 1.3485x + 0.5985 (y = 0.034x + 1.6344) | 0.9996 (0.9997) | 1 (20) | 4 (70) | 40 | 0.8 | 6.7 | 1.0 | 10.1 |
| 2-Chlorophenol | 10–150 (500–7000) | y = 0.4791x + 0.2595 (y = 0.0128x + 0.1417) | 0.9998 (1.0000) | 2 (40) | 7 (70) | 38 | 0.3 | 6.9 | 0.7 | 8.8 |
| 2-Nitrophenol | 5–75 (500–7000) | y = 1.4105x − 0.5518 (y = 0.0568x + 1.2463) | 0.9996 (1.0000) | 1 (20) | 4 (60) | 25 | 0.2 | 5.9 | 0.6 | 8.2 |
| 4-Chloro-3-methylphenol | 10–150 (1000–7000) | y = 0.6354x − 1.8154 (y = 0.0106x − 0.2322) | 0.9993 (0.9988) | 4 (40) | 9 (100) | 60 | 0.5 | 6.7 | 0.9 | 10.0 |
| 2,4-Dichlorophenol | 10–150 (1000–7000) | y = 0.4586x + 0.1421 (y = 0.0103x + 0.0109) | 0.9998 (0.9995) | 4 (40) | 9 (100) | 41 | 0.1 | 3.0 | 1.3 | 8.3 |
| 2,4,6-Trichlorophenol | 10–150 (1000–7000) | y = 0.6141x − 0.1052 (y = 0.0097x − 1.8362) | 0.9991 (0.9970) | 2 (30) | 7 (90) | 64 | 0.5 | 7.3 | 0.7 | 10.1 |
Determination of phenol residues in water samples
The proposed method was applied for the simultaneous determination of phenol residues in water samples including lake and agricultural field samples. The results showed that there was no contamination of the studied phenols in all water samples. To evaluate the accuracy, water samples were spiked with the phenol standards at three concentrations of 15, 20, and 25 μg L−1. The recoveries of the studied analytes in water samples are listed in Table 2. As can be seen, good recoveries were obtained in the range of 82–105% on average. Therefore, the proposed method provided the merits for the determination of such phenol residues in water samples. The chromatograms of the extracted phenols from agricultural field water sample before and after spiking with the standard phenol mixtures at different concentrations are depicted in Fig. 6. The LODs of phenols for the studied water samples were also evaluated. The LODs were in the range 4–9 μg L−1 which are lower than the maximum residue limit (MRL) of phenols in environmental water (3.5 mg L−1) established by European Union,2 indicating the potential of the proposed method for the determination of phenols in environmental water samples.| Analyte | Spiked | Agricultural field (n = 3) | Lake 1 (n = 3) | Lake 2 (n = 3) | ||||||
|---|---|---|---|---|---|---|---|---|---|---|
| Found (ng mL−1) | Recovery (%) | RSD (%) | Found (ng mL−1) | Recovery (%) | RSD (%) | Found (ng mL−1) | Recovery (%) | RSD (%) | ||
| a ND: not detected. | ||||||||||
| Phenol | 0 | NDa | — | — | ND | — | — | ND | — | — |
| 15 | 15.13 | 100.93 | 1.43 | 15.01 | 100.10 | 7.60 | 13.64 | 90.97 | 3.15 | |
| 20 | 18.62 | 93.12 | 2.00 | 19.74 | 98.72 | 1.89 | 18.76 | 93.73 | 5.01 | |
| 25 | 21.36 | 85.44 | 7.27 | 23.10 | 92.41 | 2.80 | 24.34 | 97.39 | 2.34 | |
| 4-Nitrophenol | 0 | ND | — | — | ND | — | — | ND | — | — |
| 15 | 13.92 | 92.81 | 7.11 | 15.24 | 101.62 | 1.64 | 13.51 | 93.55 | 2.39 | |
| 20 | 19.80 | 99.00 | 2.38 | 20.58 | 102.88 | 2.30 | 19.88 | 99.42 | 6.22 | |
| 25 | 22.96 | 91.83 | 1.67 | 24.56 | 98.26 | 0.91 | 24.22 | 98.49 | 4.11 | |
| 2-Chlorophenol | 0 | ND | — | — | ND | — | — | ND | — | — |
| 15 | 13.72 | 91.48 | 2.79 | 12.72 | 84.79 | 3.01 | 12.80 | 85.35 | 1.96 | |
| 20 | 18.90 | 94.52 | 4.05 | 16.56 | 82.82 | 4.00 | 19.74 | 98.70 | 5.13 | |
| 25 | 21.75 | 86.98 | 3.71 | 23.25 | 93.00 | 6.93 | 25.67 | 102.70 | 2.98 | |
| 2-Nitrophenol | 0 | ND | — | — | ND | — | — | ND | — | — |
| 15 | 15.47 | 103.11 | 3.81 | 15.06 | 100.42 | 2.59 | 15.37 | 102.44 | 3.29 | |
| 20 | 19.06 | 95.31 | 2.79 | 20.25 | 101.26 | 2.41 | 19.32 | 96.58 | 5.70 | |
| 25 | 24.02 | 96.00 | 4.80 | 26.23 | 104.91 | 8.90 | 25.04 | 100.15 | 2.98 | |
| 4-Chloro-3-methylphenol | 0 | ND | — | — | ND | — | — | ND | — | — |
| 15 | 14.89 | 99.29 | 2.28 | 13.86 | 92.38 | 5.78 | 14.75 | 98.30 | 5.43 | |
| 20 | 17.70 | 88.54 | 2.90 | 19.71 | 98.53 | 2.84 | 18.97 | 94.83 | 7.12 | |
| 25 | 24.37 | 97.48 | 1.39 | 24.07 | 96.27 | 2.42 | 22.00 | 88.00 | 2.54 | |
| 2,4-Dichlorophenol | 0 | ND | — | — | ND | — | — | ND | — | — |
| 15 | 13.74 | 91.60 | 1.44 | 13.00 | 86.69 | 4.61 | 13.26 | 88.42 | 7.41 | |
| 20 | 17.77 | 88.84 | 4.70 | 17.85 | 89.27 | 3.85 | 19.33 | 96.63 | 8.21 | |
| 25 | 23.83 | 95.32 | 3.27 | 23.74 | 94.98 | 5.17 | 23.74 | 94.98 | 3.34 | |
| 2,4,6-Trichlorophenol | 0 | ND | — | — | ND | — | — | ND | — | — |
| 15 | 13.59 | 90.60 | 4.82 | 15.06 | 100.45 | 3.00 | 13.93 | 92.92 | 1.08 | |
| 20 | 20.41 | 102.03 | 1.83 | 19.68 | 98.38 | 3.83 | 17.05 | 87.51 | 3.10 | |
| 25 | 21.85 | 87.40 | 1.19 | 25.07 | 100.37 | 4.33 | 21.41 | 85.66 | 4.27 | |
Comparison of proposed SUPRAS with the others
The extraction procedure and analytical performance of the proposed SUPRAS based microextraction were compared to the other SUPRAS techniques for the determination of phenols in water samples (Table 3). The analytical performances of the proposed SUPRAS based microextraction are comparable to the others in terms of LODs and recovery. The proposed method is superior to the others in terms of the formation of SUPRAS that could be obtained in mild condition by using dodecyl sulfate anionic micelles mixed with TBABr and AlCl3 at ambient temperature (without the rising of temperature and the addition of concentrated acid) and the extraction was rapid. In contrast, some research used non-ionic surfactant which required heat treatment (38–40 °C; around 20 min to 1 h) and the addition of concentrated acid to control phenols in neutral form.23,33,34 Another mild SUPRAS was presented by Jin et al.,35 using 0.46% cetrimide combined with 0.06% 1-octanol and high concentration of salt (40% NaCl). However, this technique has high LODs compared with the others. In 2008, Lopez-Jimenez and coworkers36 presented the high analytical performance techniques with low LODs and high accuracy. However, the method consisted of two steps; the SUPRAS was obtained by mixing decanoic acid and tetrabutyl ammonium hydroxide at a 2![[thin space (1/6-em)]](https://www.rsc.org/images/entities/char_2009.gif) :
:![[thin space (1/6-em)]](https://www.rsc.org/images/entities/char_2009.gif) 1 molar ratio and the SUPRAS (30 μL) was used as the extractant in single-drop microextraction technique with long extraction time (∼1 h).
1 molar ratio and the SUPRAS (30 μL) was used as the extractant in single-drop microextraction technique with long extraction time (∼1 h).
| Compounds | Sample type (volume) | SUPRAS | Component driving phase separation | Instrumental method | Analytical performance | Reference |
|---|---|---|---|---|---|---|
| 6 phenols | Water (10 mL) | −0.46% cetrimide | 40% NaCl | LC-UV | Phase volume: 270 μL | 23 |
| −0.06% 1-octanol | Recovery: 95–114% | |||||
| LODs: 27–62 μg L−1 | ||||||
| 5 phenols | Water (10 mL) | 0.5% Triton X-114 | −0.01 M H2SO4 | HPLC-UV | EF: 37–40 | 33 |
| −0.6 M NaCl | LODs: 2–8 μg L−1 | |||||
| −65 °C for 20 min | ||||||
| 14 phenols | Water (10 mL) | 3% Genapol X-080 | −85 °C | LC-UV | Phase volume: 1–2 mL | 34 |
| −6% NaCl | Recovery: 95–115% | |||||
| LODs: 1–10 μg L−1 | ||||||
| Phenol | Water (10 mL) | 13% Triton X-114 | 38 °C for 1 h | HPLC-UV | Recovery: 92.5% | 35 |
| 4 phenols | Water (20 mL) | Vesicle of 1![[thin space (1/6-em)]](https://www.rsc.org/images/entities/char_2009.gif) : :![[thin space (1/6-em)]](https://www.rsc.org/images/entities/char_2009.gif) 1 decanoic acid 1 decanoic acid![[thin space (1/6-em)]](https://www.rsc.org/images/entities/char_2009.gif) : :![[thin space (1/6-em)]](https://www.rsc.org/images/entities/char_2009.gif) dodecanoate/0.5% (w/v) dodecanoate/0.5% (w/v) |
TBA+ (C10![[thin space (1/6-em)]](https://www.rsc.org/images/entities/char_2009.gif) : :![[thin space (1/6-em)]](https://www.rsc.org/images/entities/char_2009.gif) TBA+; 2 TBA+; 2![[thin space (1/6-em)]](https://www.rsc.org/images/entities/char_2009.gif) : :![[thin space (1/6-em)]](https://www.rsc.org/images/entities/char_2009.gif) 1) 1) |
LC-UV | Phase volume: 30 μL | 36 |
| Recovery: 79–105% | ||||||
| LODs: 0.1–0.3 μg L−1 | ||||||
| 7 phenols | Water (10 mL) | 25 mmol L−1 SDS | −75 mmol L−1 TBABr | HPLC-UV | Phase volume: 100 μL | This work |
−15% (w/v) of AlCl3 (SDS![[thin space (1/6-em)]](https://www.rsc.org/images/entities/char_2009.gif) : :![[thin space (1/6-em)]](https://www.rsc.org/images/entities/char_2009.gif) TBABr; 1 TBABr; 1![[thin space (1/6-em)]](https://www.rsc.org/images/entities/char_2009.gif) : :![[thin space (1/6-em)]](https://www.rsc.org/images/entities/char_2009.gif) 3) 3) |
Recovery: 82–105% | |||||
| LODs: 1–4 μg L−1 |
Conclusions
A new SUPRAS based microextraction coupled to HPLC was successfully developed to determine seven phenols in water samples. The proposed SUPRAS supported green sample preparation by using surfactant (nontoxic agent) as extractant and the extraction procedure was obtained at ambient temperature in a short extraction time. The extraction was carried out simultaneously with the formation of SUPRAS by mixing SDS and TBABr at a 1![[thin space (1/6-em)]](https://www.rsc.org/images/entities/char_2009.gif) :
:![[thin space (1/6-em)]](https://www.rsc.org/images/entities/char_2009.gif) 3 molar ratio. The addition of AlCl3 provided liquid–liquid separation and the complete phase separation was obtained by centrifugation. The SUPRAS (upper phase) was collected and injected directly to HPLC analysis. Reversed phase HPLC was succeeded using a Symmetry C8 column with isocratic elution (40
3 molar ratio. The addition of AlCl3 provided liquid–liquid separation and the complete phase separation was obtained by centrifugation. The SUPRAS (upper phase) was collected and injected directly to HPLC analysis. Reversed phase HPLC was succeeded using a Symmetry C8 column with isocratic elution (40![[thin space (1/6-em)]](https://www.rsc.org/images/entities/char_2009.gif) :
:![[thin space (1/6-em)]](https://www.rsc.org/images/entities/char_2009.gif) 60; ACN: 0.1% acetic acid) which seven phenols studied were separated within 14 min. The presented method provided high EF (25–42), low LODs (1–4 μg L−1), high precision and was successfully applied for the determination of phenol residues in water samples. Overall, the proposed SUPRAS based microextraction is an attractive and can be used as an alternative methodology for extraction and off-line preconcentration.
60; ACN: 0.1% acetic acid) which seven phenols studied were separated within 14 min. The presented method provided high EF (25–42), low LODs (1–4 μg L−1), high precision and was successfully applied for the determination of phenol residues in water samples. Overall, the proposed SUPRAS based microextraction is an attractive and can be used as an alternative methodology for extraction and off-line preconcentration.
Conflicts of interest
There are no conflicts to declare.Acknowledgements
This work was supported by the Post-doctoral Program from Research Affairs and Graduate School, Khon Kaen University (58335).References
- Y. Fan, Y. Li, X. Dong, G. Hu, S. Hua, J. Miao and D. Zhou, Ind. Eng. Chem. Res., 2014, 53, 20024 CrossRef CAS.
- P.-P. Zhang, Z.-G. Shi and Y.-Q. Feng, Talanta, 2011, 85, 2581 CrossRef CAS PubMed.
- Environmental Protection Agency, 1984, EPA method 604, Washington, DC, 1984, p. 58 Search PubMed.
- Q.-L. Li, F. Huang, X.-L. Wang, X. Wang and R.-S. Zhao, Microchim. Acta, 2017, 184, 1817 CrossRef CAS.
- S.-X. Gong, X. Wang, Y. Chen, C.-G. Cheng, M.-L. Wang and R.-S. Zhao, J. Chromatogr. A, 2015, 1401, 17 CrossRef CAS PubMed.
- S. Armenta and M. de la Guardia, Trends Anal. Chem., 2016, 80, 517 CrossRef CAS.
- J. Beltran, F. J. Lopez and F. Hernandez, J. Chromatogr. A, 2010, 885, 389 CrossRef.
- H. Piri-Moghadam, F. Ahmadi and J. Pawliszyn, Trends Anal. Chem., 2016, 85, 133 CrossRef CAS.
- S. Dadfarnia and A. M. Haji Shabani, Anal. Chim. Acta, 2010, 658, 107 CrossRef CAS PubMed.
- M. Rezaee, Y. Assadi, M. R. M. Hosseini, E. Aghaee, F. Ahmadi and S. Berijani, J. Chromatogr. A, 2006, 1116, 1 CrossRef CAS PubMed.
- M. Rezaee, Y. Yamini and M. Faraji, J. Chromatogr. A, 2010, 1217, 2342 CrossRef CAS PubMed.
- L. Xu, C. Basheer and H. K. Lee, J. Chromatogr. A, 2007, 1152, 184 CrossRef CAS PubMed.
- P. Sun and D. W. Armstrong, Anal. Chim. Acta, 2010, 661, 1 CrossRef CAS PubMed.
- Q. Zhou, H. Bai, G. Xie and J. Xiao, J. Chromatogr. A, 2008, 1188, 148 CrossRef CAS PubMed.
- W. H. Hauthal, Chemosphere, 2001, 43, 123 CrossRef CAS PubMed.
- M. H. Naeeni, Y. Yamini and M. Rezaee, J. Supercrit. Fluids, 2011, 57, 219 CrossRef CAS.
- M. Rezaee, Y. Yamini, M. Moradi, A. Saleh, M. Faraji and M. H. Naeeni, J. Supercrit. Fluids, 2010, 55, 161 CrossRef CAS.
- F. J. Ruiz, S. Rubio and D. Perez-Bendito, Anal. Chem., 2006, 78, 7229 CrossRef CAS PubMed.
- A. Ballesteros-Gomez, M. D. Sicalia and S. Rubio, Anal. Chim. Acta, 2010, 677, 108 CrossRef CAS PubMed.
- A. Moral, M. D. Sicilia and S. Rubio, J. Chromatogr. A, 2009, 1216, 3740 CrossRef CAS PubMed.
- P. Samaddar and K. Sen, J. Ind. Eng. Chem., 2014, 20, 1209 CrossRef CAS.
- A. Melnyk, L. Wolska and J. Namiesnik, J. Chromatogr. A, 2014, 1339, 1 CrossRef CAS PubMed.
- W. P. N. Silva, A. E. G. do Nascimento, M. C. P. de Alencar Moura, H. N. M. de Oliveira and E. L. de Barros Neto, Sep. Purif. Technol., 2015, 152, 133 CrossRef CAS.
- G. Jia, L. Li, J. Qiu, X. Wang, W. Zhu, Y. Sun and Z. Zhou, Spectrochim. Acta, Part A, 2007, 67, 460 CrossRef PubMed.
- A. Santalad, S. Srijaranai, R. Burakham, T. Sakai and R. L. Deming, Microchem. J., 2008, 90, 50 CrossRef CAS.
- C. Kukusamude, J. P. Quirino and S. Srijaranai, J. Chromatogr. A, 2016, 1472, 10 CrossRef CAS PubMed.
- P. Soisungnoen, R. Burakham and S. Srijaranai, Talanta, 2012, 98, 62 CrossRef CAS PubMed.
- D. Mitra, I. Chakraborty, S. C. Bhattacharya and S. P. Moulik, Langmuir, 2007, 23, 3049 CrossRef CAS PubMed.
- J. Mata, D. Varade, G. Ghosh and P. Bahabur, Colloids Surf., A, 2004, 245, 69 CrossRef CAS.
- S. Kumar, D. Sharma and K. Din, Langmuir, 2000, 16, 6821 CrossRef CAS.
- R. Carabias-Martınez, E. Rodrigudz-Gonzalo, B. Moreno-Cordero, J. L. Pérez-Pavón, C. García-Pinto and E. Fernández Laespada, J. Chromatogr. A, 2000, 902, 251 CrossRef.
- M. Wang and Y. Wang, Soft Matter, 2014, 10, 7909 RSC.
- L. C. Seronero, M. E. Fernandez-Laespada, J. L. Pavon and B. Moreno Cordero, J. Chromatogr. A, 2000, 897, 171 CrossRef CAS PubMed.
- C. Mahugo, Z. Sosa and J. J. Santana, Analyst, 2002, 127, 1031 RSC.
- X. Jin, M. Zhu and E. D. Conte, Anal. Chem., 1999, 71, 514 CrossRef CAS.
- F. J. Lopez-Jimenez, S. Rubio and D. Perez-Bendito, J. Chromatogr. A, 2008, 1195, 25 CrossRef CAS PubMed.
| This journal is © The Royal Society of Chemistry 2017 |


