 Open Access Article
Creative Commons Attribution 3.0 Unported Licence
Plasma-assisted and thermal atomic layer deposition of electrochemically active Li2CO3†
N. Hornsveld a,
B. Putab,
W. M. M. Kesselsa,
P. M. Vereeckenbc and
M. Creatorea
aDepartment of Applied Physics, Eindhoven University of Technology, 5600 MB Eindhoven, The Netherlands. E-mail: n.hornsveld@tue.nl; m.creatore@tue.nl
bImec, Kapeldreef 75, Leuven 3001, Belgium
cDepartment of Microbial and Molecular Systems, KU Leuven, 3001 Leuven, Belgium
First published on 24th August 2017
Abstract
Thin-film lithium carbonate (Li2CO3) has applications in various electrochemical devices, like Li-ion batteries, gas sensors and fuel cells. ALD of Li2CO3 is of interest for these applications as it allows for uniform and conformal coating of high-aspect ratio structures and particles with very precise thickness control. However, there are few studies that focus on its fabrication and characterization. In this work, plasma-assisted and thermal ALD were adopted to grow ultra-thin, conformal Li2CO3 films between 50 and 300 °C using lithium tert-butoxide as a precursor and O2 plasma or H2O/CO2 as co-reactants. More specifically, we focus on the plasma-assisted process by film growth, stability and conductivity studies and emphasize the differences from its more extensively adopted thermal counterpart. Plasma-assisted ALD allows for higher growth per cycle values (0.82 vs. 0.60 Å), lower substrate temperatures and shorter cycle times. The stoichiometry of the films, ranging from Li2CO3 to Li2O, can be controlled by substrate temperature and O2 plasma exposure time. The ionic conductivity for both plasma-assisted and thermal ALD is measured for the first time and is in the order of 10−10 S cm−1 after normalizing to the different effective surface areas. The Li-ion conductivities found here are in line with literature values predicted by simulation studies.
Introduction
Lithium carbonate is considered a potential electrode passivating film in Li-ion batteries1 and electrolyte material or sensing layer in electrochemical devices like fuel cells or chemical sensors.2,3 This is attributed to its purely ionically conductive behavior and good electrochemical stability.4 In addition, it is widely used as building block for the fabrication of electrodes and electrolytes or as an additive to improve electrode performance.5 Despite its widespread usage, there are only few studies in the literature focusing on its characterization.With the trend of manufacturing devices that have smaller size, weight and lower power consumption, thin film fabrication techniques are becoming preferable. This is especially applicable in the field of Li-ion batteries, where thin-film 3D battery architectures are currently being investigated.6 Nanostructured energy storage systems have demonstrated a substantial increase in power and energy density.6–8 Key to nanostructured energy storage systems is thin films processing of battery active and passive materials compatible with complex battery design. Conventional deposition techniques, such as physical vapor deposition (PVD) and plasma-enhanced chemical vapor deposition (PE-CVD), do not generally lead to conformal thin layers on high aspect ratio structures. To enable fast charging thin-film batteries, conformality and uniform material composition in extreme aspect ratios are required.9 Therefore, novel deposition techniques leading to enhanced control in thin film properties and conformality are being presently introduced in the field of Li-ion batteries.10–12 Atomic layer deposition (ALD), which is based on sequential and self-limiting half-reactions between precursors (co-reactants) and surface, has emerged as a powerful tool since it shows potential towards exceptional conformality on high-aspect ratio structures, thickness control at sub-nanometer level, and tunable film properties.13 Promising applications of ALD for Li-ion batteries include (surface modification of) particle-based electrodes, 3D-structured electrodes, and 3D all-solid-state microbatteries.10–12,14,15 Due to the excellent conformality and thickness control of ALD, is suggested that ALD of lithium carbonate (Li2CO3) is especially beneficial when it is employed as electrode passivating film or as additive to improve electrode performance.
In the present work we focus on the ALD characterization of Li2CO3. More specifically, we focus on the plasma-assisted ALD process of Li2CO3 by (in situ) growth studies and emphasize the differences from its more extensively adopted thermal counterpart. This is expected to be generally helpful to assess the opportunities of ALD for Li-ion materials. With plasma-assisted ALD a high reactivity is delivered to the deposition surface by the plasma species and therefore less thermal budget is required at the substrate to drive the ALD surface chemistry than for thermal ALD. The application of plasmas in combination with ALD generally leads to a wider range in substrate temperature and processing conditions and thus enables a larger variety of material properties.21 The process details of ALD Li2CO3 as collected from literature are shown in Table 1. Although the plasma-assisted ALD process for Li2CO3 has been already reported in literature, the understanding of the ALD film growth (primarily in terms of developed chemistry during and after deposition) is so far insufficient. In addition, the effect of the process parameters on the layer properties was not reported. To the best of our knowledge we provide the first proper conductivity measurement of thin film Li2CO3.
Moreover, Li2CO3 ALD represents an attractive model process for incorporating Li into multicomponent (ternary) ALD materials, since it is a highly stable compound with respect to process stability and ease of postdeposition analysis of the films. Li2O and LiOH often develop simultaneously during processing due to the reversible reaction with H2O and CO2 and are being deposited by ALD as well.16–20,22,23 These materials are also widely used as building block for the fabrication of various other Li-ion battery active materials.24–26
Experimental
All depositions presented in this work were carried out using the thermal and remote plasma ALD reactor FlexAL (Oxford Instruments). The reactor consists of a rotary and turbo molecular pump such that it can reach a base pressure of <10−6 Torr by overnight pumping. The pump unit as well as the inductively coupled plasma (ICP) source are connected to the deposition chamber trough gate valves.The ALD processes developed in this work are shown in Fig. 1. For thermal ALD (Fig. 1a), the cycle consists of the exposure of the substrate to LiOtBu (97%, Sigma Aldrich) lithium precursor, H2O gas and CO2 gas respectively, alternated by argon purges. The plasma-assisted ALD process (Fig. 1b) consists of a combination of the substrate exposure to the same lithium precursor and to an O2-fed plasma with a plasma power of 100 W, alternated by argon purging steps. To ensure the gas flow and pressure have stabilized, the reactor was filled with oxygen prior to switching on the plasma source. Air exposure of the fabricated layers was minimized by transporting the samples in an evacuated transport tube.
The LiOtBu precursor was bubbled from the precursor pod with Ar at a reactor pressure of 20 mTorr and the precursor and precursor supply line were heated to 140 °C and 150 °C respectively to avoid precursor condensation. The reactor pressure during the O2 plasma generation was 13 mTorr. The process table was heated to 50–300 °C, since it is reported that precursor decomposition takes place from 350 °C.27 The wafers were placed on an aluminum substrate holder. The reactor wall is maintained at a temperature of 120 °C (which is the maximum wall temperature), except for the deposition at 50 or 100 °C, where the reactor wall is kept at 50 or 100 °C, respectively.
As substrate, 60 nm titanium nitride (TiN) sputtered on silicon was used (Endura PVD). TiN is a barrier for Li-ion diffusion, and also functions as current collector for electrochemical testing of the layers. The film thickness and dielectric function were monitored in situ by spectroscopic ellipsometry (SE) with a J.A. Woollam, Inc. M2000U (0.75–5.0 eV) tool. The dielectric function of Li2CO3 was parameterized using a mathematical description in the form of B-splines, since this method requires no prior knowledge about the dielectric function of the deposited films. Thickness values were confirmed by high resolution SEM (Zeiss Sigma) operated at 2 kV acceleration voltage.
The entire chemical composition of the samples has been characterized with ion beam analysis methods by Detect99. The hydrogen profiles were determined by Elastic Recoil Detection (ERD) using a 1.9 MeV He+ beam impinging on the sample under 15° glancing incidence, and 30° recoil angle. All other elements could be determined in a single run by Elastic Backscattering Spectrometry (EBS) with 2.8 MeV protons at perpendicular incidence. This technique is similar to Rutherford Backscattering Spectrometry (RBS) but has the advantage that the cross sections for light elements is enhanced by the use of high energy protons as projectiles instead of He. Spectra have been registered at 170° and 150° scattering angle. EBS was in this case necessary for the determination of the Li and C contents, for which the sensitivity of RBS is rather poor. Finally, the O, N and Ti contents have been confirmed by channeling RBS using 1900 keV He ions in the same configuration as for the EBS measurements.
X-ray photoelectron spectroscopy (XPS) spectra were recorded by a Thermo Scientific K-alpha+ system using monochromatic Al Kα X-rays. The spot size of the beam was 400 μm and the base pressure of the system was 10−8 mbar. The depth profile was obtained by an Ar ion gun of 500 eV during 5 s for each sputter step. The crystal structure of the Li2CO3 layers was determined using a Philips X'Pert MPD diffractometer equipped with a Cu Kα source (1.54 Å radiation). The morphology of the deposited layers was investigated by the SEM which was described before.
For electrochemical impedance spectroscopy (EIS) testing an Autolab (Metrohm) potentiostat with a frequency-response analyzer module (frequency range from 0.01 Hz to 1 MHz) was used, operated by Nova software (Metrohm Autolab). A three-electrode Teflon cell was clamped on top of the sample using a Kalrez O-ring. A Luggin capillary was used to connect the cell with the reference-electrode compartment. One molar LiClO4 (battery-grade, Sigma-Aldrich) in propylene carbonate was used as the electrolyte. The experiments were carried out in an Ar glovebox (O2, H2O < 1 ppm). Impedance spectroscopy results were analyzed by fitting an equivalent circuit to the data, using MEISP software (Kumho Chemical Laboratories). The obtained fits had a χ2 value in the range from 10−3 to 10−5. The relative standard deviation for all fitted values remained below 5%.
Results and discussion
ALD process characterization
A deposition temperature of 150 °C was adopted to investigate the saturation behavior of the surface reactions during the sub-cycles of both thermal and plasma ALD Li2CO3. Film thickness was monitored every 10 cycles by in situ SE measurements while changing precursor or co-reactant dose times. Saturation curves for the thermal ALD process of Li2CO3 are shown in Fig. 2a. A LiOtBu dose of 6 s, a water dose of 50 ms and a CO2 dose of 2 s were chosen as standard conditions for thermal ALD of Li2CO3. Without H2O dosing no film growth occurred and without CO2, LiOH was formed. Due to a slower response speed of the CO2 valve, dosing of 0.5 s or less did not deliver any CO2 in the chamber (no pressure increase was observed). Purge steps after LiOtBu and CO2 dose of 2 s are sufficient to remove the reaction products and unreacted species from the processing chamber, although 5 s purge was necessary for H2O. A growth per cycle of 0.60 Å was found for the thermal ALD process.The saturation behavior of the surface reactions during the two half cycles of the plasma-assisted ALD process, i.e. the exposure to the lithium precursor and O2 plasma, is shown in Fig. 2b: self-limiting growth was verified for both the precursor and the plasma step. For both half-cycles purge steps of 2 s are sufficient to remove the reaction products and unreacted species. A growth per cycle of 0.82 Å was obtained for a deposition temperature of 150 °C.
The previously reported growth per cycle of 0.8 Å for thermal ALD of Li2CO3,16 differs from our values. The reason for this difference is unclear, yet it is noted that the main difference with our process is a higher reactor pressure. Plasma-assisted ALD using LiOtBu on the other hand was reported to have a growth per cycle of 0.4 Å,19 but the obtained stoichiometry was a mixture of Li2CO3 and Li2O. Our films grown at 150 °C are found to be pure Li2CO3, as shown in the next section. Moreover, no saturation curves were shown in literature to support the data for this particular case. In general, plasma processes often have a higher growth per cycle when compared to thermal processes which is in agreement with our results.21
Next, the process window of ALD films was extended to deposition temperatures between 50 and 300 °C. Fig. 3a shows the thickness evolution as a function of the number of ALD cycles for various deposition temperatures. For plasma-assisted ALD and Tsub ≤ 200 °C, the thickness of the films develops linearly with the number of cycles. For temperatures higher than 250 °C, the film thickness develops according to two slopes, which correlates with a transition in film chemical composition, as discussed in the next section. Due to high temperature sensitivity of the reactions and minor temperature fluctuations of the process table, the trends of the thickness as a function of the number of cycles at 250 °C varied from occasion to occasion: in some cases they tend to be similar to the growth behavior for T ≤ 200 °C and in other instances to T > 250 °C. Moreover, films deposited at 250 °C showed large height differences (see SEM images in the next section), which complicated the extraction of the film thickness. For the thermal process, no transition in film chemical composition was observed. However, the growth per cycle increases slightly as function of the number of ALD cycles, which can be explained by crystallization of the films (in the ESI† more growth curves are shown for thermal ALD Li2CO3).
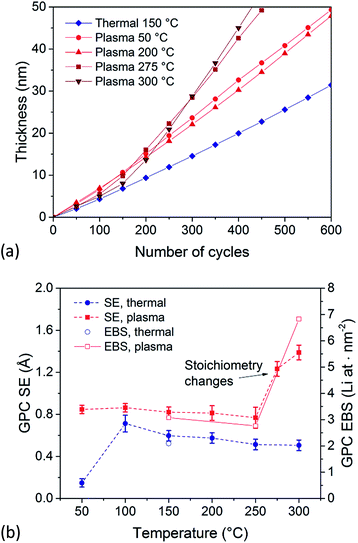 | ||
| Fig. 3 (a) In situ thickness measurements by SE for plasma-assisted ALD of Li2CO3 at 50, 200, 275 and 300 °C and thermal ALD of Li2CO3 at 150 °C. The film growth between 50 and 200 °C with plasma ALD was very similar (see ESI†). (b) Growth per cycle as a function of process table temperature for both plasma-assisted (squares) and thermal (circles) ALD processes. | ||
In Fig. 3b, both the temperature dependency of the growth per cycle for the plasma-assisted, as well as the thermal ALD process is shown. It can be noticed that the growth per cycle of the thermal ALD process strongly decreases at 50 °C, indicating the lower limit of the temperature window. The ALD process window for the plasma-assisted process is extended towards lower temperatures, as it has a similar growth per cycle at 50 °C as at higher temperatures. The overall growth per cycle is higher for the plasma-assisted process as compared to the thermal process. As mentioned before, this is more often observed for plasma processes due to the relatively high reactivity of the plasma species which could create a higher density of reactive surface sites.21 The differences in growth per cycle between thermal and plasma ALD, but also between different deposition temperatures for plasma-assisted ALD are confirmed by EBS data (see Fig. 3b). A slight decrease in growth per cycle with increasing temperature was observed for the thermal ALD process. This decrease might be caused by desorption of part of the absorbed precursor monolayer from the surface, by higher purity film growth or by an increase in film crystallinity. The crystallinity of the films will be further discussed in the next paragraph.
To summarize, it is shown that both plasma-assisted and thermal ALD of Li2CO3 show typical ALD growth behavior within a wide temperature window. Plasma-assisted ALD allows for lower temperature depositions, which results in a wider choice of (substrate) materials that can be used. This is particularly useful when temperature-sensitive materials are adopted, such as polymers.21 In addition, the plasma-assisted process allows for higher growth per cycle values and shorter cycle times compared to thermal ALD, without compromising on the quality of the layer. This will enable higher throughputs for ALD reactors.
Chemical composition
The stoichiometry of 50 nm thick films was probed using a combination of ERD and EBS. The atomic percentage of all the elements in the film is reported in Table 2. For thermal and plasma-assisted ALD films grown up to 250 °C, the results point out a stoichiometry very similar to Li2CO3. The films are slightly sub-stoichiometric, since the carbon content in the films is relatively low (stoichiometric Li2CO3 contains 33.3 at% Li, 16.7 at% C and 50.0 at% O). Furthermore, the calculated mass density for these samples is slightly lower than the bulk density of 2.11 g cm−3. Only a few at% of H is found in the films.| Sample | GPC (at. per nm2) | [Li] (at%) | [C] (at%) | [O] (at%) | [H] (at%) | Mass density (g cm−3) |
|---|---|---|---|---|---|---|
| Thermal 150 °C | 2.09 ± 0.1 | 33.4 ± 1.7 | 14.6 ± 0.8 | 50.7 ± 2.0 | 1.3 ± 0.2 | 1.95 ± 0.20 |
| Plasma 150 °C | 3.08 | 32.7 | 15.1 | 49.6 | 2.6 | 2.06 |
| Plasma 250 °C | 2.76 | 30.5 | 15.8 | 50.9 | 2.8 | 1.97 |
| Plasma 300 °C | 6.83 | 30.9 | 13.3 | 44.7 | 11.1 | n.a. |
Plasma ALD at 300 °C on the other hand shows a high hydrogen content, suggesting the co-presence of LiOH. As mentioned before, air exposure of the fabricated layers was minimized by transporting the samples in an evacuated transport tube, although some degradation of the layers cannot be excluded. The hydrogen content is not constant through the film thickness, but is mainly present in the film's depth indicating air reactivity after deposition (a depth profile shown in the ESI†). The relatively high carbon content suggests that the film reacted from LiOH towards Li2CO3 upon air exposure. The reactivity of plasma ALD films deposited at 300 °C will be discussed in more detail later in this paragraph.
For all samples, the amount of deposited lithium atoms scales with the growth per cycle obtained by SE (see Fig. 3b). Assuming the mass density of stoichiometric Li2CO3 to be equal to the bulk density of 2.11 g cm−3, one monolayer of lithium carbonate contains roughly 10.58 Li atoms per nm2.‡ Based on the EBS growth per cycle of 2.09 Li atom per nm2 for the thermal ALD process, in each cycle approximately 1/5th of a monolayer of Li2CO3 is deposited. For the plasma-assisted process, about 1/4th to 1/3rd of a monolayer is deposited every cycle.
For plasma ALD at 300 °C, the amount of deposited Li atoms deviates strongly from the lower temperature processes. At the same time the SE growth per cycle for this sample, but also for the one prepared at 275 °C, deviates from the lower temperature depositions. The films deposited at higher temperatures changed when they were removed from the reactor as could be observed visually. Furthermore, the ellipsometric data obtained ex situ could not be fitted using the same model as during in situ measurements. The instability, deviating growth per cycle and increased hydrogen content of these layers suggests that the formed layers were not Li2CO3 but rather a mixture of LiOH and Li2O. The increased growth per cycle can be explained by the fact that LiOH is hygroscopic and easily absorbs H2O and forms a hydrate.16,23,28 It is reported for thermal ALD of LiOH at 225 °C that long purge times of 2 hours lead to a stable mass measured by QCM as a result of H2O desorption.16
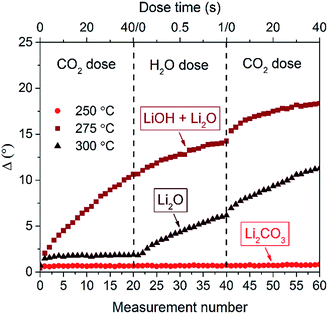
To further investigate the film instability for growth temperatures above 250 °C, 50 nm thick films were fabricated at different deposition temperatures. These were then subsequently exposed to CO2 and H2O pulses inside the ALD reactor. The films were measured by in situ SE and the phase change (Δ) was monitored at 589 nm after every pulse as shown in Fig. 4. For plasma depositions at 250 °C, Δ was unaffected by CO2 and H2O exposure, pointing out the stability of the film. However, the film deposited at a slightly higher temperature of 275 °C strongly reacted with CO2, whereas for the film deposited at 300 °C Δ only slightly changes during the first pulse. Both LiOH and Li2O could react with CO2 to form Li2CO3. However, it is reported in literature that the reaction between Li2O and CO2 for temperatures from 200 to 400 °C only occurs in the top few nanometers of the Li2O and then a self-limiting shell of Li2CO3 develops.29 This in contrast to LiOH, which would be extremely reactive towards CO2. Hence, the film at 300 °C most likely consists of Li2O as after the first CO2 pulse Δ only slightly changes suggesting that only a surface reaction is occurring. During subsequent exposure steps, the layer does not further react with CO2, implying the absence of LiOH. After the CO2 pulses, the sample was subjected to H2O pulses. As observed in Fig. 4, the 300 °C film consisting of Li2O is reacting with the H2O forming LiOH. Next, CO2 is pulsed again, and the layer is again reacting to form Li2CO3. Unlike the film deposited at 300 °C, the as-deposited 275 °C film was very reactive towards the first CO2 pulses and therefore (partly) consisted of LiOH. For all other films, which include plasma ALD films deposited at 50–250 °C and thermal ALD films deposited at 50–300 °C, the change in Δ was negligibly small, indicating that almost no reaction with H2O or CO2 occurred. These stable Li2CO3 films were used for ex situ XPS analysis which will be discussed later in this section.
The in situ SE measurements presented in Fig. 4 show the formation of LiOH/Li2O for plasma-assisted ALD at processing temperatures > 250 °C. For these temperatures it was also shown that the film thickness versus number of ALD cycles develops differently. In the first 100 cycles the film growth was significantly different from the rest of the deposition which is correlated with the transition in film chemical composition. Since the use of plasma at processing temperatures > 250 °C has a significant effect on the film growth and composition, also the effect of the plasma duration was investigated. Up to this point, a plasma exposure of 3 s was adopted. Fig. 5 shows the thickness evolution with number of ALD cycles for various plasma exposure times. As observed from the graph, the bulk growth per cycle for different plasma exposure times is similar. However, for longer plasma exposure times, the growth per cycle requires a lower number of ALD cycles to become linear, compared to shorter plasma exposure times. The formation of LiOH/Li2O can thus be further stimulated by prolonging the plasma exposure time.
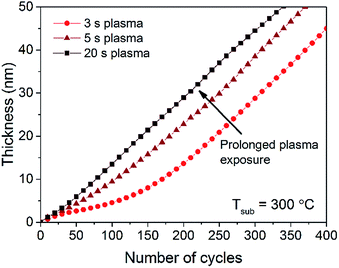 | ||
| Fig. 5 In situ SE thickness measurement for plasma-assisted ALD of Li2CO3 at 300 °C using different O2 plasma exposure times. | ||
The chemical composition of the deposited films was further studied by ex situ XPS. No sputtering procedure was adopted, as it was found that the stoichiometry of the films changed due to interaction with Ar ions. Upon chemical decomposition during sputtering, Li2CO3 experiences a transition to Li2O (ESI†). In Fig. 6, the XPS core level spectra of C 1s, Li 1s and O 1s are shown for thermal ALD at 150 °C. The binding energy scale was calibrated by using the hydrocarbon contamination C 1s peak at 285.0 eV. As expected, the C 1s spectrum shows a main peak at ∼290.1 eV assigned to the carbonate environment in Li2CO3. The other peaks fitted with a red line are associated with adventitious carbon on the sample surface. In the Li 1s spectrum a peak at ∼55.4 eV is observed which is associated to Li2CO3. The O 1s spectrum consists of a peak with a maximum at ∼531.8 eV. The shape of the peak is slightly asymmetric. To visualize the asymmetry a second peak is fitted to the data. The asymmetry can be explained by the crystallographic structure of Li2CO3 in which two oxygen atoms have an identical environment, but the third oxygen has a different environment of surrounding atoms.30 The obtained stoichiometry for this film was: 33.0 at% lithium, 17.7 at% carbon and 49.3 at% oxygen, corresponding to stoichiometric Li2CO3. Proportionate, there is slightly more carbon than obtained by EBS. To some extent, the difference can be explained by the low penetration depth of XPS (∼10 nm) and the presence of carbon on the sample surface. All other films (prepared by plasma as well as thermal ALD) are measured and subsequently fitted using the same method and all showed the expected Li2CO3 stoichiometry. The results are summarized in the ESI.†
Li2CO3 films which are only slightly sub-stoichiometric can thus be deposited by thermal as well as by plasma-assisted ALD. In addition, it is possible to deposited Li2O at temperatures > 250 °C using the plasma-assisted process. It has already been shown in literature that this is also possible using thermal ALD for temperatures > 250 °C, when the CO2 step was omitted from the process.19 Deposition of Li2O can be beneficial when presence of carbon in the films is undesirable. On the other hand, with thermal ALD it is possible to deposit Li2CO3 films also at high temperatures of 300 °C. If high temperature Li2CO3 depositions are preferred, for example when the process is combined in super-cycles (to make more complex material structures) employing also precursors or co-reactants which require higher deposition temperatures, the thermal process could be preferred.
Crystallinity and morphology
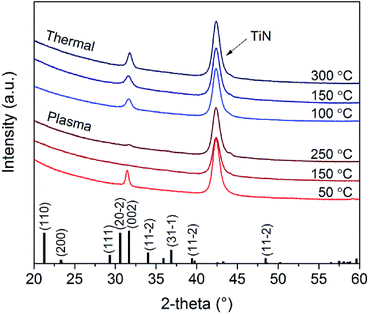
XRD was used to determine the crystallinity of the films deposited at different temperatures. Fig. 7 shows the X-ray diffractograms for ∼50 nm thick films. Both plasma and thermal ALD films show a typical diffraction peak originating from crystalline Li2CO3. The gonio measurements, which detect periodicity of planes parallel to the surface, show only the peak at 31.7°, meaning the process yields a preferential crystal growth orientation in the <002> direction. For thermal ALD films, the crystallinity increases slightly with increasing deposition temperature. A similar trend was observed in literature for thermal ALD of Li2CO3 on Si (100) substrates using a LiN(SiMe3)2 precursor,17 although the crystalline growth started only at ∼180 °C according to their XRD spectra. The onset for crystalline growth could thus be influenced by the precursor, the substrate or a combination of both.When considering the plasma ALD Li2CO3 films, the layer deposited at 50 °C is highly crystalline and oriented in the <002> direction, similar to the thermal process. At higher deposition temperatures, the spectra change significantly and the crystallinity seems to be suppressed. Since the samples are measured by gonio XRD, we cannot exclude that there is a crystalline component present in the films because this technique is less sensitive to 50 nm thick films. In Fig. 8, SEM images of the surfaces and cross-sections are shown corresponding to the samples measured by XRD. The film growth, and resulting topography, change drastically when increasing temperature. Although for lower deposition temperatures highly uniform films are formed, at 250 °C, the films show large thickness variations. We expect that this is related to the combustion of organic ligands and the formation of LiOH/Li2O during deposition induced by the O2 plasma.
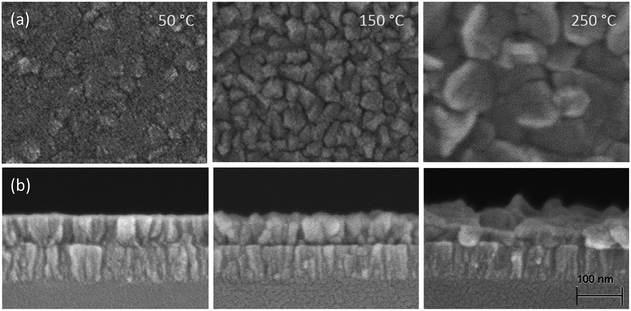 | ||
| Fig. 8 (a) High resolution SEM pictures showing the surface topography and (b) cross-section of Li2CO3 deposited with plasma ALD at 50, 150, and 250 °C. The scale bar applies to all of the pictures. | ||
Conformality
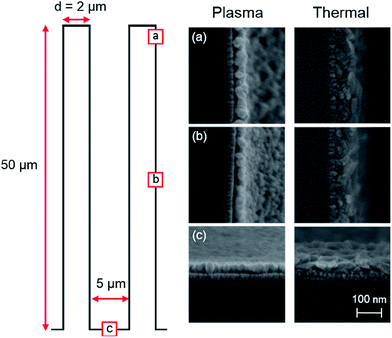
The conformality of the deposition was studied using SEM at different positions on high aspect ratio Si pillars. The pillars, which are 50 μm high and have a diameter of 2 μm, are coated with a ∼30 nm TiN current collector using ALD. On top of the TiN a ∼50 nm Li2CO3 layer was deposited using a table temperature of 150 °C. Fig. 9 shows 3 SEM pictures taken at different heights along the pillar for plasma-assisted as well as thermal ALD. Image (a) is taken at the top of the pillars and shows a Li2CO3 layer of ∼55 nm for the plasma-assisted deposition. Image (b) is taken half way the pillar and depicts a ∼45 nm Li2CO3 layer (82% of thickness at top). At the bottom (c), the plasma-assisted Li2CO3 is ∼40 nm thick (73%). For thermal ALD on the other hand thicknesses of ∼60, 52 (87%) and 48 nm (80%) are measured along the pillars. We can conclude that the conformality on high aspect ratio pillars is rather good. Note that only the lithium exposure time was varied. Elongation of the lithium dosing time drastically improves the conformality of thermal ALD. For example, when thermal ALD was adopted using 6 s lithium dosing instead of 10 s, the Li2CO3 layer at the bottom is 20 nm instead of 48 nm. For plasma ALD the conformality remains similar when varying the lithium dosing time. It is expected that the conformality can still be improved by further optimization of the precursor and plasma exposure steps.Electrochemical analysis
The Li-ion conductivity of plasma and thermal ALD Li2CO3 layers was investigated using impedance spectroscopy. The measurements were performed at open circuit potential (OCP) on 50 nm Li2CO3 films deposited at 150 °C on a TiN current collector. The results are shown in Fig. 10a on a complex plane plot. Both the measured layers show a behavior characteristic of a solid electrolyte: an intercept with the x-axis at high frequency, a semi-circle at medium frequency and a 45° inclined response at low frequency. Such behavior is typically associated with the ionic conductivity through a solid material.31 The high frequency intercept with the x-axis is generally attributed to the resistance of the cables, contacts and liquid electrolyte, the semi-circle originates from the ionic conductivity through the solid material and its capacitive response. The 45° slope is typically associated with a Warburg-like response, here the Li-ion diffusion through the liquid electrolyte. Note that in the measurements performed here electronic leakage through the Li2CO3 films is not probed.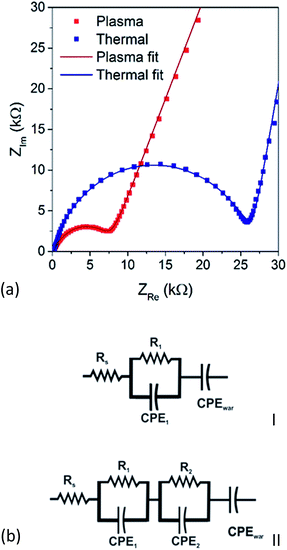 | ||
| Fig. 10 (a) Impedance spectroscopy of 50 nm Li2CO3 films prepared by thermal (blue) and plasma-assisted (red) ALD at 150 °C and (b) equivalent circuit models used to fit the data. | ||
Further analysis was performed by fitting an equivalent circuit to the measured impedance response (shown in Fig. 10a). The response of the Li2CO3 layer deposited by thermal ALD could be adequately fitted using model I shown in Fig. 10b which is confirmed by the low χ2 value of 5 × 10⁻⁴. When equivalent circuit model II was tried to fit the response of the plasma deposited Li2CO3 layer, no adequate fit could be obtained. For this reason, model II was used, resulting in the fit shown in Fig. 10a. The quality of the fit was again confirmed by the low χ2 value of 2 × 10⁻⁴.
From the complex non-linear square fitting of the models to the impedance data, different component values are extracted. The Rs was found to be around 150 Ω for both thermal and plasma samples. This value corresponds to the resistance of the cables and the electrochemical cell. The other relevant parameters are summarized in Table 3. For the thermal sample a resistance (R1) value of 25 kΩ is extracted, corresponding to a Li-ion conductivity of 4 × 10⁻¹⁰ S cm−1, well in accordance values predicted by simulation studies.32 From the constant phase element (CPE1), a capacitance value can be extracted according to the following formula:33,34
| C = Q1/nR1(1−n)/n |
| Sample | R1 (kΩ) | C1 (F) | R2 (kΩ) | C2 (F) | χ2 |
|---|---|---|---|---|---|
| Thermal | 25 | 2 × 10⁻⁷ | — | — | 5 × 10⁻⁴ |
| Plasma | 2.5 | 4 × 10⁻⁷ | 3 | 8 × 10⁻⁷ | 2 × 10⁻⁴ |
Usage of this formula assumes a normal distribution of the time constants associated with the constant phase element. It allows an accurate determination of the capacitance value associated with the CPE even with an n value around 0.8.33,34 By using the above formalism, a capacitance value of 200 nF is extracted for CPE1, corresponding to a dielectric constant of ∼25. This value is higher than what is expected for typical oxide films. However, the large surface roughness of the thermal films must be considered (see ESI Fig. S4†). Such roughness increases the effective contact area of the capacitor which is not included when using the geometrical surface area. For this reason also the extracted ionic conductivity value will be slightly overestimated and can be adjusted for surface roughness down to a value of 10−10 S cm−1.
The impedance response of the plasma-assisted Li2CO3 sample was also probed. Fig. 10a shows that the plasma sample has a lower ionic resistance (as indicated from the intercept with the x-axis). This semi-circle consists of two overlapping semi-circles with slightly different time constants which is reflected in the model choice (model II). The capacitance values were again extracted by using the previously shown formula. The values found were 400 and 800 nF for respectively CPE1 and CPE2. These values correspond to dielectric constants of 40 and 80, so significantly higher than the one of the thermal sample and too high for typical oxide films.
Such capacity values can be attributed to a change in dielectric constant or different geometrical dimensions. However, no difference in mass density could be detected between the thermal and plasma Li2CO3 layers (see Table 2). Therefore, it is unlikely that a significant difference in dielectric constant exists between the two layers. When considering the morphology of the layers (see Fig. 8), a columnar structure can be seen. Therefore, the liquid electrolyte may contact the individual grains. Clearly this would lead to a significant increase in contact area and thus an increased capacitance value. The distribution in grain size can in such case lead to a distribution in time constants. The two resistance values extracted from the fitting, each correspond to a Li-ion conductivity value in the order of 1 × 10⁻⁹ S cm−1. However, the underestimation of the contact area introduces a significant uncertainty on this value which, based on the increased surface area, will be overestimated. When normalizing the conductivity value found here to the ratio of the different effective surface areas of the thermal and plasma samples, a conductivity value of 10−10 S cm−1 is obtained, a value again in line with other literature reports.32
Conclusions
A comparison has been made between the remote plasma ALD process and its more extensively adopted thermal counterpart. Self-limiting growth was obtained for both processes within a wide temperature window. This wide temperature window could especially useful when Li2CO3 is combined in super-cycles to obtain more complex material stoichiometries, since many other precursors or co-reactants have a limited temperature window. Especially the use of plasma allows for the possibility to deposit at lower process temperatures, which would be beneficial for temperature-sensitive substrates. Moreover, plasma-assisted ALD allows for shorter deposition times and higher growth per cycle values leading to an increase in reactor throughput.Stoichiometric Li2CO3 films can be deposited with both ALD processes. In addition, it is possible to deposited Li2O at temperatures >250 °C through combustion of the organic ligands. This could be beneficial when presence of carbon in the films is undesirable. For thermal ALD it is necessary to also omit the CO2 step from the process to obtain Li2O. For plasma-assisted ALD, introduction of Li2O in the films is accompanied with suppression of film crystallinity and increases film non-uniformity. The formation of Li2O can be further promoted by prolonging the plasma exposure time.
Both plasma-assisted and thermal ALD of Li2CO3 allow for conformal coating of high aspect ratio substrates as can be important for future Li-ion batteries. To the best of our knowledge this paper provides the first proper conductivity measurement of Li2CO3 ALD films. An ion conductivity in the order of 10−10 S cm−1 was obtained for both plasma and thermal ALD after normalizing the fitted conductivity values to the ratio of the different effective surface areas. Studies are ongoing to characterize the electrochemical properties of the Li2CO3 films in more depth.
Conflicts of interest
There are no conflicts to declare.Acknowledgements
The authors gratefully acknowledge Dr Marcel Verheijen for fruitful discussion and Cristian van Helvoirt and Jeroen van Gerwen for technical assistance. This project is financially supported by the Dutch program “A green Deal in Energy Materials” ADEM Innovation Lab.References
- K. Chung, J.-D. Lee, E.-J. Kim, W.-S. Kim, J.-H. Cho and Y.-K. Choi, Microchem. J., 2003, 75, 71–77 CrossRef CAS.
- Y. C. Zhang, H. Tagawa, S. Asakura, J. Mizusakib and H. Narita, Solid State Ionics, 1997, 100, 275–281 CrossRef CAS.
- Y. Shimamoto, T. Okamoto, Y. Itagaki, H. Aono and Y. Sadaoka, Sens. Actuators, B, 2004, 99, 113–117 CrossRef CAS.
- J. Mizusaki and H. Tagawa, Solid State Ionics, 1992, 53–56, 791–797 CrossRef CAS.
- S. Bhattacharya, A. R. Riahi and A. T. Alpas, Carbon, 2014, 77, 99–112 CrossRef CAS.
- J. W. Long, B. Dunn, D. R. Rolison and H. S. White, Chem. Rev., 2004, 104, 4463–4492 CrossRef CAS PubMed.
- J. F. M. Oudenhoven, L. Baggetto and P. H. L. Notten, Adv. Energy Mater., 2011, 1, 10–33 CrossRef CAS.
- G. W. Rubloff, A. C. Kozen and S. B. Lee, J. Vac. Sci. Technol., A, 2013, 31, 58503 Search PubMed.
- P. M. Vereecken and C. Huyghebaert, ECS Trans., 2013, 58, 111–118 CrossRef.
- H. C. M. Knoops, M. E. Donders, M. C. M. van de Sanden, P. H. L. Notten and W. M. M. Kessels, J. Vac. Sci. Technol., A, 2012, 30, 10801 Search PubMed.
- X. Meng, X.-Q. Yang and X. Sun, Adv. Mater., 2012, 24, 3589–3615 CrossRef CAS PubMed.
- O. Nilsen, V. Miikkulainen, K. B. Gandrud, E. Østreng, A. Ruud and H. Fjellvåg, Phys. Status Solidi A, 2014, 211, 357–367 CrossRef CAS.
- S. M. George, Chem. Rev., 2010, 110, 111–131 CrossRef CAS PubMed.
- C. Guan and J. Wang, Adv. Sci., 2016, 3, 1–23 Search PubMed.
- C. Guan, X. Qian, X. Wang, Y. Cao, Q. Zhang, A. Li and J. Wang, Nanotechnology, 2015, 26, 94001 CrossRef CAS PubMed.
- A. S. Cavanagh, Y. Lee, B. Yoon and S. M. George, ECS Trans., 2010, 33, 223–229 CAS.
- E. Østreng, P. Vajeeston, O. Nilsen and H. Fjellvåg, RSC Adv., 2012, 2, 6315–6322 RSC.
- A. Ruud, V. Miikkulainen, K. Mizohata, H. Fjellvåg and O. Nilsen, J. Vac. Sci. Technol., A, 2017, 35, 01B133 Search PubMed.
- A. C. Kozen, A. J. Pearse, C. Lin, M. A. Schroeder, M. Noked, S. B. Lee and G. W. Rublo, J. Phys. Chem. C, 2014, 118, 27749–27753 CAS.
- M. Putkonen, T. Aaltonen, M. Alnes, T. Sajavaara, O. Nilsen and H. Fjellvag, J. Mater. Chem., 2009, 19, 8767–8771 RSC.
- H. B. Profijt, S. E. Potts, M. C. M. van de Sanden and W. M. M. Kessels, J. Vac. Sci. Technol., A, 2011, 29, 50801 Search PubMed.
- T. Aaltonen, O. Nilsen, A. Magrasó and H. Fjellvåg, Chem. Mater., 2011, 23, 4669–4675 CrossRef CAS.
- D. J. Comstock and J. W. Elam, J. Phys. Chem. C, 2013, 117, 1677–1683 CAS.
- M. E. Donders, W. M. Arnoldbik, H. C. M. Knoops, W. M. M. Kessels and P. H. L. Notten, J. Electrochem. Soc., 2013, 160, A3066–A3071 CrossRef CAS.
- T. Aaltonen, M. Alnes, O. Nilsen, L. Costelle and H. Fjellvåg, J. Mater. Chem., 2010, 20, 2877–2881 RSC.
- X. Meng, J. Liu, X. Li, M. N. Banis, J. Yang, R. Li and X. Sun, RSC Adv., 2013, 3, 7285–7288 RSC.
- J. Hämäläinen, J. Holopainen, F. Munnik, T. Hatanpää, M. Heikkilä, M. Ritala and M. Leskelä, J. Electrochem. Soc., 2012, 159, A259–A263 CrossRef.
- D. D. Williams and R. R. Miller, Ind. Eng. Chem. Fundam., 1970, 9, 454–457 CAS.
- H. A. Mosqueda, C. Vazquez, P. Bosch and H. Pfeiffer, Chem. Mater., 2006, 18, 2307–2310 CrossRef CAS.
- R. Dedryvere, L. Gireaud, S. Grugeon, S. Laruelle, J.-M. Tarascon and D. Gonbeau, J. Phys. Chem. B, 2005, 109, 15868–15875 CrossRef CAS PubMed.
- B. Put, P. M. Vereecken, J. Meersschaut, A. Sepúlveda and A. Stesmans, ACS Appl. Mater. Interfaces, 2016, 8, 7060–7069 CAS.
- S. Shi, Y. Qi, H. Li and L. G. Hector, J. Phys. Chem. C, 2013, 117, 8579–8593 CAS.
- M. E. Orazem, I. Frateur, B. Tribollet, V. Vivier, S. Marcelin, N. Pébère, A. L. Bunge, E. A. White, D. P. Riemer and M. Musiani, J. Electrochem. Soc., 2013, 160, C215–C225 CrossRef CAS.
- B. Hirschorn, M. E. Orazem, B. Tribollet, V. Vivier, I. Frateur and M. Musiani, Electrochim. Acta, 2010, 55, 6218–6227 CrossRef CAS.
Footnotes |
| † Electronic supplementary information (ESI) available: Additional in situ SE thickness measurements (thermal ALD of Li2CO3 at 50, 150, 250 and 300 °C and plasma ALD between 50 and 200 °C), hydrogen concentration in the films measured by ERD, XPS measurements before and after Ar+ sputtering showing chemical decomposition of Li2CO3, a table of XPS stoichiometry results and SEM images of Li2CO3 deposited using thermal ALD at different temperatures. See DOI: 10.1039/c7ra07722j |
‡ The surface density in atoms per cm2 can be calculated via  , where ρ is the mass density, μ the molecular mass of Li2CO3 and N Avogadros number. , where ρ is the mass density, μ the molecular mass of Li2CO3 and N Avogadros number. |
| This journal is © The Royal Society of Chemistry 2017 |


