 Open Access Article
Creative Commons Attribution 3.0 Unported Licence
Performance and durability of a layered proton conducting solid oxide fuel cell fueled by the dry reforming of methane
Youmin Guo *a,
Tingting Wana,
Ankang Zhua,
Tingting Shia,
Guilin Zhanga,
Chunchang Wang*a,
Hao Yub and
Zongping Shaocd
aSchool of Physics and Materials Science, Anhui University, No. 111 Jiulong Road, Hefei, 230601, China. E-mail: youminguo@ahu.edu.cn; ccwang@ahu.edu.cn
bCollege of Chemical and Environmental Engineering, Shandong University of Science and Technology, 266590, Qingdao, China
cJiangsu National Synergetic Innovation Center for Advanced Material, College of Energy, State Key Laboratory of Materials-Oriented Chemical Engineering, Nanjing Tech University, Nanjing 210009, China
dDepartment of Chemical Engineering, Curtin University, Perth, WA 6845, Australia
First published on 13th September 2017
Abstract
Catalyst layers derived from La2NiO4, LaNiO3 and Ni/La2O3 precursors were applied to a conventional Ni-based anode in a proton conducting solid oxide fuel cell (H+-SOFC) for the dry reforming of methane with CO2. The phase structures, microstructures and catalytic activities of catalysts from the different precursors were systematically investigated. The cell performance and durability of a H+-SOFC with a catalyst layer (layered H+-SOFC) were examined. The layered H+-SOFC had higher cell performances than the conventional H+-SOFC. However, catalyst deactivation and degradation of the cell performance were observed as carbon deposition occurred on the catalyst layer due to CO disproportionation in exhaust gas at a high partial pressure of CO. The structure of carbon deposited on the catalysts was also investigated.
1. Introduction
Carbon dioxide is a major greenhouse gas that significantly contributes to global warming. To mitigate its impact, technological strategies aimed at avoiding or reusing CO2 emissions are crucial. CO2 dry reforming of methane (CO2-DRM), which directly converts CH4 and CO2 into useful chemical products, i.e., syngas, has attracted renewed attention in recent years.1–4 However, there are two main drawbacks to CO2-DRM: the large amounts of energy consumed by the CO2-DRM reaction and carbon deposition onto catalysts.5–7 The former issue can be effectively solved by electrocatalytic reforming of CO2 with CH4 in a solid oxide fuel cell (SOFC) energy conversion device, which takes advantage of the catalyst material in the anode of the SOFC and generates large amounts of electrical power and syngas.8For in situ CO2-DRM over a SOFC anode, SOFCs based on proton conducting electrolytes (H+-SOFC) show outstanding advantages over SOFCs based on oxygen-ionic conducting electrolytes (O2−-SOFC).4,9–11 In a conventional H+-SOFC, a Ni-based material is the most attractive choice for the anode because it has a high catalytic activity and comparatively low cost. However, the conventional Ni-based anode faces problems, including sintering and carbon deposition, which lead to deactivation of the anode when it is used for CO2-DRM.12,13 Therefore, both enhancing the resistance of the conventional Ni-based anode to carbon deposition and prolonging its operation lifetime are of great significance.
Deposition of a catalyst layer with high activity for CO2-DRM and good resistance towards coke formation on the conventional Ni-based anode has been proposed to increase the operational stability and performance of SOFC fueled with methane.4,14,15 For instance, Wang et al. used a catalyst, GdNi–Al2O3, as a highly coking-resistant layer on the conventional Ni-based anode of O2−-SOFC. The fuel cell with a GdNi–Al2O3 catalyst layer had high cell performance and stability.14 Additionally, developing a catalyst layer over a Ni-based anode of H+-SOFC has been demonstrated to be an effective solution.4 For instance, Hua et al. concluded that a Ni0.8Co0.2–La0.2Ce0.8O1.9 catalyst layer had superior activity towards in situ dry reforming and improved CO2 resistance to that of the conventional Ni-base anode.4 Moreover, Verykios et al. have proved that using Ni-based catalysts with strongly basic alkaline oxides as supports can suppress carbon deposition.16 Various supports, including ZrO2, TiO2, CeO2, CeO2–ZrO2 and La2O3, have been used for Ni-based catalysts.17–19 Among them, La2O3 has been demonstrated to be a promising support owing to its possible transformation to La2O2CO3 under reactive conditions.16,20,21 However, carbon deposition is closely related to a catalyst's structure.21–23 Recently, we have demonstrated that La2NiO4 (LN) perovskite is a potential catalyst precursor of Ni/La2O3 for in situ CO2-DRM over a H+-SOFC anode. This crystalline perovskite contains active Ni homogeneously dispersed throughout the bulk. During the reduction process, some Ni metal particles migrate to the surface, resulting in the homogenous distribution of active Ni sites on the La2O3 support (Ni/La2O3). By applying this catalyst layer to the conventional H+-SOFC, a CH4–CO2 mixture was effectively converted to CO–H2 syngas on the catalyst layer, and then H2 produced in situ was consumed by H+-SOFC, yielding a syngas with a high CO concentration. Based on the results of an on-line GC analysis, the CO concentration can reach over 60% in the exhaust gas from the anode. However, according to the results of Luo et al., CO disproportionation occurs on Ni/La2O3/5A catalysts in a CO atmosphere, leading to the deposition of carbon.24 This suggests that the reduced LN catalyst on the H+-SOFC anode might lead to carbon deposition in a gas mixture with a high CO concentration, which would lead to a decreased catalytic activity and the degradation of cell performance. Thus, it is necessary to further examine the durability of the H+-SOFC with a catalyst layer (called layered H+-SOFC) fueled by a CH4–CO2 mixture, especially in exhaust gases with high concentrations of CO.
In the present work, perovskite-type oxides in the form of La2NiO4 (LN-1) and LaNiO3 (LN-2) were synthesized by the glycine nitrate process (GNP) method and used as catalytic precursors for CO2-DRM over a conventional Ni-based anode of a H+-SOFC. For comparison, Ni/La2O3 was also prepared by an impregnation method. The catalytic ability and carbon deposition properties of the catalysts derived from the different precursors were systematically studied. Finally, the cell performance and durability of the layered H+-SOFCs were investigated when using methane reforming as a fuel.
2. Experimental
2.1 Materials synthesis and catalyst preparation
A sol–gel process was used to prepare BaZr0.4Ce0.4Y0.2O3−δ (BZCY4), BaZr0.1Ce0.7Y0.2O3−δ (BZCY1) electrolytes and Ba0.5Sr0.5Co0.8Fe0.2O3−δ (BSCF) cathode material for H+-SOFC. Taking the synthesis of BSCF cathode as an example, a stoichiometric amount of Ba(NO3)2, Sr(NO3)2, Co(NO3)3·6H2O and Fe(NO3)3·9H2O was first dissolved in distilled water to obtain a transparent solution under heating. Complexing agents of EDTA and citric acid were mixed in distilled water by adding a proper amount of ammonia solution to adjust the pH value of the aqueous solution to ∼8. Next, the chelating solution was added into the salt solution slowly. The molar ratio of EDTA to CA to the total metal cations content was set at 1![[thin space (1/6-em)]](https://www.rsc.org/images/entities/char_2009.gif) :
:![[thin space (1/6-em)]](https://www.rsc.org/images/entities/char_2009.gif) 2
2![[thin space (1/6-em)]](https://www.rsc.org/images/entities/char_2009.gif) :
:![[thin space (1/6-em)]](https://www.rsc.org/images/entities/char_2009.gif) 1. The solution was heated at 80 °C and stirred until obtaining a viscous gel. By further heated at 240 °C in an oven, the gel was converted into a black ash. The synthesized powders were calcined for 5 h with a heating rate of 5 °C min−1. The calcinations temperatures for BZCY1, BZCY4 and BSCF were 1000 °C.
1. The solution was heated at 80 °C and stirred until obtaining a viscous gel. By further heated at 240 °C in an oven, the gel was converted into a black ash. The synthesized powders were calcined for 5 h with a heating rate of 5 °C min−1. The calcinations temperatures for BZCY1, BZCY4 and BSCF were 1000 °C.
Lanthanum nickel perovskite La2NiO4 (LN-1) and LaNiO3 (LN-2) catalysts were prepared by a glycine nitrate process (GNP). Metal nitrates of La(NO3)3·6H2O and Ni(NO3)2·6H2O were dissolved with glycine in distilled water at an equivalent ratio of 1![[thin space (1/6-em)]](https://www.rsc.org/images/entities/char_2009.gif) :
:![[thin space (1/6-em)]](https://www.rsc.org/images/entities/char_2009.gif) 2 under stirring. The resulting solution was heated at 80 °C to form a viscous gel. The obtained gel was dried in an oven at ∼250 °C and ignited to form an ash. The obtained ash was finally calcined in air for 5 h to achieve a perovskite structure. The calcination temperatures for LN-1 and LN-2 were 900 and 800 °C, respectively.
2 under stirring. The resulting solution was heated at 80 °C to form a viscous gel. The obtained gel was dried in an oven at ∼250 °C and ignited to form an ash. The obtained ash was finally calcined in air for 5 h to achieve a perovskite structure. The calcination temperatures for LN-1 and LN-2 were 900 and 800 °C, respectively.
The Ni/La2O3 catalyst, containing 15 wt% Ni, was prepared by a wet-impregnation method using nickel nitrate as the metal precursor. A weighed amount of nickel nitrate was placed in a beaker, and the appropriate amount of distilled water was added. After 30 min, an appropriate weight of La2O3 was added under continuous stirring. The mixture was stirred at ambient temperature for 5 h. The obtained slurry was then dried at 110 °C for 5 h on an electric heating board. After this treatment, the dried powder was calcined at 800 °C in air for 5 h.
2.2 Fabrication of cells
NiO + BZCY4 anode-supported BZCY1 electrolytes were prepared by the dry pressing technique described in our previous work.12 The NiO + BZCY4 anode was made from a mixture of 60 wt% NiO, 40 wt% BZCY4 and 5 wt% PVB as a pore former. The electrolyte layer was made from fine BZCY1 powders. According to the procedure described in our previous papers, the NiO + BZCY4 anode-supported BZCY1 dual layers were sintered at 1500 °C for 5 h. Then a BSCF slurry was prepared by adding ethylene glycol, isopropanol and glycerine and ground using a mortar-pestle for 1 h. After that, a cathode layer of BSCF was deposited on the surface of the BZCY1 electrolyte by spray coating and was fired at 1000 °C for 2 h. The obtained single cell had an effective area of 0.4 cm2. To prepare the layered H+-SOFC, various catalysts were deposited onto the surface of the NiO + BZCY4 anode by spray coating, followed by calcination at 800 °C for 2 h.2.3 Catalyst activity evaluation
The catalytic activities of the LN-1, LN-2 and Ni/La2O3 catalysts were conducted in a fixed bed reactor, using 0.2 g of a catalyst mixed with 0.4 g of silica. The samples were pre-treated in pure H2 with a flow rate of 50 mL min−1 at 700 °C for 2 h to reduce the perovskite oxides to a system based on Ni/La2O3. The CH4 and CO2 reactants (with the ratio of 1![[thin space (1/6-em)]](https://www.rsc.org/images/entities/char_2009.gif) :
:![[thin space (1/6-em)]](https://www.rsc.org/images/entities/char_2009.gif) 1) were diluted in He (10
1) were diluted in He (10![[thin space (1/6-em)]](https://www.rsc.org/images/entities/char_2009.gif) :
:![[thin space (1/6-em)]](https://www.rsc.org/images/entities/char_2009.gif) 10
10![[thin space (1/6-em)]](https://www.rsc.org/images/entities/char_2009.gif) :
:![[thin space (1/6-em)]](https://www.rsc.org/images/entities/char_2009.gif) 80 by volume) and fed from the top of the fixed bed reactor within the temperature range of 500–700 °C. The reactants and products were analyzed using a gas chromatograph (Varian 3800) equipped with a thermal conductivity detector (TCD). The CO2 conversion and CO selectivity were calculated via the equations indicated in our previous work.15
80 by volume) and fed from the top of the fixed bed reactor within the temperature range of 500–700 °C. The reactants and products were analyzed using a gas chromatograph (Varian 3800) equipped with a thermal conductivity detector (TCD). The CO2 conversion and CO selectivity were calculated via the equations indicated in our previous work.15
2.4 Characterizations
The reducibility of various catalysts was investigated by hydrogen temperature-programmed reduction (H2-TPR) in a BELCAT-A apparatus (BEL Japan, Inc.). Approximately 0.03 g of catalyst particles were placed in a U-type quartz reactor with an inner diameter of approximately 3 mm. The sample was pretreated under a pure argon atmosphere at a flow rate of 30 mL min−1 [STP] at 400 °C for 30 min. After it cooled to room temperature, the atmosphere was switched to 10 vol% H2/Ar, and the reactor was programmatically heated to 900 °C, with a heating rate of 10 °C min−1. The amount of hydrogen consumed was monitored by an in situ thermal conductivity detector (TCD).The specific surface area of the catalysts was characterized by N2 adsorption at liquid nitrogen temperature using a surface area analyzer (BELSORP II, Japan). Prior to nitrogen adsorption, the samples were degassed at 300 °C for 2 h to remove any physically adsorbed species. The surface area was determined from the linear portion of the BET equation. The Ni particle sizes of the reduced catalysts were verified by TEM (JEM-2100).
Laser Raman spectroscopy of the various catalysts was performed after treatment at 700 °C under a CO–H2 mixture for 10 h using in an HR800 UV Raman microspectrometer (invia-Refiex) and the green line of an argon laser as the excitation source. Thermogravimetric (TG) measurements were performed in air on the various reduced catalysts after different treatments using a STA 449 F3 analyzer (NETZSCH Instruments Co. Ltd.). Before TG analysis, the reduced catalysts were treated with a CH4–CO2 mixture at 700 °C for 10 h or a 80%CO–20%H2 mixture at 700 °C for 5 h.
The powder X-ray diffraction (XRD) patterns of the synthesized and treated catalysts were recorded on a Smartlab 9 kW diffractometer with a Cu Kα radiation source (λ = 1.5418 Å) at 40 kV and 100 mA. Spectra were collected in the range 2θ = 20–80°, with a step of 0.05° and an acquisition time of 1 s for each point.
The I–V polarization curves of the fuel cells were measured at 500–700 °C using a Keithley 2420 source meter in a 4-probe mode. During the measurements, hydrogen and CH4–CO2 gas mixtures were separately fed into the anode chamber, and ambient air was used as the oxidant gas in the cathode chamber. The flow rate of hydrogen and the CH4–CO2 mixture was maintained at 80 mL min−1. The durability tests were performed on single cells with various catalyst layers under a constant current load. The corresponding electrochemical impedance spectra (EIS) of the single cells were carried out using a Solartron 1260A. The EIS was monitored under open circuit voltage conditions. The applied frequency ranged from 104 to 10−1 Hz, and the signal amplitude was 200 mV.
3. Results and discussion
3.1 Basic properties of the synthesized catalysts
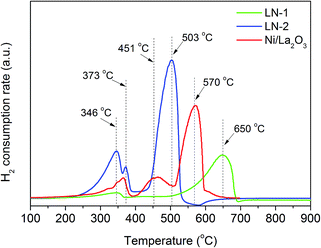
One significant advantage of H+-SOFC is that it can operate at an intermediate-to-low temperature range of 400–700 °C. A catalyst coating on the layered H+-SOFC, LN-1, LN-2 and Ni/La2O3 catalysts should be easily reduced at the operating temperature. Therefore, the reduction behaviors of LN-1, LN-2 and Ni/La2O3 were first investigated by a temperature programmed reduction (TPR) technique. As shown in Fig. 1, two peaks were observed for the LN-1 samples, and the main peak at 650 °C corresponded to the complete reduction of LN-1 to Ni and La2O3, which was consistent with previously reported results.25 Three peaks at 345, 373 and 503 °C were observed for LN-2 samples. According to the literature,26,27 the first reduction peak at 345 °C was due to the reduction of Ni3+ to Ni2+, and the third peak at 503 °C corresponded to the reduction of Ni2+ to Ni0 (metallic nickel), both of which came from the perovskite structure. This result indicated that the perovskite structure of LN-2 was destroyed and the metallic Ni particles were dispersed over La2O3. The small peak at 373 °C can be associated with the reduction of Ni2+ to Ni0 in a NiO phase. The Ni/La2O3 catalyst also showed three reduction peaks. The peaks at 366 and 570 °C corresponded to the reduction of Ni/La2O3, while the intermediate peak was attributed to the reduction of Ni2+ to Ni0 in the LN-2 perovskite structure.28 For all the samples, the reduction of Ni2+ to metallic Ni occurred at a high temperature. This TPR experiment confirms that the synthesized samples can be completely reduced at a temperature of 700 °C.Fig. 2 shows the XRD patterns of the synthesized LN-1, LN-2 and Ni/La2O3 catalysts before and after the hydrogen reduction. After calcining, only the LN-1 and LN-2 perovskite structures were observed for LN-1 and LN-2 samples, respectively (Fig. 2a and b). For the Ni/La2O3 sample, aside from the diffraction peaks of La2O3 (27.0 and 28.1°), some additional diffraction peaks at 2θ = 32.8° were also found. This indicated that the formation of the LN-2 perovskite structure occurred during the high temperature calcination process, which agreed with our TPR results. After reduction under a hydrogen atmosphere at 700 °C for 2 h, the perovskite structures of LN-1 and LN-2 were completely destroyed and the only detected phases were Ni0 and La2O3 for all the samples.
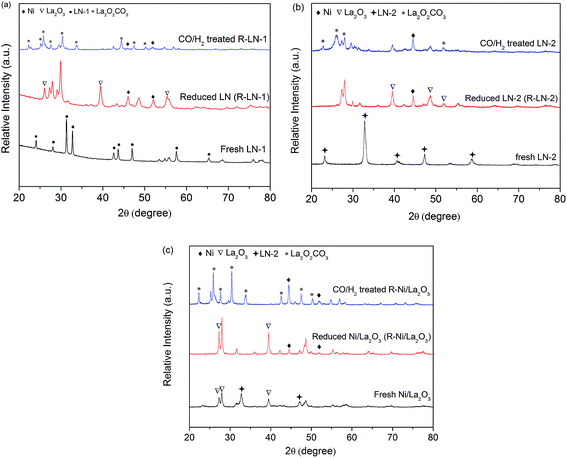 | ||
| Fig. 2 XRD patterns of the synthesized, reduced and treated samples: (a) LN-1; (b) LN-2 and (c) Ni/La2O3. | ||
The BET surface areas of the synthesized LN-1, LN-2 and Ni/La2O3 samples were 2.6, 3.0 and 3.9 m2 g−1, respectively, which were typical of these materials when prepared from high temperature calcinations. After the reduction, the BET surface areas increased to 13.5, 11.3 and 10.8 m2 g−1, respectively. To observe the state of Ni particles on reduced catalysts (before the CO2-DRM reaction), the microstructures of the reduced samples were investigated using TEM. As presented in Fig. 3, the Ni particle sizes in reduced LN-1, LN-2 and Ni/La2O3 ranged from 20–50, 40–90 and 20–50 nm, respectively. Smaller nickel particles were observed in reduced LN-1 than in LN-2, which could be attributed to the lower nickel content in LN-1 than in LN-2. Furthermore, the Ni species were highly dispersed and uniformly distributed in all the samples, agreed with the results from the XRD analysis. A high dispersion of Ni will likely improve the catalytic activity of the catalysts.
3.2 Catalytic activity and cell performance
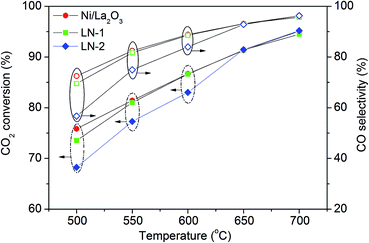
Fig. 4 presents stable values for the conversion of CO2 and selectivity of CO Ni/La2O3, which originated from the LN-1, LN-2 and Ni/La2O3 catalyst precursors. In the low temperature range of 500 to 600 °C, the reduced Ni/La2O3 catalysts showed better catalytic performances than LN-1 and LN-2. However, with the rise in temperature, both CO2 conversion and CO selectivity increased to similar values. For instance, CO2 conversions and CO selectivity reached as high as 95% and 96%, respectively, for all of the reduced catalysts at 700 °C. This result indicates that all of the selected precursors are potential catalysts for CO2-DRM and produce H2/CO syngas as a fuel for the layered H+-SOFC.The catalysts derived from various precursors were then investigated as a catalyst layer in a single cell with 32 μm thick BZCY1 electrolyte. Before feeding fuel into the anode, pure H2 was introduced to reduce the catalyst precursors for 2 h at 700 °C. Fig. 5 shows the I–V curves of the layered H+-SOFC fueled by a H2 and CH4–CO2 mixture at 700 °C. By applying CH4–CO2 as the fuel, the cell delivered peak power densities of 199, 263, 228 and 209 mW cm−2 for bare H+-SOFC and layered H+-SOFC with LN-1, LN-2 and Ni/La2O3 catalyst precursors, respectively, while they were 698, 680, 659 and 620 mW cm−2, respectively, when pure hydrogen was applied as the fuel. These results showed that the layered H+-SOFC with different catalysts delivered higher cell performances than that of the conventional H+-SOFC in a CH4–CO2 atmosphere. It further demonstrated that the catalyst layer improved the catalytic activity of H+-SOFC for CO2-DRM reaction and produced the high power outputs.
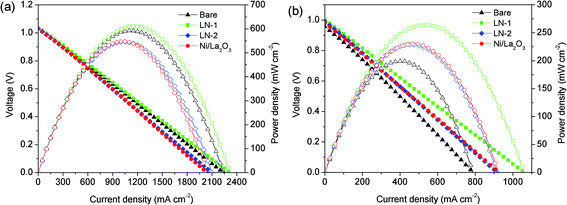 | ||
| Fig. 5 I–V curves of the conventional H+-SOFC and layered H+-SOFC at 700 °C under (a) H2 and (b) CH4–CO2. | ||
3.3 Durability of cell and carbon deposition
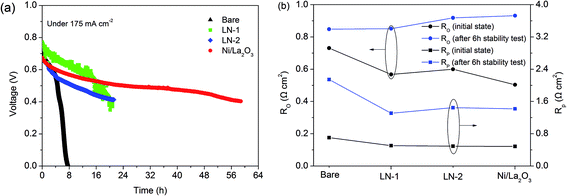
The operational durability of the layered H+-SOFC with different catalyst layers under a specific current density at 700 °C was studied. As shown in Fig. 6a, under a specific current density of 175 mA cm−2, cells with a catalyst layer were much more stable than that without any catalyst. For instance, the voltage decreased 11.9%, 15.4%, 11.1% and 19.7% for the cells with the LN-1, LN-2, Ni/La2O3 catalyst layer and bare H+-SOFC in the first 4 hours, respectively. By increasing the operation time, the voltage of all the cells continued to decrease. The voltage of bare H+-SOFC started to decrease sharply, leading to a terminal voltage of zero. All the layered H+-SOFCs decreased slowly compared to bare H+-SOFC, especially for the cell with the Ni/La2O3 catalyst layer. To clarify the effect of the catalyst, the ohmic resistance of the electrolyte and overpotential resistances of the electrodes for the fuel cells operated with CH4–CO2 mixture gas were calculated according to the electrochemical impedance spectra (EIS) for the fuel cells. In calculation, the intercept at high frequency was used for ohmic resistance of the electrolyte (Ro), and the difference between the low frequency intercept and the high frequency intercept on the real axis was used as the overpotential resistance of the electrodes (Rp). Fig. 6b shows the corresponding values at the initial stage and after the stability test for 6 hours. Because the cathode for all the fuel cells were same and operated in air atmosphere, the increase in overpotential resistance can be ascribed to the anode part. It demonstrated that both the Ro and Rp increased obviously after the stability test for 6 hours, especially for the bare H+-SOFC. This finding agrees well with the degradation of the fuel cell performance in Fig. 6a. As mentioned above, when the H2 in the produced H2/CO syngas was consumed as a fuel by the layered H+-SOFC, the reduced catalysts were exposed to a H2/CO mixture with a high partial pressure of CO. This high CO/H2 ratio could lead to carbon deposition via the CO disproportionation reaction (2CO → C + CO2) and result in catalyst deactivation and degradation of cell performance.29 Thus, this degradation may be caused by the severe coke buildup on the anode that was visible to the eye after the test.To investigate the carbon deposition on the reduced catalysts of the layered H+-SOFC in a gas mixture with a high CO/H2 ratio, the catalysts were treated in an H2/CO atmosphere (1![[thin space (1/6-em)]](https://www.rsc.org/images/entities/char_2009.gif) :
:![[thin space (1/6-em)]](https://www.rsc.org/images/entities/char_2009.gif) 4 in vol%) at 700 °C for 5 h and then subjected to XRD and TG analysis. After treatment, the weight of the treated catalysts was significantly larger than that of the reduced catalysts, suggesting that some carbon formed on the catalysts. As presented in Fig. 2, the diffraction peaks of La2O2CO3 were detected in all of the treated samples. Apparently, La2O2CO3 was formed by a reaction between La2O3 and CO2 (La2O3 + CO2 → La2O2CO3). This suggests that carbon deposition occurred with the formation of CO2 via CO disproportionation, which agreed with other reports findings.30,31 No diffraction peaks corresponding to graphitic carbon were detected, indicating that the carbon remained amorphous or had a very small particle size. Fig. 7 shows the TG profiles of the treated catalysts in air after treatment. Large weight losses were observed for all of the catalysts, especially for LN-2, whose weight loss reached 70%. These weight losses can be attributed to the removal of deposited carbon. The largest weight loss (LN-2) was due to the high content of Ni in the LN-2 system than in the other catalysts systems. This result further demonstrated that large amounts of carbon formed on the catalysts in a H2/CO mixture with high partial pressure of CO, which caused catalyst activation and degradation in cell performance.
4 in vol%) at 700 °C for 5 h and then subjected to XRD and TG analysis. After treatment, the weight of the treated catalysts was significantly larger than that of the reduced catalysts, suggesting that some carbon formed on the catalysts. As presented in Fig. 2, the diffraction peaks of La2O2CO3 were detected in all of the treated samples. Apparently, La2O2CO3 was formed by a reaction between La2O3 and CO2 (La2O3 + CO2 → La2O2CO3). This suggests that carbon deposition occurred with the formation of CO2 via CO disproportionation, which agreed with other reports findings.30,31 No diffraction peaks corresponding to graphitic carbon were detected, indicating that the carbon remained amorphous or had a very small particle size. Fig. 7 shows the TG profiles of the treated catalysts in air after treatment. Large weight losses were observed for all of the catalysts, especially for LN-2, whose weight loss reached 70%. These weight losses can be attributed to the removal of deposited carbon. The largest weight loss (LN-2) was due to the high content of Ni in the LN-2 system than in the other catalysts systems. This result further demonstrated that large amounts of carbon formed on the catalysts in a H2/CO mixture with high partial pressure of CO, which caused catalyst activation and degradation in cell performance.
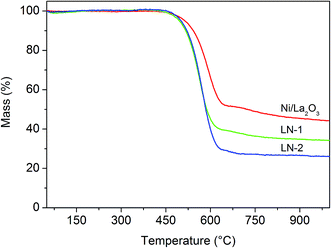 | ||
| Fig. 7 TG analysis of the reduced LN-1, LN-2 and Ni/La2O3 catalysts after treated in CO/H2 mixture gas. | ||
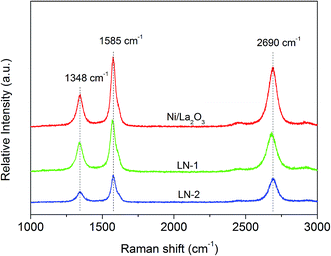
The structures of the deposited carbon on the treated catalysts in the H2/CO atmosphere was then further studied by ex situ Raman analysis. Fig. 8 shows the Raman spectra of the three catalysts after treatment. Three main peaks at 1348, 1585 and 2690 cm−1 were observed, which could be assigned to the D-band, G-band and 2D band of carbon, respectively.32 According to the literature, the G-band is the main fundamental peak and corresponds to the honeycomb crystalline structure of graphitic samples. The D-band is related to defects within this structure, while the 2D band arises from a resonant interaction between the electronic structure of the carbon and any incident light.33 The Ni/La2O3 sample had the largest D, G and 2D peaks compared to the other samples, suggesting that the Ni/La2O3 sample had the most graphitic carbon. However, the graphitization degree of carbon is usually expressed by the intensity ratio of D/G and is reported to be typically less than 1.0.34,35 After our calculations, very similar values of D/G were found: 1.10, 1.17 and 1.13 over the treated LN-1, LN-2 and Ni/La2O3 at 700 °C, respectively. This strongly suggested that carbon was mainly in an amorphous state in the treated catalysts, which agreed well with the XRD results.
4. Conclusion
Layered H+-SOFC has demonstrated to exhibit power consumption advantage. In the anode compartment, methane is internally dry reformed by carbon dioxide and hydrogen-rich products are produced. The electrochemical reaction occurs at the three-phase boundaries (TPB) of both electrodes by consuming hydrogen produced, producing proton flow through the electrolyte and electron across the electrodes. Electrical energy is hence produced associated with heat generation during the process. The heat generated is partly used to dry reforming of methane, partly dissipated to the environment. In this study, layered H+-SOFC with a Ni/La2O3 catalyst layer derived from La2NiO4, LaNiO3 and Ni/La2O3 precursors was prepared for an in situ CO2-DRM reaction. Although better cell performance was obtained for all of the layered H+-SOFC than for the conventional H+-SOFC, a large amount of carbon deposition was observed on the layered H+-SOFC after the durability test. As a result, the catalytic activities for the layered catalysts decreased and cell performance of the layered H+-SOFC was degraded. Further investigation demonstrated that CO disproportionation occurred in an exhaust gas with a high partial pressure of CO, leading to deposition of amorphous carbon onto the reduced catalyst. The present study revealed that the carbon deposition properties of the catalyst layer in a H2–CO exhaust gas with a high partial pressure of CO should be considered when exploring a potential catalyst for the layered H+-SOFC for the CO2-DRM reaction. However, because the accumulated carbon is amorphous, regeneration of the catalyst should be feasible. In our future work, we will focus on the regeneration of these catalysts.Conflicts of interest
There are no conflicts to declare.Acknowledgements
This work was supported by National Natural Science Foundation of China (51502001 & 51572001), Natural Science Fund of Anhui Province (1608085MB31), Provincial Natural Science Research Program of Higher Education Institutions of Anhui Province (KJ2015A0501), Anhui University Personnel Recruiting Project of Academic and Technical Leaders (J01006029) and the State Key Laboratory of Materials-Oriented Chemical Engineering (KL15-01).References
- A. Tsoukalou, Q. Imtiaz, S. M. Kim, P. M. Abdala, S. Yoon and C. R. Müller, J. Catal., 2016, 343, 208–214 CrossRef CAS.
- Z. Zhang, X. E. Verykios, S. M. MacDonald and S. Affrossman, J. Phys. Chem., 1996, 100, 744–754 CrossRef CAS.
- M. M. Nair, S. Kaliaguine and F. Kleitz, ACS Catal., 2014, 4, 3837–3846 CrossRef CAS.
- B. Hua, N. Yan, M. Li, Y.-q. Zhang, Y.-f. Sun, J. Li, T. Etsell, P. Sarkar, K. Chuang and J.-L. Luo, Energy Environ. Sci., 2016, 9, 207–215 CAS.
- D. J. Moon and J. W. Ryu, Catal. Today, 2003, 87, 255–264 CrossRef CAS.
- G. Valderrama, M. R. Goldwasser, C. U. d. Navarro, J. M. Tatibouët, J. Barrault, C. Batiot-Dupeyrat and F. Martínez, Catal. Today, 2005, 107–108, 785–791 CrossRef CAS.
- P. Kumar, Y. Sun and R. O. Idem, Energy Fuels, 2008, 22, 3575–3582 CrossRef CAS.
- G. Goula, V. Kiousis, L. Nalbandian and I. V. Yentekakis, Solid State Ionics, 2006, 177, 2119–2123 CrossRef CAS.
- V. Kyriakou, I. Garagounis, A. Vourros, E. Vasileiou, A. Manerbino, W. G. Coors and M. Stoukides, Appl. Catal., B, 2016, 186, 1–9 CrossRef CAS.
- N. Radenahmad, A. Afif, P. I. Petra, S. M. H. Rahman, S.-G. Eriksson and A. K. Azad, Renewable Sustainable Energy Rev., 2016, 57, 1347–1358 CrossRef CAS.
- Z. Tao, Q. Zhang, X. Xi, G. Hou and L. Bi, Electrochem. Commun., 2016, 72, 19–22 CrossRef CAS.
- Y. Guo, M. Bessaa, S. Aguado, M. C. Steil, D. Rembelski, M. Rieu, J.-P. Viricelle, N. Benameur, C. Guizard, C. Tardivat, P. Vernoux and D. Farrusseng, Energy Environ. Sci., 2013, 6, 2119–2123 CAS.
- V. Menon, A. Banerjee, J. Dailly and O. Deutschmann, Appl. Energy, 2015, 149, 161–175 CrossRef CAS.
- W. Wang, C. Su, R. Ran and Z. Shao, J. Power Sources, 2011, 196, 3855–3862 CrossRef CAS.
- T. Wan, A. Zhu, Y. Guo, C. Wang, S. Huang, H. Chen, G. Yang, W. Wang and Z. Shao, J. Power Sources, 2017, 348, 9–15 CrossRef CAS.
- X. E. Verykios, Int. J. Hydrogen Energy, 2003, 28, 1045–1063 CAS.
- S. Therdthianwong, A. Therdthianwong, C. Siangchin and S. Yongprapat, Int. J. Hydrogen Energy, 2008, 33, 991–999 CrossRef CAS.
- M. M. Barroso-Quiroga and A. E. Castro-Luna, Int. J. Hydrogen Energy, 2010, 35, 6052–6056 CrossRef CAS.
- S. Wang, G. Q. Lu and G. J. Millar, Energy Fuels, 1996, 10, 896–904 CrossRef CAS.
- E.-h. Yang, N. Y. Kim, Y.-s. Noh, S. S. Lim, J.-S. Jung, J. S. Lee, G. H. Hong and D. J. Moon, Int. J. Hydrogen Energy, 2015, 40, 11831–11839 CrossRef CAS.
- R. Pereniguez, V. M. Gonzalez-delaCruz, A. Caballero and J. P. Holgado, Appl. Catal., B, 2012, 123, 324–332 CrossRef.
- N. F. P. Ribeiro, R. C. R. Neto, S. F. Moya, M. M. V. M. Souza and M. Schmal, Int. J. Hydrogen Energy, 2010, 35, 11725–11732 CrossRef CAS.
- I. Rivas, J. Alvarez, E. Pietri, M. J. Pérez-Zurita and M. R. Goldwasser, Catal. Today, 2010, 149, 388–393 CrossRef CAS.
- J. Z. Luo, Z. L. Yu, C. F. Ng and C. T. Au, J. Catal., 2000, 194, 198–210 CrossRef CAS.
- G. Sierra Gallego, F. Mondragón, J.-M. Tatibouët, J. Barrault and C. Batiot-Dupeyrat, Catal. Today, 2008, 133–135, 200–209 CrossRef CAS.
- S. M. de Lima, M. A. Peña, J. L. G. Fierro and J. M. Assaf, Catal. Lett., 2008, 124, 195 CrossRef.
- S. M. Lima, J. M. Assaf, M. A. Peña and J. L. G. Fierro, Appl. Catal., A, 2006, 311, 94–104 CrossRef CAS.
- K. Sutthiumporn and S. Kawi, Int. J. Hydrogen Energy, 2011, 36, 14435–14446 CrossRef CAS.
- Z.-F. Yan, R.-G. Ding, L.-H. Song and L. Qian, Energy Fuels, 1998, 12, 1114–1120 CrossRef CAS.
- Z. Zhang and X. E. Verykios, Appl. Catal., A, 1996, 138, 109–133 CrossRef CAS.
- H. M. Swaan, V. C. H. Kroll, G. A. Martin and C. Mirodatos, Catal. Today, 1994, 21, 571–578 CrossRef CAS.
- J. Schwan, S. Ulrich, V. Batori, H. Ehrhardt and S. R. P. Silva, J. Appl. Phys., 1996, 80, 440–447 CrossRef CAS.
- R. C. Maher, V. Duboviks, G. J. Offer, M. Kishimoto, N. P. Brandon and L. F. Cohen, Fuel Cells, 2013, 13, 455–469 CrossRef CAS.
- A. Cuesta, P. Dhamelincourt, J. Laureyns, A. Martínez-Alonso and J. M. D. Tascón, Carbon, 1994, 32, 1523–1532 CrossRef CAS.
- M. B. Pomfret, J. Marda, G. S. Jackson, B. W. Eichhorn, A. M. Dean and R. A. Walker, J. Phys. Chem. C, 2008, 112, 5232–5240 CAS.
| This journal is © The Royal Society of Chemistry 2017 |

