 Open Access Article
Creative Commons Attribution 3.0 Unported Licence
The structural, electronic and catalytic properties of Aun (n = 1–4) nanoclusters on monolayer MoS2
Hui Zhanga,
Jia Zhu *a,
Hongge Zhanga,
Jinyan Zhanga,
Yongfan Zhangbc and
Zhang-Hui Lu
 *a
*a
aCollege of Chemistry and Chemical Engineering, Jiangxi Normal University, Nanchang, Jiangxi 330022, China. E-mail: jia_zhu@jxnu.edu.cn; luzh@jxnu.edu.cn
bDepartment of Chemistry, Fuzhou University, Fuzhou, Fujian 350108, China
cState Key Laboratory of Photocatalysis on Energy and Environment, Fuzhou, Fujian 350002, China
First published on 4th September 2017
Abstract
The structural stability, electronic and catalytic properties of Aun (n = 1–4) nanoclusters supported on monolayer MoS2 have been investigated based on first principle DFT calculation with van der Waals (vdW) corrections. Our results show that all Aun (n = 1–4) nanoclusters prefer to bind vertically on the top S sites of the monolayer MoS2. And the relative stability of Aun (n = 1–4) clusters in gas phase is not preserved after landing on monolayer MoS2. By including van der Waals (vdW) corrections with different approaches, we found that the van der Waals correction increased the adsorption energies for all supported Aun (n = 1–4) clusters with the order of Eads(PBE-D2) > Eads(PBE-D3) > Eads(optB86b-vdW) > Eads(PBE). And the van der Waals effects can also change the order of stability and the energy differences of various deposition configurations. In addition, the binding of O2 is also modeled, showing significantly enhanced adsorption properties and catalytic activation toward O2 adsorption, especially for that on supported Au1 and Au3 clusters with magnetic properties, with respect to that on supported Au2 and Au4 clusters with nonmagnetic properties. The current study provides further insight into the adsorption and catalytic properties of small gold clusters supported on monolayer MoS2, which play a crucial role in the activation of O2.
1 Introduction
Supported gold nanoclusters have attracted considerable interest due to their unexpected catalytic properties in contrast with the inactivity of larger-sized particles or bulk gold.1,2 In the past few years, they have been widely applied in heterogeneous catalysis field to catalyze many reactions, such as low temperature CO oxidation,3–5 water-gas shift (WGS) reaction6,7 and the oxidation of alkenes.8 It is revealed that the chemical properties and catalytic activity of supported gold nanoclusters are dramatically depended by the size and shape of gold nanoclusters,9–12 the structural fluxionality,13–15 and the forms of the supported materials.10,16–18 Recent experimental and theoretical works have focused on the effects of support materials on modifying/activating Au clusters by comparing various substrates including MgO,18 TiO2,19 SiO2,20 CeO2,21 and Fe2O3.22 In particular, it is demonstrated that the different charged gold cluster is one of the origins for the high catalytic activity of supported gold nanoclusters. Well characterized examples are those of negative charged gold nanoclusters forming when gold clusters deposited on TiO2, defect MgO and CeO2, result in activation of O2 molecules for further catalytic reaction or dissociation.18,20,21 On the other hand, after adsorption on Fe2O3 and SiO2 surface the gold nanoclusters become positive charged, which promote adsorption of other reactants, such as CO and hydrocarbons.20,22,23 It is indicated that the catalytic activity of gold clusters are strongly influenced by the types of support materials. Therefore, the choice of suitable support is crucial for a rational design of chemical properties and activities of supported gold clusters.In the past few years, a continuously increasing interest have been devoted to two-dimensional nanomaterials, such as graphene, silicene, hexagonal boron nitride (h-BN), TiO2 nanosheet, serving as excellent candidates of the support of metal nanoparticles for enhancing adsorption performances and catalytic properties of metal catalysts, because of their extraordinary physical, chemical and optical properties.24–31 For example, graphene has been shown to be an excellent substrate material for dispersion of the transition metal (TM) nanoparticles, due to its large surface areas, outstanding electronic and thermal conductivity, as well as the high mechanical strength and low production cost.32,33 Theoretically calculation showed that supported gold clusters on h-BN surface can considerably enhance their adsorption and catalytic activity of adsorbed O2 molecule.28 On the other hand, the great advance in two-dimensional-based nanomaterials research has encouraged scientists to explore other two-dimension-based materials. Among them, one emerging class of transition metal dichalcogenides (TMDs), monolayer molybdenum disulfide (MoS2) has been a recent hot topic. Indeed, monolayer MoS2 is a semiconductor with a direct band gap of 1.9 eV,34 which are associated with large surface areas and abundant active sites.35,36 The experimental results from Xia et al. suggested that Au nanorods deposited on MoS2 nanosheets activates the electrocatalytic activity for hydrogen evolution reaction (HER).37 However, very little attention has been paid to theoretical investigation concerning the role of the MoS2 support on the chemical and catalytic properties of gold nanoparticles. The structural, electronic properties, and catalytic activation of supported gold clusters on monolayer MoS2 are also not obtained, which is very essential for investigating the cluster-support interaction effects, interface structure, as well as the charge transfer between supported gold cluster and substrate. In addition, van der Waals (vdW) forces are ubiquitous in the binding of atoms and molecules. In the past few years accurately accounting for van der Waals (vdW) forces and understanding the role they play in extended systems have become a thriving topic of research, which play a crucial role in improvement of theoretical description for those systems.34,38,39
In this work, by performing first principles DFT, we investigate the structures and electronic properties of Aun (n = 1–4) clusters supported on monolayer MoS2 including the van der Waals (vdW) forces correction. Furthermore, to further understand the modification/activation of gold nanoclusters on monolayer MoS2, the adsorption behaviors of O2 on Aun (n = 1–4)/MoS2 are also determined. The paper is organized as follows. We first study the gas-phase Aun (n = 1–4) clusters. Then, we investigate the structures and electronic properties of Aun (n = 1–4) clusters supported on monolayer MoS2 with DFT results. Furthermore, the effects of the van der Waals corrections using several vdW inclusive DFT schemes (PBE-D2, PBE-D3 and optB86b-vdW) are discussed. Finally, we discussed the adsorption and activation behaviors of O2 molecule on Aun (n = 1–4)/MoS2 systems, which can help for further insight into adsorption and catalysis properties of small gold clusters supported on monolayer MoS2.
2 Computational details
Spin-polarized density functional theory (DFT) calculations were performed using the Vienna Ab initio Simulation Package (VASP)40–42 and the projected augmented wave (PAW) methods.43,44 The generalized gradient approximation of Perdew, Burke and Ernzerhof (PBE) functional45 was employed to treat the exchange-correlation energy of interaction electrons. The kinetic energy cutoff for the plane-wave expansion was set to 400 eV. A (3 × 3 × 1) Monkhorst–Pack (MP) mesh was used for the k-point sampling of the Brillouin zone. To calculate the projected density of states (PDOS), the set of k-points was adjusted to (5 × 5 × 1). The lattice parameter of monolayer MoS2 was optimized to be 3.18 Å, which is in good agreement with the experimental (3.20 Å![[thin space (1/6-em)]](https://www.rsc.org/images/entities/char_2009.gif) 46) and theoretical values (3.18 Å,47,48 3.19 Å,49 3.20 Å
46) and theoretical values (3.18 Å,47,48 3.19 Å,49 3.20 Å![[thin space (1/6-em)]](https://www.rsc.org/images/entities/char_2009.gif) 50). To accommodate various sizes of the gold clusters, a (5 × 5) supercell consisting of 75 atoms (50 S atoms and 25 Mo atoms) was introduced. The supercell size of the monolayer MoS2 has been tested and the (5 × 5) supercell is large enough to obtain the properties focused on the present work. During the geometry optimization all the atoms in the monolayer MoS2 were relaxed in all directions.
50). To accommodate various sizes of the gold clusters, a (5 × 5) supercell consisting of 75 atoms (50 S atoms and 25 Mo atoms) was introduced. The supercell size of the monolayer MoS2 has been tested and the (5 × 5) supercell is large enough to obtain the properties focused on the present work. During the geometry optimization all the atoms in the monolayer MoS2 were relaxed in all directions.
For Au1 and Au2 clusters, we started by placing the Au1 and Au2 clusters on different sites of monolayer MoS2 as different adsorption models. Then these initial geometries were optimized using above settings. Since the ground states of Au3 and Au4 clusters in gas phase are V-shaped51 and rhombic52 structures, respectively. We first place these two clusters on the monolayer MoS2 as initial structures. The deposition of Au3 and Au4 clusters on the monolayer MoS2 are more complicated with many possible arrangements of the supported clusters on monolayer MoS2. Therefore, we performed ab initio MD simulations using the Nosé algorithm53 with a cutoff energy of 200 eV to explore possible structures of the Au3 and Au4 clusters deposition on monolayer MoS2. The simulation length was 10 ps with a time step of 1 fs at the temperature of 600 K. Then, some possible deposition configurations were sampled from the results of the MD simulations every 50 steps, result in 200 initial configurations for each MD process. Further structural optimizations using more accurate settings (see above) were performed to determine the typical stable configurations. Similar approaches have been employed to investigate other complicated systems, including CrW2O9/MgO(001),54,55 Au/TiO2 and Au/ZrO2(101).38
The role of the van der Waals correction was investigated using three vdW correction methods as follows: DFT-D2![[thin space (1/6-em)]](https://www.rsc.org/images/entities/char_2009.gif) 56 and DFT-D3
56 and DFT-D3![[thin space (1/6-em)]](https://www.rsc.org/images/entities/char_2009.gif) 57 with pairwise force field method proposed by Grimme and co-workers. The optB86b-vdW method proposed by Lundqvist and co-workers, in which the vdW contribution is expressed directly as a function of the electron density.58 In addition to van der Waal correction which is crucial to well describe the interaction between the cluster and substrate at the interface, the electronic structures for the adsorbed Aun clusters may be affected by the onsite correction to the strong correlated d electrons. Actually, test calculations using GGA + U method combined with projected augmented wave (PAW) were also performed, and our results indicated that GGA and GGA + U methods yielded similar results of configurations and electronic structure including total of Bader charge, the atomic Bader charge of adsorbed Aun cluster, total magnetization, the total DOSs and particle DOSs projected on the S 3p, Mo 4d, Au 6s and 5d orbitals in the present work.
57 with pairwise force field method proposed by Grimme and co-workers. The optB86b-vdW method proposed by Lundqvist and co-workers, in which the vdW contribution is expressed directly as a function of the electron density.58 In addition to van der Waal correction which is crucial to well describe the interaction between the cluster and substrate at the interface, the electronic structures for the adsorbed Aun clusters may be affected by the onsite correction to the strong correlated d electrons. Actually, test calculations using GGA + U method combined with projected augmented wave (PAW) were also performed, and our results indicated that GGA and GGA + U methods yielded similar results of configurations and electronic structure including total of Bader charge, the atomic Bader charge of adsorbed Aun cluster, total magnetization, the total DOSs and particle DOSs projected on the S 3p, Mo 4d, Au 6s and 5d orbitals in the present work.
3 Results and discussion
3.1 Structures of Aun (n = 1–4) clusters in the gas phase
Before considering the cases of supported gold clusters, we first discuss the structures of Aun (n = 1–4) clusters in gas phase. Many experimental59–64 and theoretical works51,52,65–67 have been devoted to the structures and stability of gold clusters. Schaaff et al.60 have isolated five massive gold-cluster molecules in high yield and the electronic structure of these molecules has been deduced by optical absorption spectroscopy. Zanti et al.51 have obtained the structures of small gold clusters Aun (n ≤ 16) using density functional theory at B3LYP level. Lee et al.52 further explore the relative stabilities and electronic properties of small neutral and anionic gold clusters (Aun and Aun−, n = 4–7) using high-level CCSD(T) calculations with large basis sets. In here, the geometry and the stability of Aun (n = 1–4) clusters (placed in a 20 × 20 × 20 Å cubic box) are reexamined at the PBE level with a plane-wave basis set. The calculated structures of ground state and low-lying isomers with corresponding structural parameters and relative energies are shown in Fig. 1. For Au2 cluster (Fig. 1b), the calculated Au–Au bond length is 2.53 Å, which is in agreement with the reported experimental value (2.47 Å).68 For Au3 cluster, there are two low-lying isomers. Fig. 1c shows that the ground state of Au3 cluster is V-shaped structure (C2v symmetry) with two Au–Au bonds (2.56 Å) and the bond angle of 137.7°. Other Au3 isomer (Fig. 1d) is triangular geometry with D3h symmetry, which is 0.11 eV higher in energy than that of the V-shaped Au3 cluster. Each Au–Au bond length of the equilateral triangle Au3 cluster is 2.67 Å. The order of the stability for the Au3 cluster is consistent with that obtained by Zanti et al. using B3LYP method with an atomic orbital basis set.51 In the case of Au4 cluster, there are four low-lying isomers: rhombic Au4, Y-shaped Au4, zigzag Au4 and tetrahedral Au4. The ground state of Au4 cluster (Fig. 1e) is rhombic with Cs symmetry. The bond lengths of Au–Au bonds at four side of rhombic Au4 cluster are all 2.69 Å and the length of diagonal Au–Au bond is 2.63 Å. The second low-lying isomer (Fig. 1f) is Y-shaped structure (C2v symmetry), which is just 0.04 eV higher in energy than that of the rhombic Au4 cluster. The calculated order of the stability for rhombic Au4 and Y-shaped Au4 is in agreement with the result at CCSD(T) level reported by Lee et al.52 While the third low-lying Au4 isomer (Fig. 1g) is Zigzag structure with Cs symmetry, whose energy is 0.41 eV higher than that of the ground state of Au4 cluster. It can be seen that rhombic Au4 cluster, Y-shaped Au4 cluster and Zigzag Au4 cluster are separated just by small energy differences. Thus, it can be expected that the interconversion of one isomer into another may occur among the three low-lying isomers of Au4 cluster. The fourth Au4 isomer with highly symmetric Td tetrahedral structure (Fig. 1h) has also been considered. It is the first occurring of 3D geometry of gold clusters. However, it is unstable in consequence of Jahn–Teller distortions, significantly 1.27 eV in energy higher with respect to the ground state of Au4 cluster.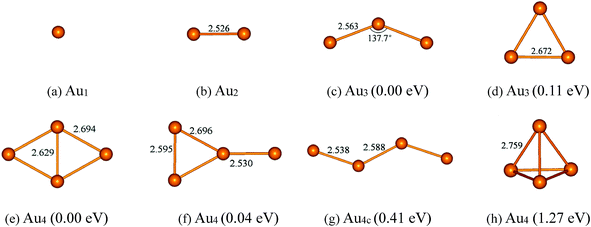 | ||
| Fig. 1 The optimized structures and their relative energies of Aun (n = 1–4) clusters. Selected bond lengths are given in angstroms and bond angles in degrees. | ||
3.2 Structures of Aun (n = 1–4) clusters supported on monolayer MoS2
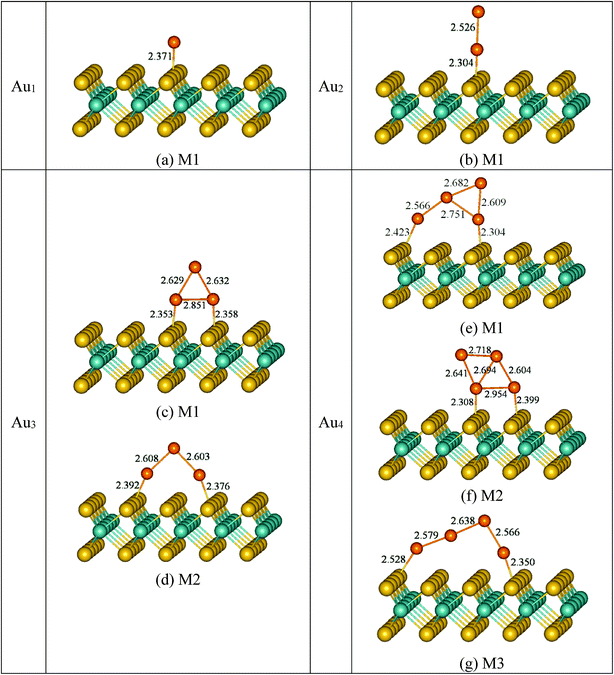 | ||
| Fig. 2 Optimized structures of Aun (n = 1–4) clusters adsorption on monolayer MoS2. Color coding: orange, Au atoms; yellow, S atoms; cyan, Mo atoms. Selected bond lengths are given in angstroms. | ||
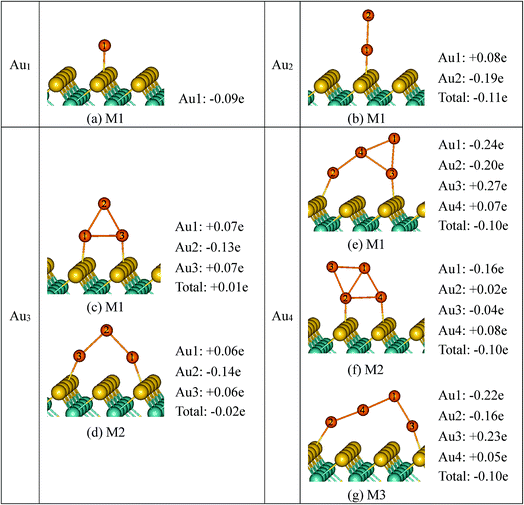
![[d with combining macron]](https://www.rsc.org/images/entities/i_char_0064_0304.gif) (Au–S)) for Aun (n = 1–4) clusters deposited on monolayer MoS2 with and without the inclusion of van der Waals forces
(Au–S)) for Aun (n = 1–4) clusters deposited on monolayer MoS2 with and without the inclusion of van der Waals forces
| Eadsa (eV) | ![[d with combining macron]](https://www.rsc.org/images/entities/i_char_0064_0304.gif) (Au–S) (Å) (Au–S) (Å) |
||||||||
|---|---|---|---|---|---|---|---|---|---|
| PBE | PBE-D2 | PBE-D3 | optB86b-vdW | PBE | PBE-D2 | PBE-D3 | optB86b-vdW | ||
| a The Eads in this table is defined as Eads = EMoS2(001) + EAun(n = 1–4) clusters − EAun/MoS2, where EMoS2, EAun(n = 1–4) clusters, EAun/MoS2 and n represent the total energies of the monolayer MoS2, the ground states of Aun (n = 1–4) clusters in the gas phase, the entire systems after depositing Aun (n = 1–4) clusters on monolayer MoS2 and the number of metal atoms in the cluster, respectively. | |||||||||
| Au1/MoS2 | M1 | 0.63 | 1.23 | 1.07 | 0.97 | 2.37 | 2.31 | 2.33 | 2.35 |
| Au2/MoS2 | M1 | 1.02 | 1.76 | 1.56 | 1.41 | 2.30 | 2.25 | 2.27 | 2.29 |
| Au3/MoS2 | M1 | 1.37 | 2.69 | 2.36 | 2.14 | 2.36 | 2.29 | 2.32 | 2.34 |
| M2 | 1.31 | 2.80 | 2.39 | 2.13 | 2.38 | 2.33 | 2.35 | 2.37 | |
| Au4/MoS2 | M1 | 1.48 | 3.09 | 2.67 | 2.29 | 2.36 | 2.30 | 2.33 | 2.35 |
| M2 | 1.39 | 2.91 | 2.51 | 2.17 | 2.35 | 2.27 | 2.31 | 2.33 | |
| M3 | 0.99 | 2.82 | 2.33 | 1.90 | 2.44 | 2.37 | 2.40 | 2.42 | |
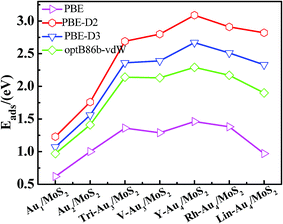 | ||
| Fig. 3 The adsorption energies of supported Aun (n = 1–4) clusters obtained at PBE, DFT-D2, DFT-D3 and optB86b-vdW (pink, red, dark blue and green polylines, respectively). | ||
To summarize, for Aun (n = 1–4) clusters on monolayer MoS2, we observed that the geometric structures change only slightly after inclusion of vdW forces, the largest difference being of 0.08 Å. While the van der Waals effects make the major corrections to the adsorption energies, with the relative order of Eads(PBE-D2) > Eads(PBE-D3) > Eads(optB86b-vdW) > Eads(PBE). The PBE-D2 method provides the largest correction to the strength of dispersion interactions, whereas optB86b-vdW gives the smallest. After inclusion of the van der Waals correction, it can also change the order of relative stability and the energy differences of various deposition configurations.
3.3 Electronic structures of Aun (n = 1–4) clusters supported on monolayer MoS2
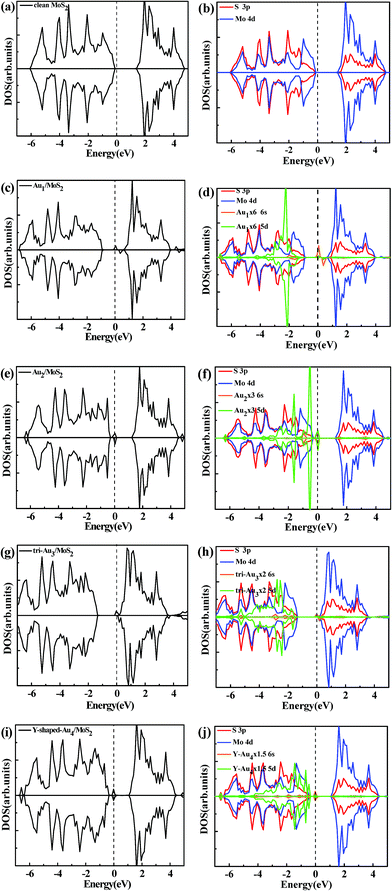
To better investigate the effects introduced by the deposition of Aun (n = 1–4) clusters on the monolayer MoS2, in this section, we will focus on the electronic structures of Aun (n = 1–4)/MoS2 systems. The density of state (DOS) curves displayed in Fig. 4 are the individual spin-up and spin-down densities of states obtained from the spin-polarized calculations at the PBE level, which are almost the same with and without vdW contributions.| Structures | ΔQa (e) | ||||
|---|---|---|---|---|---|
| PBE | PBE-D2 | PBE-D3 | optB86b-vdW | ||
| a The negative values indicate that the electrons are transferred from the monolayer MoS2 to the Aun (n = 1–4) clusters. | |||||
| Au1/MoS2 | M1 | −0.09 | −0.11 | −0.02 | −0.05 |
| Au2/MoS2 | M1 | −0.11 | −0.15 | −0.06 | −0.09 |
| Au3/MoS2 | M1 | 0.01 | 0.02 | 0.02 | 0.00 |
| M2 | −0.02 | −0.04 | −0.03 | −0.02 | |
| Au4/MoS2 | M1 | −0.10 | −0.12 | −0.12 | −0.13 |
| M2 | −0.10 | −0.13 | −0.15 | −0.07 | |
| M3 | −0.10 | −0.07 | −0.08 | −0.09 | |
| Eadsa (eV) | d (Au–O) (Å) | d (O–O) (Å) | |
|---|---|---|---|
| a The Eads in this table is defined as Eads = EAun/MoS2 + EO2 − EO2/Aun/MoS2, where EAun/MoS2, EO2, EO2/Aun/MoS2 and n represent the total energies of the most stable Aun (n = 1–4)/MoS2 system, the ground state of O2, the entire system after depositing O2 on Aun (n = 1–4)/MoS2, and the number of metal atoms in the cluster, respectively. | |||
| Free O2 | — | — | 1.23 |
| Clean MoS2 | 0.02 | — | 1.24 |
| Au1/MoS2 | 1.04 | 2.07 | 1.30 |
| Au2/MoS2 | 0.23 | 2.20 | 1.26 |
| Au3/MoS2 | 0.64 | 2.25, 2.26 | 1.32 |
| Au4/MoS2 | 0.26 | 2.21 | 1.26 |
3.4 Adsorption and activation of O2 on Aun (n = 1–4)/MoS2
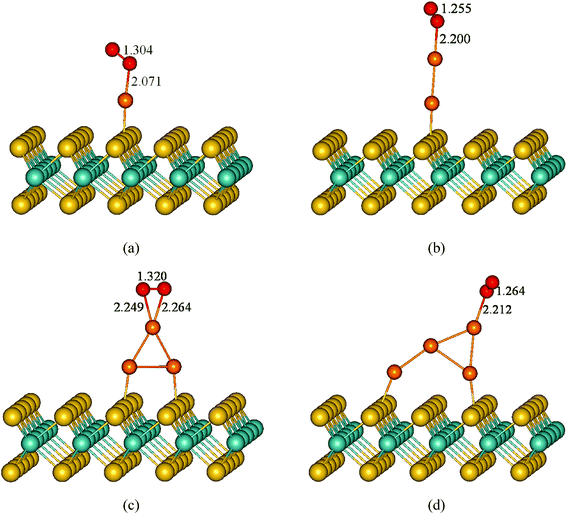
To study the effect of the monolayer MoS2 support on the catalytic properties of the small gold clusters, we performed investigation of adsorption and activation of O2 on the most stable adsorption configurations of Aun (n = 1–4)/MoS2 systems. Fig. 6 presents the optimized geometries of O2 adsorption on Aun (n = 1–4)/MoS2 systems. It can be seen clearly that, for all Aun (n = 1–4)/MoS2 systems, O2 molecule prefers to adsorb on the top Au atom of the supported gold cluster which holds main negative charge. For O2 adsorption on Au1/MoS2 system, O2 is adsorbed on the Au1/MoS2 system by forming one O–Au bond (2.07 Å) with the angle of 116.6° between the O–O and Au–O bonds. The O–O bond is elongated to 1.30 Å (1.23 Å in gas O2 molecule), indicating activation of O2 molecule. The adsorption energy is 1.04 eV. Similar results are also observed when O2 adsorbed on the supported Au3 cluster with odd number of Au atoms. Two O atoms are bonded with the top Au atom of supported Au3 cluster which holds more negative charge, forming two Au–O bonds (2.25 Å, 2.26 Å, respectively), with the corresponding adsorption energy of 0.64 eV. After adsorption, O–O bond is elongated to 1.32 Å, indicating significantly activation of adsorbed O2 molecule. Whereas, the situation is significantly different for O2 adsorption on supported Au2 and Au4 clusters with even number of Au atoms. After adsorption, O2 molecule via one O atom interacts with the top Au atom of the supported Au2 and Au4 clusters, with the bond length of Au–O bond of 2.20 Å and 2.21 Å respectively. The corresponding O–O bonds are almost not changed with the bond length of 1.26 Å compared with that in free gas O2. Corresponding adsorption energy is small (0.23 eV and 0.26 eV) for Au2 clusters and Au4 clusters, respectively. Since there is another Au atom at the interface (Au2 atom) in Au4/MoS2 system holds some negative charge (−0.20e), we also investigated the adsorption configuration when O2 interacts with Au2 atom which holds some negative charge. However, strong repulsive forces between surface S atoms and O2 molecule make the adsorption configuration not stable (not shown).In short, the above calculations for O2 adsorption show that the adsorption energies for O2 adsorption on the Au1/MoS2 and Au3/MoS2 systems with odd number of Au atoms are much higher than that on the Au2/MoS2 and Au4/MoS2 systems with even number of Au atoms (1.04 eV, 0.64 eV for Au and Au3, respectively. 0.23 eV, 0.26 eV for Au2 and Au4, respectively), indicating stronger adsorption properties and activation for oxygen molecule on Aun (n = 1, 3)/MoS2 system with odd number of gold atoms. It is provide a key insight in elucidating the catalytic activity of supported gold clusters with an odd-even alternation as a function of the number of gold atoms. This phenomenon has been reported for O2 molecule adsorption on the free gold clusters.73–75
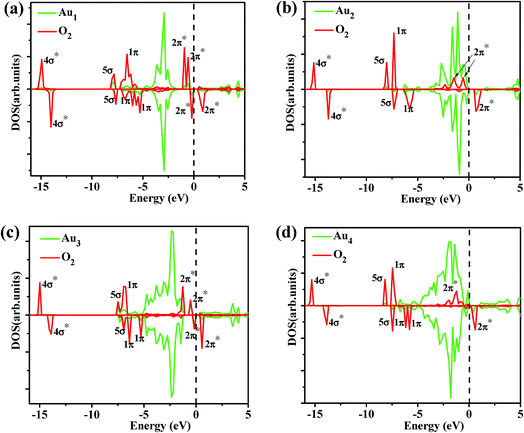
To gain more insight into the origin of the activity of Aun (n = 1–4)/MoS2, we observed the electronic structures of O2 adsorption on Aun (n = 1–4)/MoS2 systems. It is well-known that the singly occupied molecular orbital (SOMO) and the unoccupied one of the O2 triplet ground state are both antibonding 2π* orbital. The spin-up 2π* orbital of free O2 is occupied and located below the Fermi level, while the spin-down 2π* orbital of that is unoccupied and located above the Fermi level. We present the partial density of states (PDOS) projected on O2 molecule and supported Aun (n = 1–4) clusters in Fig. 7. Clearly, when O2 interacts with supported Aun (n = 1–4) clusters, the 5d and 6s state of Au atom is mixed with 1π and 2π* orbitals of the adsorbed O2, indicating bonding of Au and O2. Now the spin-down 2π* orbital of adsorbed O2 appears partial population, indicated charge transfer occurring from the supported Au atom to the antibonding 2π* orbital of the adsorbed O2, result in stretching of the O–O bond and the catalytic activation of O2 molecule (Fig. 6). Furthermore, the charge distribution of adsorbed O2, its neighbor Au atoms and Aun (n = 1–4) clusters were calculated using Bader charge analysis, as listed in Table 4. The charge values of the supported Aun (n = 1–4) clusters before O2 adsorption are in the range of −0.09e to −0.11e except virtually zero for Au3 cluster. After adsorption of O2 molecule, more electrons are transferred from supported gold clusters to O2 molecule, result in supported gold clusters become positive charge in the range of +0.11e to +0.35e. Further atomic Bader charge analysis (Table 4) shows that the values of charge obtained by O2 molecule mainly come from its neighboring Au atom which bonded to O2 molecule. It also can be seen clearly from the electron charge density difference of O2/Aun (1–4)/MoS2 (Fig. 8). The isosurface of an excess of the electron density is mainly localized on O2, while the plot of the electron density loss is on the Au atom directly interacting with O2 molecule. This is consistent with above analysis of charge transfer from the supported neighboring gold clusters to O2 molecule. Therefore, it is very clear that adsorption and activation of O2 molecule are strongly influenced by the top Au atom which holds more negative charge. In addition, the values of charge obtained by O2 molecule from supported Au1 (−0.39e) and Au3 clusters (−0.38e) are larger than that from supported Au2 cluster (−0.14e) and Au4 cluster (−0.18e), which are responsible for better catalytic activation of the adsorbed oxygen molecule. Note that from electron charge density difference (Fig. 8) there is more electron density localized on the O2/Aun (n = 1, 3)/MoS2 systems with odd number of Au atoms than that on the O2/Aun (n = 2, 4)/MoS2 systems with even number of Au atoms. This phenomenon corresponds to the above analysis of charge transfer from the supported gold clusters to O2 molecule.
| Substrate without O2 | Substrate with O2 | ||||
|---|---|---|---|---|---|
| ΔQ(Aun) | ΔQa(Au) | ΔQ(Aun) | ΔQb(Au) | ΔQ(O2) | |
| a ΔQ(Au) and.b ΔQ(Au) represent the charge value of the top Au atom which prefer to interact with O2, respectively. | |||||
| Au1/MoS2 | −0.09 | −0.09 | +0.35 | +0.35 | −0.39 |
| Au2/MoS2 | −0.11 | −0.19 | +0.11 | +0.23 | −0.14 |
| Au3/MoS2 | +0.01 | −0.13 | +0.25 | +0.30 | −0.38 |
| Au4/MoS2 | −0.10 | −0.24 | +0.16 | +0.20 | −0.18 |
4 Conclusions
In the present work, we studied the structures, electronic properties and catalytic properties of Aun (n = 1–4) clusters supported on monolayer MoS2 using DFT calculations with and without the inclusion of van der Waals (vdW) forces, including PBE, PBE-D2, PBE-D3 and optB86b-vdW methods. We found that all Aun (n = 1–4) clusters are preferentially vertically adsorbed on monolayer MoS2 by Au–S bonds. The relative stability of Aun (n = 1–4) clusters in gas phase is not preserved after landing on the monolayer MoS2, indicating a possible way to stabilize the unstable clusters in the gas phase by choosing a suitable support from a thermodynamical point of view. The van der Waals correction increased the adsorption energies for all supported Aun (n = 1–4) clusters with the relative order of adsorption energies of Eads(PBE-D2) > Eads(PBE-D3) > Eads(optB86b-vdW) > Eads(PBE). The van der Waals effects make the major corrections to the adsorption energies, and can also change the order of stability and the energy differences of various deposition configurations. The Bader charge analysis shows that, although the directions of charge transfer is from supported monolayer MoS2 to supported Aun (n = 1–4) clusters for all adsorption configurations, the top Au atoms far from the monolayer MoS2 hold main negative charge whereas most of Au atoms at the interface become positive charged. It is demonstrated that the excess of the negative charges obtained by the top Au atom can considerably promote the adsorption and catalytic activation of O2 on the supported Aun (n = 1–4) clusters, due to the charge transfer occurring from the top Au atom to the O2 2π* antibonding orbital, result in the elongation of the O–O bond and activation of O2. Furthermore, our results represent better adsorption properties and catalytic activities of adsorbed O2 on supported Au1 and Au3 clusters with magnetic properties, with respect to that on supported Au2 and Au4 clusters with nonmagnetic properties. The current study provides further insight into the adsorption and catalysis properties of small Aun (n = 1–4) clusters supported on monolayer MoS2, in which play a crucial role in the activation of O2. More works are necessary to study the structure and the electronic properties to clearly see whether the number-dependent adsorption properties still holds when larger Aun nanocluster (n > 4) supported on monolayer MoS2Conflicts of interest
There are no conflicts to declare.Acknowledgements
This work was supported by National Natural Science Foundation of China (Grant No. 21403094, 21373048), and the Independent Research Project of State Key Laboratory of Photocatalysis on Energy and Environment (No. 2014A02). We are grateful for the generous allocation of computer time on the National Supercomputer Center in Guangzhou houses Tianhe-2.References
- C. R. Henry, Surf. Sci. Rep., 1998, 31, 231–233 CrossRef CAS.
- G. Ertl and H. J. Freund, Phys. Today, 1999, 52, 32–38 CrossRef CAS.
- B. Yoon, H. Hakkinen, U. Landman, A. S. Worz, J. M. Antonietti, S. Abbet, K. Judai and U. Heiz, Science, 2005, 307, 403–407 CrossRef CAS PubMed.
- C. Zhang, B. Yoon and U. Landman, J. Am. Chem. Soc., 2007, 129, 2228–2229 CrossRef CAS PubMed.
- H. Y. Kim, H. M. Lee and G. Henkelman, J. Am. Chem. Soc., 2012, 134, 1560–1570 CrossRef CAS PubMed.
- Z. P. Liu, S. J. Jenkins and D. A. King, Phys. Rev. Lett., 2005, 94, 196102 CrossRef PubMed.
- Q. Fu, H. Saltsburg and M. Flytzani-Stephanopoulos, Science, 2003, 301, 935–938 CrossRef CAS PubMed.
- T. Mark, B. G. Vladimir, P. H. V. Owain, A. Pavel, B. G. Angel, S. T. Mintcho, F. G. J. Brian and M. L. Richard, Nature, 2008, 454, 981–983 CrossRef PubMed.
- H. Falsig, B. Hvolbaek, I. S. Kristensen, T. Jiang, T. Bligaard, C. H. Christensen and J. K. Nørskov, Angew. Chem., Int. Ed., 2008, 120, 4913–4917 CrossRef.
- H. Häkkinen, S. Abbet, A. Sanchez, U. Heiz and U. Landman, Angew. Chem., Int. Ed., 2003, 42, 1297–1300 CrossRef PubMed.
- A. Roldán, S. González, J. M. Ricart and F. Illas, ChemPhysChem, 2009, 10, 348–351 CrossRef PubMed.
- B. Yoon, P. Koskinen, B. Huber, O. Kostko, B. von Issendorff, H. Hakkinen, M. Moseler and U. Landman, ChemPhysChem, 2007, 8, 157–161 CrossRef CAS PubMed.
- N. Lopez and J. K. Nørskov, J. Am. Chem. Soc., 2002, 124, 11262–11263 CrossRef CAS PubMed.
- I. N. Remediakis, N. Lopez and J. K. Nørskov, Angew. Chem., Int. Ed., 2005, 117, 1858–1860 CrossRef.
- B. Yoon, H. Häkkinen, U. Landman, A. S. Wörz, J.-M. Antonietti, S. Abbet, K. Judai and U. Heiz, Science, 2005, 307, 403–407 CrossRef CAS PubMed.
- Z. P. Liu, X. Q. Gong, J. Kohanoff, C. Sanchez and P. Hu, Phys. Rev. Lett., 2003, 91, 266102 CrossRef PubMed.
- L. M. Molina and B. Hammer, J. Chem. Phys., 2005, 123, 161104 CrossRef CAS PubMed.
- A. Roldán, J. M. Ricart, F. Illas and G. Pacchioni, J. Phys. Chem. C, 2010, 114, 16973–16978 Search PubMed.
- D. Matthey, J. G. Wang, S. Wendt, J. Matthiesen, R. Schaub, E. Lægsgaard, B. Hammer and F. Besenbacher, Science, 2007, 315, 1692–1696 CrossRef CAS PubMed.
- S. Laursen and S. Linic, Phys. Rev. Lett., 2006, 97, 026101 CrossRef PubMed.
- B. T. Teng, J.-J. Lang, X. D. Wen, C. Zhang, M. Fan and H. G. Harris, J. Phys. Chem. C, 2013, 117, 18986–18993 CAS.
- G. J. Hutchings, M. S. Hall, A. F. Carley, P. Landon, B. E. Solsona, C. J. Kiely, A. Herzing, M. Makkee, J. A. Moulijn, A. Overweg, J. C. Fierro-Gonzalez, J. Guzman and B. C. Gates, J. Catal., 2006, 242, 71–81 CrossRef CAS.
- L. Fu, N. Q. Wu, J. H. Yang, F. Qu, D. L. Johnson, M. C. Kung, H. H. Kung and V. P. Dravid, J. Phys. Chem. B, 2005, 109, 3704–3706 CrossRef CAS PubMed.
- S. Stankovich, D. A. Dikin, G. H. B. Dommett, K. M. Kohlhaas, E. J. Zimney, E. A. Stach, R. D. Piner, S. T. Nguyen and R. S. Ruoff, Nature, 2006, 442, 282–286 CrossRef CAS PubMed.
- E. Gracia-Espino, G. Hu, A. Shchukarev and T. Wagberg, J. Am. Chem. Soc., 2014, 136, 6626–6633 CrossRef CAS PubMed.
- P. Vogt, P. D. Padova, C. Quaresima, J. Avila, E. Frantzeskakis, M. C. Asensio, A. Resta, B. Ealet and G. L. Lay, Phys. Rev. Lett., 2012, 108, 155501 CrossRef PubMed.
- G. Kim, A. R. Jang, H. Y. Jeong, Z. Lee, D. J. Kang and H. S. Shin, Nano Lett., 2013, 13, 1834–1839 CrossRef CAS PubMed.
- M. Gao, A. Lyalin and T. Taketsugu, J. Phys. Chem. C, 2012, 116, 9054–9062 CAS.
- T. Liao, Z. Sun and S. X. Dou, ACS Appl. Mater. Interfaces, 2017, 9, 8255–8262 CAS.
- L. Sheng, T. Liao, L. Kou and Z. Sun, Mater. Today Energ., 2017, 3, 32–39 CrossRef.
- T. Liao, Z. Sun, C. Sun, S. X. Dou and D. J. Searles, Sci. Rep., 2014, 4, 6256 CrossRef PubMed.
- A. K. Geim and K. S. Novoselov, Nat. Mater., 2007, 6, 183–191 CrossRef CAS PubMed.
- A. K. Geim, Science, 2009, 324, 1530–1534 CrossRef CAS PubMed.
- K. F. Mak, C. Lee, J. Hone, J. Shan and T. F. Heinz, Phys. Rev. Lett., 2010, 105, 136805 CrossRef PubMed.
- M. Chhowalla, H. S. Shin, G. Eda, L. J. Li, K. P. Loh and H. Zhang, Nat. Chem., 2013, 5, 263–275 CrossRef PubMed.
- J. Zhu, H. Zhang, Y. Tong, L. Zhao, Y. Zhang, Y. Qiu and X. Lin, Appl. Surf. Sci., 2017, 419, 522–530 CrossRef CAS.
- Y. Shi, J. Wang, C. Wang, T.-T. Zhai, W. J. Bao, J. J. Xu, X. H. Xia and H. Y. Chen, J. Am. Chem. Soc., 2015, 137, 7365–7370 CrossRef CAS PubMed.
- A. R. Puigdollers, P. Schlexer and G. Pacchioni, J. Phys. Chem. C, 2015, 119, 15381–15389 CAS.
- J. Carrasco, W. Liu, A. Michaelides and A. Tkatchenko, J. Chem. Phys., 2014, 140, 084704 CrossRef PubMed.
- G. Kresse and J. Hafner, Phys. Rev. B: Condens. Matter Mater. Phys., 1994, 49, 14251–14269 CrossRef CAS.
- G. Kresse and J. Furthmüller, Comput. Mater. Sci., 1996, 6, 15–50 CrossRef CAS.
- G. Kresse and J. Furthmüller, Phys. Rev. B: Condens. Matter Mater. Phys., 1996, 54, 11169–11186 CrossRef CAS.
- P. E. Blöchl, Phys. Rev. B: Condens. Matter Mater. Phys., 1994, 50, 17953–17979 CrossRef.
- G. Kresse and D. Joubert, Phys. Rev. B: Condens. Matter Mater. Phys., 1999, 59, 1758–1775 CrossRef CAS.
- J. P. Perdew, K. Burke and M. Ernherhof, Phys. Rev. Lett., 1996, 77, 3865–3868 CrossRef CAS PubMed.
- P. Joensen, E. D. Crozier, N. Alberding and R. F. Frindt, J. Phys. C: Solid State Phys., 1987, 20, 4043–4053 CrossRef CAS.
- D. Le, T. B. Rawal and T. S. Rahman, J. Phys. Chem. C, 2014, 118, 5346–5351 CAS.
- Q. Chen, Y. Ouyang, S. Yuan, R. Li and J. Wang, ACS Appl. Mater. Interfaces, 2014, 6, 16835–16840 CAS.
- D. Ma, Y. Tang and G. Yang, Appl. Surf. Sci., 2015, 328, 71–77 CrossRef CAS.
- C. Ataca and S. Ciraci, J. Phys. Chem. C, 2011, 115, 13303–13311 CAS.
- G. Zanti and D. Peeters, Theor. Chem. Acc., 2013, 132, 1300 CrossRef.
- H. M. Lee and K. S. Kim, Chem.–Eur. J., 2012, 18, 13203–13207 CrossRef CAS PubMed.
- S. Nosé, J. Chem. Phys., 1984, 81, 511–519 CrossRef.
- J. Zhu, H. Zhang, Y. W. Tong, Y. W. Tong, C. X. Wang, B. Wang, X. Huang and Y. F. Zhang, J. Chem. Phys., 2016, 144, 174706 CrossRef PubMed.
- J. Zhu, H. Zhang, L. Zhao, W. Xiong, X. Huang, B. Wang and Y. F. Zhang, Appl. Surf. Sci., 2016, 138, 213–222 CrossRef.
- S. Grimme, J. Comput. Chem., 2006, 27, 1787–1799 CrossRef CAS PubMed.
- S. Grimme, J. Antony, S. Ehrlich and H. Krieg, J. Chem. Phys., 2010, 132, 154104 CrossRef PubMed.
- M. Dion, H. Rydberg, E. Schröder, D. C. Langreth and B. I. Lundqvist, Phys. Rev. Lett., 2004, 92, 246401 CrossRef CAS PubMed.
- C. L. Cleveland, U. Landman, T. G. Schaaff, M. N. Shafigullin, P. W. Stephens and R. L. Whetten, Phys. Rev. Lett., 1997, 79, 1873–1876 CrossRef CAS.
- T. G. Schaaff, M. N. Shafigullin, J. T. Khoury, I. Vezmar, R. L. Whetten, W. G. Cullen, P. N. First, C. Gutiérrez-Wing, J. Ascensio and M. J. Jose-Yacamán, J. Phys. Chem. B, 1997, 101, 7885–7891 CrossRef CAS.
- K. J. Taylor, C. L. Pettiette-Hall, O. Cheshnovsky and R. E. Smalley, J. Chem. Phys., 1992, 96, 3319–3329 CrossRef CAS.
- K. Koga, H. Takeo, T. Ikeda and K. Ohshima, Phys. Rev. B: Condens. Matter Mater. Phys., 1998, 57, 4053–4062 CrossRef CAS.
- V. A. Spasov, Y. Shi and K. M. Ervin, Chem. Phys., 2000, 262, 75–91 CrossRef CAS.
- B. Palpant, B. Prével, J. Lérme, E. Cottancin, M. Pellarin, M. Treilleux, A. Perez, J. L. Vialle and M. Broyer, Phys. Rev. B: Condens. Matter Mater. Phys., 1998, 57, 1963–1970 CrossRef CAS.
- M. S. Liao, J. D. Watts and M. J. Huang, J. Phys. Chem. C, 2014, 118, 21911–21927 CAS.
- J. Wang, G. Wang and J. Zhao, Phys. Rev. B: Condens. Matter Mater. Phys., 2002, 66, 035418 CrossRef.
- X. B. Li, H. Y. Wang, X. D. Yang, Z.-H. Zhu and Y. J. Tang, J. Chem. Phys., 2007, 126, 084505 CrossRef PubMed.
- J. L. Jules and J. R. Lombardi, J. Phys. Chem. A, 2003, 107, 1268–1273 CrossRef CAS.
- R. F. W. Bader, Chem. Rev., 1991, 91, 893–928 CrossRef CAS.
- G. Henkelman, A. Arnaldsson and H. Jónsson, Comput. Mater. Sci., 2006, 36, 354–360 CrossRef.
- W. Tang, E. Sanville and G. Henkelman, J. Phys.: Condens. Matter, 2009, 21, 084204 CrossRef CAS PubMed.
- Y. Shi, J. K. Huang, L. Jin, Y. T. Hsu, S. F. Yu, L. J. Li and H. Y. Yang, Sci. Rep., 2013, 3, 1839 CrossRef PubMed.
- A. Lyalin and T. Taketsugu, J. Phys. Chem. C, 2009, 113, 12930–12934 CAS.
- B. Yoon, H. Häkkinen and U. Landman, J. Phys. Chem. A, 2003, 107, 4066–4071 CrossRef CAS.
- X. L. Ding, Z. Y. Li, J. L. Yang, J. G. Hou and Q. S. Zhu, J. Chem. Phys., 2004, 120, 9594–9600 CrossRef CAS PubMed.
| This journal is © The Royal Society of Chemistry 2017 |

