 Open Access Article
The selective response of a templated polymer for the cationic drug pentamidine: implications from molecular simulations and experimental data†
Monika Sobiech,
Piotr Luliński*,
Paweł Halik and
Dorota Maciejewska *
*
Department of Organic Chemistry, Faculty of Pharmacy, Medical University of Warsaw, Banacha 1, 02-097 Warsaw, Poland. E-mail: piotr.luliński@wum.edu.pl; dorota.maciejewska@wum.edu.pl
First published on 4th October 2017
Abstract
In this paper, we present an analysis of the surface modifications responsible for the selectivity of a new imprinted sorbent produced for the isolation of pentamidine cations. We examined the polymers formed from acrylic acid as the monomer, ethylene glycol dimethacrylate as the cross-linker and 4-methoxybenzamidine as the template. A molecular simulation showed the creation of the complex surface system joined with the protonation of the template molecule in a prepolymerization complex. Polymer cavity models enabled the adsorption process to be theoretically simulated, and the binding energies of the structurally related analytes were used as a measure of sorbent selectivity. An applicative analytical scheme for the determination of pentamidine in human urine was used to prove the utility of the templated polymer matrix. The analytical strategy involved separating the pentamidine through a molecularly imprinted solid phase extraction process and detecting it using high-performance liquid chromatography coupled with ultra-violet spectrophotometry. The experimental results demonstrated a good agreement with the theoretical evaluations.
Introduction
Pentamidine is an important anti-parasitic agent, and its potent activity in the treatment of Pneumocystis pneumonia in humans with debilitated immune systems remains a major source of scientific interest. Pentamidine is also used to treat leishmaniasis and trypanosomiasis, and has also been applied in the treatment of myotonic dystrophy. The mechanism of action of pentamidine relates to its interaction with the minor groove of nucleic acids rich in adenine–thymine bases; however, a detailed description of its action has not been completely evaluated. Moreover, its low bioavailability, together with serious side effects such as nephrotoxicity, hypotension and hypoglycaemia, constitute the risks of pentamidine therapy.1–3 In order to understand the processes underlying such serious health consequences for patients being treated with pentamidine, comprehensive pentamidine tests are necessary; however, the complexity of raw tissue sampling is hampering the development of satisfactory detection or quantification limits, even if advanced instrumental analysis is carried out. Thus, additional pretreatment steps are necessary to clean up the probe before analysis. Here, solid phase extraction (SPE) is the most common method for the isolation and enrichment of analytes.4,5 There are a few methods describing the use of SPE before pentamidine determination employing mercantile products.6,7 However, their applicability is low due to the insufficient selectivity of commercial sorbents and analytes in the complex sample. For example, total pentamidine recovery from rat urine was only 75 ± 2% after using SPE, and the linear concentration range of pentamidine during the analysis was as high as 144 to 1725 μg L−1. Among the promising alternatives for standard commercial sorbents are templated polymers produced by imprinting techniques, viz. molecularly imprinted polymers (MIPs).8 The high selectivity of MIP sorbents, which is due to the surface modification of the polymer matrix in the presence of the template, is a substantial advantage in, e.g., pharmacokinetic studies.9In-depth analysis of the imprinting process is required for the multicomponent prepolymerization system, in order to understand how effective MIPs are formed. Here, molecular modelling is used as a versatile tool to provide more knowledge about the factors responsible for modifications to the surface of templated polymers, as well as the factors governing surface interactions with analytes. In our previous papers,10–12 we discussed the imprinting process in detail, as well as the surface interactions of templated polymers with various analytes. The results, based on molecular modelling and the experimental characterization of the physicochemical parameters of MIPs, revealed that gaining a theoretical insight into the intermolecular interactions in the polymer cavity model facilitated an evaluation of the binding properties of MIPs. Furthermore, it showed that the theoretical binding energies of the analytes were a good measure of selectivity.
The number of papers related to the analysis of interactions between pentamidine and surface-imprinted polymers is extremely limited. Sellergren13,14 described the production of a molecularly imprinted stationary phase for the chromatographic resolution of pentamidine. Two polymers, the first of which was imprinted by pentamidine and the second by free-base benzamidine, were examined in order to enrich the pentamidine from the sample. The retention and elution of pentamidine by both sorbents varied strongly when changes were made to the mobile phase pH. Low retention at low pH (2) and poor recovery at a higher pH (5) were shown during the chromatographic procedure. It was suggested that the higher affinity sites were more acidic than the lower affinity, non-selective sites, proving the cation exchange retention mechanism. Nevertheless, the author did not provide the in-depth analytical characteristics of pentamidine determination using imprinted stationary phases, and SPE was only suggested in the conclusion as an attractive alternative to liquid–liquid extraction. The equilibrium between the binding capability and pentamidine recovery of MIPs still remains an interesting issue, and some valuable insight can be provided through theoretical analyses of the prepolymerization complexes between the neutral and protonated entities responsible for the imprinting and recognition processes.
Thus, we decided to work up a new imprinted sorbent for the separation of pentamidine and used it in an applicative analytical scheme for the determination of pentamidine in spiked human urine using high-performance liquid chromatography coupled with ultra violet detection (HPLC-UV). Herein, we described the fabrication of imprinted sorbents optimized using as the template a structural analogue of pentamidine, 4-methoxybenzamidine, T in the free base form, as well as five functional monomers. The optimal polymer was selected after the imprinting test. The present work documents the physicochemical properties of the sorbent and presents MISPE and the analytical procedures for the detection of pentamidine isethionate, A1. Advantageously, the proposed sorbent discriminated between structurally related analytes. Moreover, the efficacy of the imprinted polymer was much higher than the non-imprinted commercial sorbent MCX Oasis®. Theoretical simulations of the recognition process were used to analyse the monomer–template interactions and polymer surface selectivity.
Experimental
Materials
The template, T and the analytes 4,4′-(pentamethylenedioxy)-dibenzamidine bis(2-hydroxyethanesulfonate) (pentamidine isethionate, A1), benzamidine hydrochloride (A2) and 4-aminobenzamidine dihydrochloride (A3) were purchased from Sigma Aldrich (Steinheim, Germany), N,N-dimethylimidodicarbonimidic diamide hydrochloride (metformin, A6) was from Fluka (Laramie, WY, United States), while the analytes 4-methylbenzamidine hydrochloride (A4) and 4-nitrobenzamidine hydrochloride (A5) were from Santa Cruz Biotechnology (Heidelberg, Germany). The functional monomers acrylic acid (1) and 4-vinylbenzoic acid (3) were from Alfa Aesar (Karlsruhe, Germany), while the methacrylic acid (2), itaconic acid (4) and 4-vinylpyridine (5) were from Sigma-Aldrich (Steinheim, Germany). The cross-linker, ethylene glycol dimethacrylate (EGDMA), was from Sigma-Aldrich (Steinheim, Germany). The polymerization reaction initiator, 2,2′-azobisisobutyronitrile, was from Merck (Darmstadt, Germany). The solvents methanol, acetone and formic acid, as well as the salts, ammonium acetate and potassium dihydrogen phosphate, were from POCH (Gliwice, Poland). The acetonitrile (HPLC grade) was from POCH (Gliwice, Poland). The commercial ion-exchange sorbent MCX Oasis® was from Waters (Milford, MA, United States). The monomers were purified prior to use using standard procedures, and the other reagents were used without purification. Ultra-pure water delivered from a Milli-Q purification system (Millipore, France) was used to prepare the water solutions.Stock solutions
The stock solutions of the analysed compounds (T, A1–A6) were prepared by accurately weighing the appropriate amount of each compound and dissolving in methanol to obtain a concentration of 10 mmol L−1. The standard solutions were prepared prior to use by diluting the appropriate stock solutions with methanol–water (85![[thin space (1/6-em)]](https://www.rsc.org/images/entities/char_2009.gif) :
:![[thin space (1/6-em)]](https://www.rsc.org/images/entities/char_2009.gif) 15 v/v) to obtain the required concentrations. All stock solutions were stored in the dark at 8 °C.
15 v/v) to obtain the required concentrations. All stock solutions were stored in the dark at 8 °C.
Polymers
The MIPs, coded as MIP1–MIP5, were prepared using radical bulk polymerization. The non-imprinted polymers, NIP1–NIP5, were prepared under the same polymerization conditions but without the template molecule, and were treated in the same way as the corresponding MIPs. The experimental amounts of the reagents (moles, masses and volumes) used for the preparation of the different types of polymers are listed in Table 1. A brief description is given in ESI.†| Names of MIPs | Functional monomer (mg, mmol) | Porogen (μL) |
|---|---|---|
| MIP1 | Acrylic acid (1), 57.7, 0.8 | Methanol, 809 |
| MIP2 | Methacrylic acid (2), 68.9, 0.8 | Methanol, 822 |
| MIP3 | 4-Vinylbenzoic acid (3), 118.5, 0.8 | Methanol, 754 |
| MIP4 | Itaconic acid (4), 104.1, 0.8 | Methanol, 754 |
| MIP5 | 4-Vinylpyridine (5), 84.1, 0.8 | Methanol, 841 |
Instruments
The UV measurements were taken using a UV-1605PC spectrophotometer (Shimadzu, Germany). The calibration lines were constructed as a function of the peak area under the absorbance curve at λmax of each compound (y) versus concentration (x). Each point was measured in triplicate. The linearity of the calibration lines was good, with correlation coefficients r2 > 0.997. The wavelength, λmax, the limits of quantification (LOQ) (in μmol L−1) and the limits of detection (LOD) (in μmol L−1) were as follows: (T), 260, 0.80, 0.26; (A1), 266, 0.48, 0.16; (A2), 229, 2.79, 0.92; (A3), 308, 0.78, 0.30; (A4), 242, 1.14, 0.38; (A5), 253, 1.46, 0.48; (A6), 236, 1.44, 0.48.Reversed-phase high-performance liquid chromatography (RP-HPLC) was used to analyse A1 in the spiked human urine. The HPLC system consisted of a LC 20AT pump, a CTO 10A oven, a SPD-10A UV-Vis detector operated at λ = 270 nm and a Rheodyne 20 μL loop for injection. The chromatographic separation was performed using a Hypersil BDS C18 stainless steel column (150 mm × 4.6 mm ID, 5 μm, Thermo-Scientific, Waltham, MA, United States), preceded by a Bionacom® ultra filter column protector. The mobile phase consisted of a 20 mM aq. KH2PO4–acetonitrile–formic acid system (83![[thin space (1/6-em)]](https://www.rsc.org/images/entities/char_2009.gif) :
:![[thin space (1/6-em)]](https://www.rsc.org/images/entities/char_2009.gif) 16.9
16.9![[thin space (1/6-em)]](https://www.rsc.org/images/entities/char_2009.gif) :
:![[thin space (1/6-em)]](https://www.rsc.org/images/entities/char_2009.gif) 0.1 v/v/v), delivered at a flow rate of 1.0 mL min−1 at 40 °C. The run time was eight minutes, followed by four minutes of equilibration.
0.1 v/v/v), delivered at a flow rate of 1.0 mL min−1 at 40 °C. The run time was eight minutes, followed by four minutes of equilibration.
The scanning electron microscopy (SEM) analyses were performed at the Department of Chemistry, University of Warsaw, Poland. The surfaces of the imprinted and non-imprinted materials were studied using the Merlin FE-SEM (Zeiss, Oberkochen, Germany). The samples were Au/Pd sputter-coated before analysis.
The specific surface area, pore volume and particle size were determined using the adsorption isotherm of N2 at 77 K on ASAP 2420 (Micrometrics Inc., Norcross, GA, United States) at the Department of Chemistry, Maria Curie-Skłodowska University, Lublin, Poland.
Measurements of binding ability
Stationary binding experiments were performed to evaluate the ability of MIPs and NIPs to bind with T. Polypropylene tubes 10 mL in volume were filled with 10 mg of MIP1–MIP5 or NIP1–NIP5 particles. A volume of 5 mL of 10 μmol L−1 of T methanol–water (85![[thin space (1/6-em)]](https://www.rsc.org/images/entities/char_2009.gif) :
:![[thin space (1/6-em)]](https://www.rsc.org/images/entities/char_2009.gif) 15 v/v) standard solution was added to each tube. The tubes were sealed and oscillated by a shaker at room temperature for 24 hours. The tubes were then centrifuged for 10 minutes at 3000 rpm and the aliquots of supernatant (0.7 mL) were used to analyse the unbound amounts of each compound by UV spectroscopy using the calibration lines. The amounts of analyte bound to the polymer were calculated by subtracting the unbound amount from the initial amount. For the isotherm analysis, the polypropylene tubes were filled with 10 mg of MIP1 or NIP1 particles and 5 mL of different methanol–water (85
15 v/v) standard solution was added to each tube. The tubes were sealed and oscillated by a shaker at room temperature for 24 hours. The tubes were then centrifuged for 10 minutes at 3000 rpm and the aliquots of supernatant (0.7 mL) were used to analyse the unbound amounts of each compound by UV spectroscopy using the calibration lines. The amounts of analyte bound to the polymer were calculated by subtracting the unbound amount from the initial amount. For the isotherm analysis, the polypropylene tubes were filled with 10 mg of MIP1 or NIP1 particles and 5 mL of different methanol–water (85![[thin space (1/6-em)]](https://www.rsc.org/images/entities/char_2009.gif) :
:![[thin space (1/6-em)]](https://www.rsc.org/images/entities/char_2009.gif) 15 v/v) standard solutions containing T or A1 (concentrations ranging from 0.5–50 μmol L−1) were added. The tubes were then treated in the same manner as described above. All measurements were made in triplicate. On the basis of the binding measurements, the parameters characterizing the polymers, such as binding capacities, B (μmol g−1), distribution coefficients, KD (L g−1) and imprinting or affinity factors, IF/AFs, were computed according to eqn (1)–(3):
15 v/v) standard solutions containing T or A1 (concentrations ranging from 0.5–50 μmol L−1) were added. The tubes were then treated in the same manner as described above. All measurements were made in triplicate. On the basis of the binding measurements, the parameters characterizing the polymers, such as binding capacities, B (μmol g−1), distribution coefficients, KD (L g−1) and imprinting or affinity factors, IF/AFs, were computed according to eqn (1)–(3):
 | (1) |
 | (2) |
 | (3) |
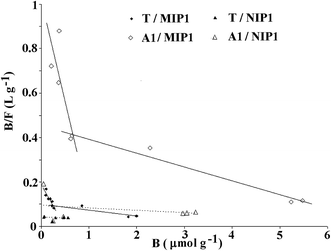
The adsorption isotherms for T and A1 on MIP1/NIP1 were characterized using the Langmuir model, transformed into Scatchard eqn (4):
 | (4) |
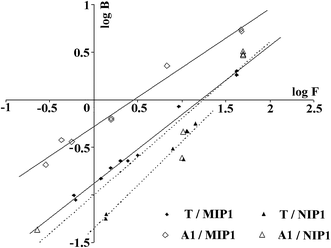
| B = aFm | (5) |
The B of compounds A1–A6 were performed on MIP1 or NIP1 particles in non-competitive binding experiments using the stationary procedure. The polypropylene tubes were filled with 10 mg of each particle and 5 mL of methanol–water (85![[thin space (1/6-em)]](https://www.rsc.org/images/entities/char_2009.gif) :
:![[thin space (1/6-em)]](https://www.rsc.org/images/entities/char_2009.gif) 15 v/v) standard solutions (at a concentration of 10 μmol L−1) of each compound A1–A6 was added. The tubes were sealed and oscillated by a shaker at room temperature for 24 hours. The tubes were then centrifuged for 10 minutes at 3000 rpm and the aliquots of supernatant (0.7 mL) were used to analyse the unbound amounts of each compound by UV spectroscopy using the calibration lines. The selectivity, α, was calculated according to eqn (6):
15 v/v) standard solutions (at a concentration of 10 μmol L−1) of each compound A1–A6 was added. The tubes were sealed and oscillated by a shaker at room temperature for 24 hours. The tubes were then centrifuged for 10 minutes at 3000 rpm and the aliquots of supernatant (0.7 mL) were used to analyse the unbound amounts of each compound by UV spectroscopy using the calibration lines. The selectivity, α, was calculated according to eqn (6):
 | (6) |
All experiments were performed in triplicate.
Description of the analytical procedures for A1
Details of the analytical protocols used to evaluate the properties of MIP1, such as the MISPE procedure of A1 from the standard solution, the characterization of the analytical performance and the analysis of A1 in spiked human urine, were described in ESI.†Steps of the theoretical simulation
The polymer matrix models were constructed from the functional monomer – 1, the acrylate anion (1a) and the cross-linker – EGDMA surrounding the template in either neutral form (T) or cationic form (Ta). In the affinity tests, the analytes T, A1–A6 were used.Modelling of prepolymerization complexes
In the first step, three-dimensional structures of T, Ta, 1, 1a, EGDMA, as well as compounds A1 to A6, were generated using the Discovery Studio 4.1 program distributed by Accelrys Software Inc.15 The geometries of all of the compounds were optimized using the density functional theory (DFT) with the B3LYP/6-311+G (d,p) hybrid functional, implemented in the Gaussian 09 program.16 The so-called ESP-atomic partial charges on the atoms were computed using the Breneman model,17 reproducing the molecular electrostatic potential.In the second step, four prepolymerization models of PC1, PC2a, PC3a and PC4a were created. To get the starting structure, one T molecule was surrounded by ten monomer molecules of 1. We used ten monomer molecules to find the possible alignments formed between the monomer and the template. The molecules were located randomly around the template and the intermolecular interactions were created during the energy optimization procedure. Next, four molecules of 1 were chosen, taking into account the molar ratio used in the synthetic procedure and the strongest interactions with the template. The first starting prepolymerization complex PC1 was built from one molecule of T and four neutral molecules of 1. The PC1 complex was then modified to construct the next three prepolymerization complexes PC2a, PC3a and PC4a. The T molecule was replaced by its cationic form Ta and one of the four monomer molecules of 1 (different in each complex) was replaced by its anionic form 1a (the fifth complex was not built because the last monomer molecule formed an interaction with the methoxy, and not with the amidine functional group of the template). The presented procedure simulated the possibility of salt creation between the template and the acidic monomer in the prepolymerization solution. Twenty molecules of cross-linker were added to each system to reflect the stoichiometry of the synthetic procedure to create the models of the prepolymerization complexes PC1, PC2a, PC3a and PC4a, as well as the cavities in the polymer matrix. As the polymerization and adsorption procedures get underway in the solvents, the effect of the solvation on the energy calculations was taken into account. The continuum model18 was used to evaluate the solvent effect, which treats the solvent as a uniform polarizable medium with a dielectric constant of εrij.19 The energy optimization of the reaction systems was performed using the dielectric constant value of methanol ε = 32.6rij. Methanol was selected for the cavity modelling because it was used as the porogen in the preparation of MIP1.
All the energy minimizations were made at the molecular mechanics (MM) level, with all energy gradients lower than 0.01 kcal mol−1 Å−1, using two algorithms: the steepest descent algorithm was applied with 100 steps, before the conjugate gradient algorithm was applied with 10![[thin space (1/6-em)]](https://www.rsc.org/images/entities/char_2009.gif) 000 steps. The MM simulations were carried out using the CHARMM force field,20 implemented in the Discovery Studio 4.1 software module.
000 steps. The MM simulations were carried out using the CHARMM force field,20 implemented in the Discovery Studio 4.1 software module.
Affinity simulation
The construction of the polymer cavities C1, C2a, C3a and C4a preceded the affinity analysis. The double bonds in the monomer and cross-linker molecules were replaced by single bonds in the prepolymerization complex structures (by adding hydrogen to carbon atoms). This operation approximated the formation of single C–C bonds during the polymerization. Next, a T or Ta molecule was removed from the complexes and the empty spaces were proposed as the computer models of the binding sites in the polymer matrix named C1, C2a, C3a and C4a. The cavities were used in the affinity analysis. The tested analytes T, A1–A6 were inserted one by one into the cavities, replacing the T or Ta molecule, and the energies of complexation were scrutinized together with the intermolecular interactions.While the interactions in the polymer cavities were being optimized, the constraints were set on the cross-linker and the monomers with force constants of 100 kcal mol−1 Å−2, in order to immobilize the 3D structures of the cavities. The analytes were left free, mimicking the adsorption step. The adsorption in the polymer matrix was analysed by applying the MM method, using the dielectric constant value of methanol–water 85![[thin space (1/6-em)]](https://www.rsc.org/images/entities/char_2009.gif) :
:![[thin space (1/6-em)]](https://www.rsc.org/images/entities/char_2009.gif) 15 v/v system ε = 36rij.21 This dielectric constant was used in the adsorption simulation because the methanol–water 85
15 v/v system ε = 36rij.21 This dielectric constant was used in the adsorption simulation because the methanol–water 85![[thin space (1/6-em)]](https://www.rsc.org/images/entities/char_2009.gif) :
:![[thin space (1/6-em)]](https://www.rsc.org/images/entities/char_2009.gif) 15 v/v system was also used in the binding experiments. The calculations of the binding energies, ΔEB, between the analyte and the polymer matrix were performed using eqn (7):
15 v/v system was also used in the binding experiments. The calculations of the binding energies, ΔEB, between the analyte and the polymer matrix were performed using eqn (7):
| ΔEB = Esystem − Eanalyte − Ecavity | (7) |
Results and discussion
Choice of effectively imprinted sorbent
To fabricate the sorbent dedicated to the analysis of A1, its structural analogue T was used as the template and five monomers 1–5 were tested. The choice of tested monomers was based on our previous studies and data from the literature.13 The stationary experiments were carried out using T in order to determine the IFs of the polymers MIP1–MIP5 and to select the optimal polymer (the polymer most suited to the MISPE procedure should be highly imprinted and should have high binding capacity). The B and KD values, as well as the IFs of MIP1–MIP5 and NIP1–NIP5 were calculated for T according to eqn (1)–(3); they are shown in Table 2.| No. of polymer | B ± S.D. (μmol g−1) | KD (L g−1) | IF | ||
|---|---|---|---|---|---|
| MIP | NIP | MIP | NIP | ||
| 1 | 1.12 ± 0.07 | 0.259 ± 0.002 | 0.131 | 0.025 | 5.21 |
| 2 | 1.47 ± 0.01 | 0.66 ± 0.02 | 0.220 | 0.079 | 2.77 |
| 3 | 1.20 ± 0.02 | 0.930 ± 0.004 | 0.119 | 0.087 | 1.36 |
| 4 | 0.401 ± 0.003 | 1.354 ± 0.008 | 0.034 | 0.138 | 0.25 |
| 5 | 0.073 ± 0.003 | 0.114 ± 0.001 | 0.007 | 0.011 | 0.64 |
As could be seen, the degree of imprinting differed significantly depending on the type of monomer. The highest IFs were noted for MIP1 (IF = 5.21) and MIP2 (IF = 2.77), which were prepared from 1 and 2, respectively. The results suggested that strong interactions between the amidine group and the carboxylic residues from 1 or 2 in the polymer matrix governed the imprinting process. The B of T on NIP1 and NIP2 possessed the opposite trend, decreasing the specificity of polymer MIP2; therefore, we selected polymer MIP1 prepared from 1 as the best candidate to separate the target analyte, A1. The imprinting process was very low in MIP3 and did not occur at all in MIP4 and MIP5. The imprinting process is governed by the intermolecular interaction between the template and the monomer. A lack of interaction was expected between the amidine group and the basis of functional monomer 5. It was expected that the interactions with the two acidic monomers 3 and 4 would be stronger; indeed, this was what was reflected by their higher capacities to bind with MIPs and NIPs. As a result of high non-specific adsorption, the IFs were below or close to one.
The adsorption of amidine compounds on the surface of MIP1
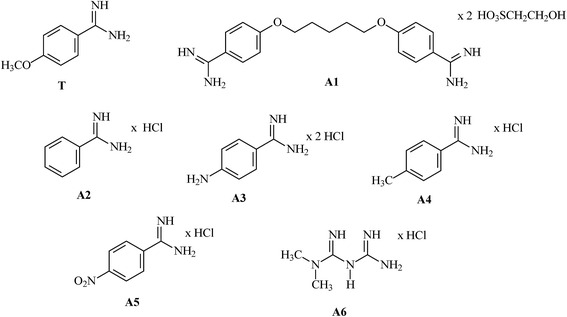
In order to evaluate the capability of MIP1 for the adsorption of amidine compounds, non-competitive stationary binding experiments were carried out with the group of compounds possessing amidine functionalities in their cationic forms: A1–A6. These compounds can compete with A1 for adsorption site. The chemical formulae of the analysed compounds A1–A6, as well as the template T, are presented in Fig. 1.The results of B for A1–A6, together with AFs, KD and α on MIP1, are presented in Table 3. The results for T are also presented for comparative purposes (marked with an asterisk).
| Compound | B ± S.D. of MIP1 (μmol g−1) | IF/AF | KD of MIP1 (L g−1) | α |
|---|---|---|---|---|
| T* | 1.12 ± 0.07 | 5.21 | 0.131 | — |
| A1 | 2.6 ± 0.2 | 8.02 | 0.521 | 3.977 |
| A2 | 1.29 ± 0.06 | 1.20 | 0.116 | 0.885 |
| A3 | 0.572 ± 0.005 | 1.20 | 0.058 | 0.443 |
| A4 | 0.66 ± 0.03 | 0.91 | 0.063 | 0.481 |
| A5 | 0.34 ± 0.01 | 1.23 | 0.038 | 0.290 |
| A6 | 0.749 ± 0.005 | 0.65 | 0.099 | 0.756 |
As could be seen, very similar binding capacities were noted for T and A2. The binding capacities of the remaining hydrochlorides (monobenzamidines A3–A5 and the non-benzamidine compound A6) decreased to nearly half of T (or even one third of T for A5). The AFs were most informative for the selectivity analysis. For the monobenzamidines A2–A5, AFs were close to one, and for A6 AF was even below one. This fact proved that the imprinted sites formed in the polymer matrix were not suitable for the adsorption of the template structural analogues A3–A6, and that only non-specific adsorption was responsible for the binding capacities of those compounds. In the case of A1, the B and AF values were very high (B = 2.6 μmol g−1; AF = 8.02). These values showed that the imprinted sites formed in the polymer were suitable for the adsorption of the cationic molecule of A1. This remarkable specificity observed for A1 (the calculation of α = 3.997) could be explained by the presence of two benzamidine systems in one molecule, which enabled the interactions with the polymer matrix regardless of the conformational changes.
The theoretical simulations of the adsorption cavities and the adsorption process can be very helpful in explaining the experimental values obtained in this part of the study.
Theoretical models of the imprinting procedure in MIP1
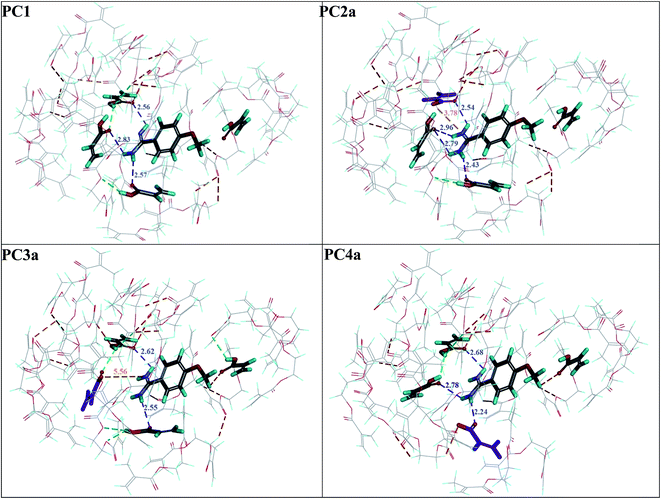
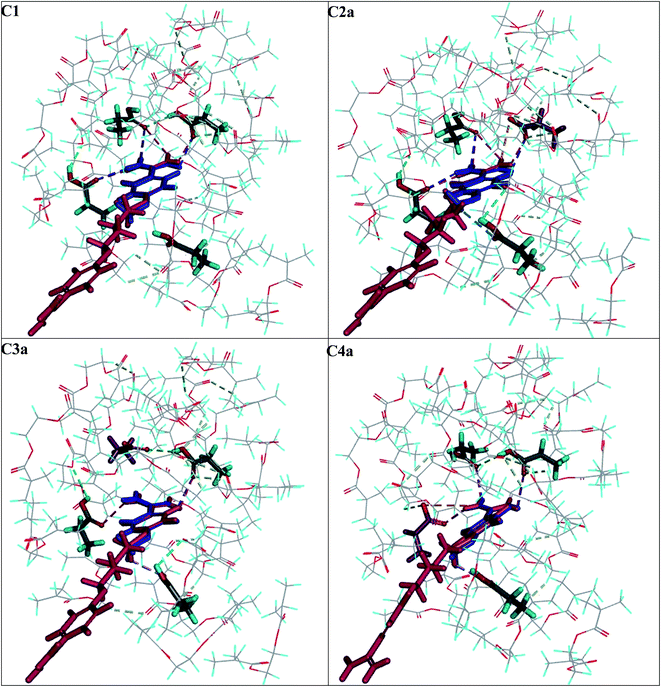
First, four models of the prepolymerization complexes PC1, PC2a, PC3a and PC4a were created between T or Ta as the templates and 1 or 1a as the functional monomers. A schematic view of these complexes is given in Fig. 2. We can observe that cationic Ta forms a different interaction pattern than neutral T, and that many hydrogen bond interactions are created in the prepolymerization complex of PC2a.Subsequently, four models of the cavities C1, C2a, C3a and C4a in MIP1 were created, and the theoretical ΔEB values between the analytes A1–A6 and the cavities were calculated to gain an insight into the affinity of MIP1 with various analytes. Fig. 3 presents four models of the polymer cavity using molecular electrostatic potential (MEP), which showed the distribution of MEP on the surface of the cavities. The surfaces of the cavities were coloured according to the distribution of MEP generated by the contributing monomer and cross-linker molecules. Negative MEP values are shown in red-yellow and neutral MEP values in light green-blue, whereas positive MEP values are shown in blue. Neutral potential was observed inside the cavity C1 and negative potential inside the cavities C2a–C4a in the proximity of O atoms in 1a. The position of the most negative potential differed across cavities C2a–C4a according to the position of 1a. Positive potential was observed in the proximity of the H atom in the COOH group of 1, near to the entrance of all of the cavity models and at the walls of cavities C1–C4a, formed by cross-linker molecules. Replacing 1 with 1a changed the MEP in the whole of cavities C2a–C4a, and created larger negative regions in the polymer cavities C2a–C4a than it did in C1. One can suppose that the adsorption of cationic analytes will be preferred in such sites.
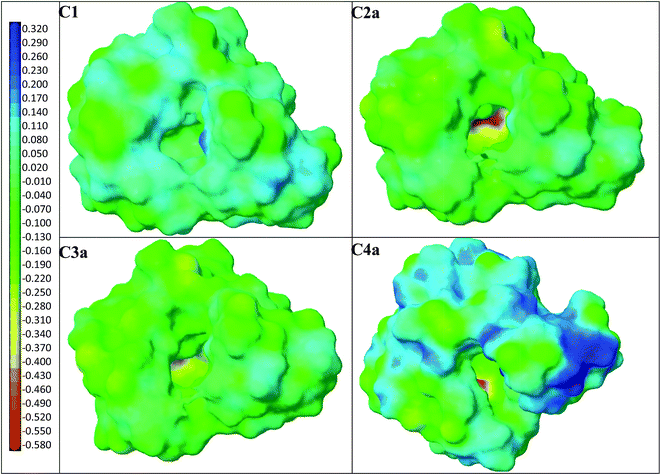 | ||
| Fig. 3 Models of polymer cavities C1–C4a: the surfaces are coloured according to MEP. Negative values are shown in red-yellow, neutral values in light blue-green and positive values in blue. | ||
Theoretical explanations of MIP1's affinity with A1
In order to elucidate the high polymer affinity with A1 and the way that pentamidine cation interacts with the MIP1 polymer matrix, we compared the ΔEB of T and the target analyte, A1 inside the polymer cavities C1–C4a (the values are shown in Table 4). The strongest interaction with MIP was predicted for A1 in all models (the ΔEB values ranged from −35.51 to −33.78 kcal mol−1, depending on the model). The weakest interaction was observed in the C1 cavity because of its neutral MEP. The ΔEB absolute values for T were not so high, ranging from −31.19 to −27.14 kcal mol−1. The strongest interaction was observed between T and C1. The experimental AF was higher for A1 than IF for T, which could be proof that the cationic form of T also participates in the imprinting process.| Compound | IF/AF | ΔEB (kcal mol−1) | |||
|---|---|---|---|---|---|
| C1 | C2a | C3a | C4a | ||
| T | 5.21 | −31.19 | −29.57 | −28.25 | −27.14 |
| A1 | 8.02 | −33.77 | −35.51 | −34.06 | −35.35 |
| A2 | 1.20 | −24.89 | −23.78 | −24.24 | −22.52 |
| A3 | 1.20 | −28.94 | −28.47 | −24.97 | −24.50 |
| A4 | 0.91 | −27.82 | −28.41 | −27.06 | −25.67 |
| A5 | 1.23 | −24.33 | −26.24 | −26.24 | −23.50 |
| A6 | 0.65 | −9.22 | −7.64 | −14.90 | −10.12 |
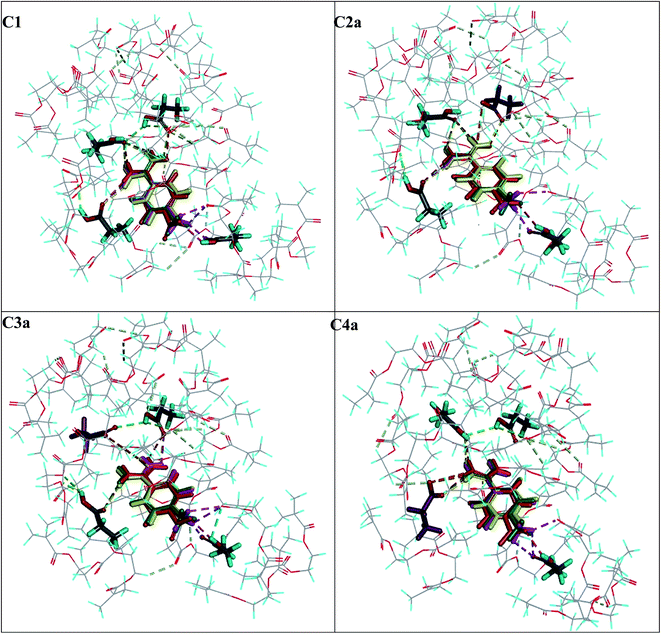
Next, we compared the intermolecular interactions in the polymer cavities for both molecules T and A1. Fig. 4 illustrates the location of T and A1 inside cavities C1, C2a, C3a and C4a at the end of the adsorption process. The hydrogen bonds and electrostatic interactions were presented as dashed lines. The MEP was presented on the cavity surface in Fig. 3, and on the surfaces of T and A1 in Fig. 5. Both molecules T and A1 had different electrostatic potentials. We observed negative or neutral MEPs on the surface of T, whereas on the surface of A1, we noted a mainly positive MEP. The distribution of MEP on T and A1 molecules explained the stronger interaction between A1 and polymer cavities C1, C2a, C3a and C4a than between T and these cavities. Both molecules T and A1 were located in similar positions in the polymer cavities during the adsorption process (Fig. 4), but formed different patterns of relatively strong hydrogen bond networks with the H atoms of the amidino/amidinium groups, with lengths ranging from 2.18 to 2.92 Å. Compound T formed one hydrogen bond in C3a or three hydrogen bonds in C1, C2a and C4a, while A1 formed two hydrogen bonds in C3a, three in cavity C4a or four in cavities C1 and C2a via the amidinium group. The H atoms from the OCH3 group of T or from the CH2 group located next to the O atom in A1 were the additional anchorage points in C2a (but only for T), C3a and C4a. These H atoms formed non-classical hydrogen bonds with the O atom of the monomer, ranging from 2.58 to 3.08 Å in length. Additionally, A1 created an electrostatic interaction with 1a in C2a and C4a, ranging from 3.60 to 4.26 Å in length, respectively. In the C3a model, the localization of the 1a did not support the formation of an electrostatic interaction.
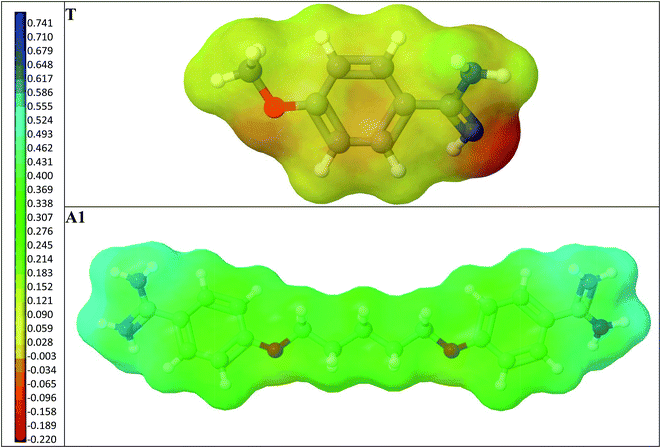 | ||
| Fig. 5 A view of the T and A1 molecules. The surfaces are coloured according to MEP. The negative values are shown in red-orange, the neutral values in yellow and the positive values in green-blue. | ||
More interactions were produced by the A1 than the T molecule during simulations of the adsorption process in different cavity models, which explained the high AF values. The highest absolute value of ΔEB and the many interactions predicted during the simulation of the A1 adsorption process in C2a enabled us to suppose that these cavities were produced during the imprinting process of the template using acrylic salt.
Theoretical explanations of the diversity of MIP1's affinity with analytes
Four models of cavities C1, C2a, C3a and C4a were used to analyse the adsorption complexes of five compounds A2–A6, which were tested as hydrochlorides. The binding energies were calculated according to eqn (6) and their values are summarized in Table 4, together with the experimental AFs. The hydrogen bond networks for analytes A2–A6 are presented in Fig. 6. The highest absolute ΔEB value with C1–C4a was predicted for the target analyte A1, which was consistent with the highest experimental AF = 8.02 and B = 2.6 ± 0.2 μmol g−1. The ΔEB values obtained for A2–A5 in cavities C1–C4a were quite similar, ranging from −28.94 to −22.52 kcal mol−1. Those results correlated to the experimental AF values, which were computed as being near one (ranging between 0.91 and 1.23) with very small differences between particular analytes. This could mean that they were bound non-specifically to the MIP1 and NIP1 matrices, and we could see that all analytes A2–A5 were located in quite similar positions in the particular cavity model at the end of the adsorption simulation process (Fig. 6). Moreover, A2–A5 created the same types and numbers of interaction using the cationic amidinium group. Differences in the interactions of the analytes with particular cavities were related to the presence of different functional groups in the para positon of the aromatic ring. The absolute ΔEB values for A6 were much lower (−14.90 to −7.64 kcal mol−1), which was due to the lack of aromatic ring. This could suggest that bulk aromatic rings facilitate interactions with the cavities, and that it was not only electrostatic interactions that were responsible for the recognition process in the polymer matrix. The fact that A6 has the lowest binding energy is very well correlated with the lowest AF value, equal to 0.65, which suggests that the proposed C2a type cavities were present in MIP1.Characteristics of adsorption on the surface of MIP1
The binding capabilities of T and A1 were measured at various concentrations and the adsorption parameters of MIP1 were determined in order to characterize the polymer adsorption properties. The measurements for NIP1 were made for comparative purposes.First, the binding properties of the imprinted materials were characterized using the Langmuir model, transformed to the Scatchard eqn (4). The binding isotherms were determined by adding a fixed amount of the polymer to various concentrations of T or A1. The Scatchard plots for MIP1 and NIP1 for both compounds are presented in Fig. 7. The detailed data for T and A1 are given in Table 5. The adsorption of both compounds T and A1 was characterized by a similar pattern, and the Scatchard plots revealed two straight lines for MIP1 and only one for NIP1. These results are typical for a pair of MIPs and NIPs obtained through a non-covalent approach. However, the calculated values of the association constants (Kas), dissociation constants (Kds) and maximum binding capacities (Bmaxs) were significantly different (Table 5). The Kas and Bmaxs values were higher for A1.
| Parameters | T | A1 | ||
|---|---|---|---|---|
| MIP1 | NIP1 | MIP1 | NIP1 | |
| Ka1 (L μmol−1) | 0.385 | 0.0020 | 0.914 | 0.0113 |
| Ka2 (L μmol−1) | 0.0262 | 0.0590 | ||
| Kd1 (μmol L−1) | 2.60 | 500 | 1.10 | 88.5 |
| Kd2 (μmol L−1) | 38.2 | 16.9 | ||
| Bmax1 (μmol g−1) | 0.49 | 19.5 | 1.11 | 8.24 |
| Bmax2 (μmol g−1) | 3.78 | 7.43 | ||
| m | 0.73 | 0.91 | 0.62 | 0.81 |
Next, the Freundlich model was employed to analyse the heterogeneity of the MIP1 and NIP1 binding sites. This model fits well with the polymer adsorption data in low concentration regions. The Freundlich plots of T and A1 adsorption are presented in Fig. 8, while the m of MIP1 and NIP1 are presented in Table 5. The straight lines of log![[thin space (1/6-em)]](https://www.rsc.org/images/entities/char_2009.gif) B versus log
B versus log![[thin space (1/6-em)]](https://www.rsc.org/images/entities/char_2009.gif) F served as evidence that the adsorption of the template molecule, as well as that of the target analyte, could be described by the Freundlich eqn (5). The m values, which was considerably lower than one, served as evidence that MIP1 possessed a heterogeneous population of binding sites with the ability to interact with both molecules T and A1.
F served as evidence that the adsorption of the template molecule, as well as that of the target analyte, could be described by the Freundlich eqn (5). The m values, which was considerably lower than one, served as evidence that MIP1 possessed a heterogeneous population of binding sites with the ability to interact with both molecules T and A1.
The surface characterization of MIP1
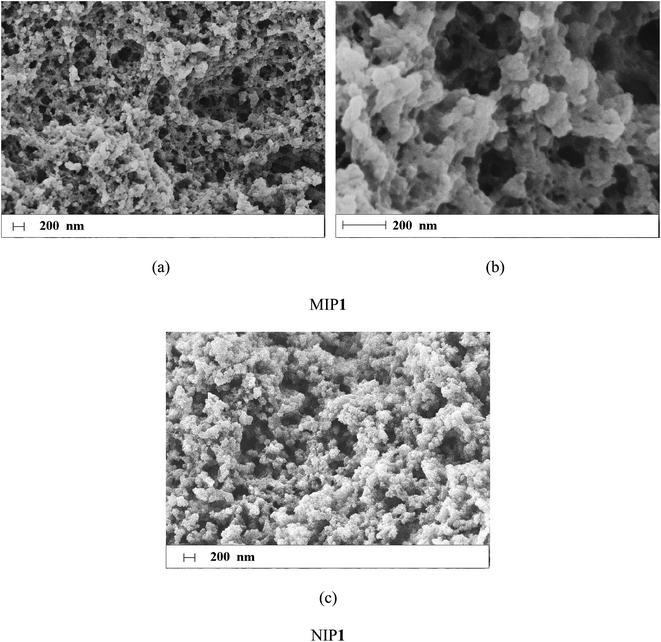
The morphology of MIP1 particles was analysed using SEM as well as specific surface area, in order to characterize the surface of the polymers. Measurements for NIP1 were taken for comparative purposes.The SEM micrographs are shown in Fig. 9. The polymer particles were irregular in shape and size with diameters ranging between 20 and 40 μm, which is typical of polymers produced by grinding the polymer monolith. Higher magnification showed differences between the morphology of MIP1 and NIP1 particles. The surface of MIP1 (Fig. 9a and b) was more extended than the surface of NIP1 (Fig. 9c), with a higher number of cavities (>200 nm) and pores of diameters above 100 nm.
The specific surface area is an important parameter related to the efficiency of the imprinting process. The Brunauer–Emmett–Teller (BET) isotherms of N2 at 77 K were measured for both MIP1 and NIP1 to determine the specific surface area. The isotherms revealed that MIP1 had a higher adsorption capacity compared to NIP1. Both materials exhibited adsorption hysteresis (Fig. 10). This phenomenon has often been observed for porous materials with three-dimensional disordered networks and has been attributed to the differing geometry of the liquid–gas interface during adsorption and desorption (the “ink-bottle” effect).22,23
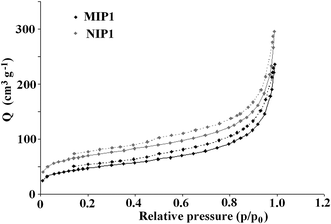 | ||
| Fig. 10 The hysteresis of the adsorption (solid line) and desorption (dashed line) of nitrogen on MIP1/NIP1. | ||
The Barrett–Joyner–Halenda and Harkins–Jura models were employed to analyse pore volume and size. The specific surface area of the MIP1 particles was lower than that of the NIP1 ones, with respective values of 163.7 and 240.2 m2 g−1. The pore volumes and average pore diameters were 0.36 cm3 g−1 and 86.8 Å for MIP1 and 0.46 cm3 g−1 and 75.0 Å for NIP1. The micropore volume and area were 0.012 cm3 g−1 and 0.028 m2 g−1, and 27.9 cm3 g−1 and 63.1 m2 g−1 for MIP1 and NIP1, respectively. To sum up, the negligible differences in the surface morphologies of MIP1 and NIP1 were linked with distinct variations in their specific surface areas, pore volumes and average pore diameters. The high non-specific adsorption of analytes A2–A6 on NIP1 can be explained by its high pore volume and area.
The applicative value of MIP1 surface properties
In order to explore the properties of MIP1 defined during the above studies, this research has used the analytical scheme for the determination of A1, which involves the separation step using MISPE with MIP1 as the sorbent and determination using the HPLC-UV system.Thus, a new protocol for the MISPE of A1 on MIP1 was proposed (it was optimized using the standard solution of A1). The loading and washing steps were carried out according to previously optimized MISPE protocols for the hydrochlorides of biogenic amines.24 However, the elution step with the ammonium acetate–methanol system was insufficient to quantitatively desorb the analyte. Thus, a formic acid–methanol (0.5![[thin space (1/6-em)]](https://www.rsc.org/images/entities/char_2009.gif) :
:![[thin space (1/6-em)]](https://www.rsc.org/images/entities/char_2009.gif) 99.5 v/v) system was used as the eluent. Systems containing small amounts of formic acid have been successfully used as the mobile phases in the chromatographic resolution of pentamidine.7 The proposed MISPE protocol for the separation of pentamidine on MIP1 is presented in Table S1.†
99.5 v/v) system was used as the eluent. Systems containing small amounts of formic acid have been successfully used as the mobile phases in the chromatographic resolution of pentamidine.7 The proposed MISPE protocol for the separation of pentamidine on MIP1 is presented in Table S1.†
As could be seen, pentamidine recovery after its extraction on MIP1, expressed as the percentage of adsorbed pentamidine, was very high and equal to 98.5 ± 6.7%, which also revealed the sorbent's capability for five-fold enrichment (from the standard solution).
Human urine was selected as the complex sample with which to prove the applicability of the analytical scheme, because the known methods6,7 are characterized by insufficient quantification limits and unsatisfactory total recoveries of A1 from urine samples.
The exemplary chromatogram of neat human urine diluted with ultra-pure water (5![[thin space (1/6-em)]](https://www.rsc.org/images/entities/char_2009.gif) :
:![[thin space (1/6-em)]](https://www.rsc.org/images/entities/char_2009.gif) 95 v/v) is presented in Fig. S1.† Several peaks are visible on the chromatogram, confirming its complexity. The presented procedure enabled the application of the human urine sample, which was only diluted with ultra-pure water due to the high purity of the obtained eluates. One peak (tr = 6.75 min) is presented on the exemplary chromatogram of elution fractions, which was identified (based on the standard) as pentamidine (Fig. S1b†). It was proven that the proposed analytical scheme enabled us to wash out all of the unnecessary components from the sorbent before carrying out the elution step, i.e., that MIP1 did not adsorb the components of the urine.
95 v/v) is presented in Fig. S1.† Several peaks are visible on the chromatogram, confirming its complexity. The presented procedure enabled the application of the human urine sample, which was only diluted with ultra-pure water due to the high purity of the obtained eluates. One peak (tr = 6.75 min) is presented on the exemplary chromatogram of elution fractions, which was identified (based on the standard) as pentamidine (Fig. S1b†). It was proven that the proposed analytical scheme enabled us to wash out all of the unnecessary components from the sorbent before carrying out the elution step, i.e., that MIP1 did not adsorb the components of the urine.
Parameters such as linearity, LOQ, LOD and recovery were defined for A1 in human urine spiked with the standard solutions of A1, in order to characterize the new analytical scheme for A1 determination. A calibration line was established for A1 to cover a low concentration range from between 0.5 and 10 μmol L−1. The linearity of the calibration line, y = 9![[thin space (1/6-em)]](https://www.rsc.org/images/entities/char_2009.gif) 347
347![[thin space (1/6-em)]](https://www.rsc.org/images/entities/char_2009.gif) 951x − 355, was good with a regression coefficient of r2 = 0.9910. The LOD for A1 was 0.247 μmol L−1 (84 μg L−1) and the LOQ for A1 was 0.747 μmol L−1 (254 μg L−1). The total recoveries of A1 after applying the above analytical scheme were equal to 99 ± 15% (n = 5).
951x − 355, was good with a regression coefficient of r2 = 0.9910. The LOD for A1 was 0.247 μmol L−1 (84 μg L−1) and the LOQ for A1 was 0.747 μmol L−1 (254 μg L−1). The total recoveries of A1 after applying the above analytical scheme were equal to 99 ± 15% (n = 5).
The above-proposed analytical scheme was also carried out on the commercial ion-exchange sorbent MCX Oasis®. The total recovery of pentamidine from the spiked human urine was equal to 24.3 ± 4.4%, proving the superiority of the new analytical scheme.
Conclusions
A theoretical study of monomer-template-cross-linker interactions and the impact of polymerization on the structure of the binding sites provided the means to understand the properties of T-imprinted sorbent fabricated with 1 and EGDMA as the sorbent to A1. Theoretical simulations of the cavities suggest that the template T can form acrylate salt in the prepolymerization solution, and that the different types of cavities (formed by either neutral or cationic forms of T) can be responsible for the adsorption process in the polymer matrix. This explains the high adsorption levels of cationic A1. The resulting sorbent can clean up the urine samples spiked with A1 to a level that allows it to be determined. The new MISPE procedure allowed 99 ± 15% of A1 to be recovered from spiked human urine on the original imprinted material included in the analytical scheme, which involved determination using the HPLC-UV system. Moreover, the fabricated sorbent discriminated between structurally related analytes and was more selective than the commercial ion-exchange sorbent MCX Oasis®, which had a total recovery percentage of only 24.3 ± 4.4%.Author contributions
The manuscript was written through contributions of all authors. All authors have given approval to the final version of the manuscript.Conflicts of interest
The authors declare no competing financial interest.Acknowledgements
The results presented in this work were supported by the grant FW24/NM2/2015 provided by the Medical University of Warsaw, Poland. The results presented in this work were obtained using resources of Interdisciplinary Center for Mathematical and Computational Modeling (ICM) University of Warsaw (G68-2).References
- M. Sands, M. A. Kron and R. B. Brown, Clin. Infect. Dis., 1985, 7, 625 CrossRef CAS.
- N. M. Oliveira, F. A. Yamauti Ferreira, R. Y. Yonamine and E. Z. Chehter, Einstein, 2014, 12, 112 CrossRef PubMed.
- R. Diri, F. Anwer, A. Yeager, R. Krishnadasan and A. McBride, Transplant Infect. Dis., 2016, 18, 63 CrossRef CAS PubMed.
- A. Andrade-Eiroa, M. Canle, V. Leroy-Cancellieri and V. Cerda, Trends Anal. Chem., 2016, 80, 641 CrossRef CAS.
- A. Andrade-Eiroa, M. Canle, V. Leroy-Cancellieri and V. Cerda, Trends Anal. Chem., 2016, 80, 655 CrossRef CAS.
- S. Hambye, D. Stanicki, J.-M. Colet, E. M. Aliouat, J.-J. Vanden Eynde and B. Blankert, Talanta, 2011, 83, 832 CrossRef CAS PubMed.
- S. Hambye, M. Helvenstein, L. Verdy, Z. Kahvecioglu, R. Conotte, J.-J. Vanden Eynde, J.-M. Colet and B. Blankert, J. Pharm. Biomed. Anal., 2014, 95, 54 CrossRef CAS PubMed.
- C. Alvarez-Lorenzo and C. Concheiro, Handbook of Molecularly Imprinted Polymers, Smithers Rapra Technology, Shawbury, United Kingdom, 2013 Search PubMed.
- M. Szultka, R. Krzeminski, J. Walczak, M. Jackowski and B. Buszewski, Biomed. Chromatogr., 2014, 28, 255 CrossRef CAS PubMed.
- T. Żołek, P. Luliński and D. Maciejewska, Anal. Chim. Acta, 2011, 693, 121 CrossRef PubMed.
- P. Luliński, M. Sobiech, T. Żołek and D. Maciejewska, Talanta, 2014, 129, 155 CrossRef PubMed.
- M. Sobiech, T. Żołek, P. Luliński and D. Maciejewska, Talanta, 2016, 146, 556 CrossRef CAS PubMed.
- B. Sellergren, Anal. Chem., 1994, 66, 1578 CrossRef CAS.
- K. Nilsson, J. Lindell, O. Norrlow and B. Sellergren, J. Chromatogr. A, 1994, 680, 57 CrossRef CAS.
- Accelrys Software Inc., Discovery Studio Modeling Environment, Release 4.1, Accelrys Software Inc., San Diego, 2013 Search PubMed.
- M. J. Frish, G. W. Trucks, H. B. Schlegel, G. E. Scuseria, M. A. Robb, J. R. Cheeseman, V. G. Zakrzewski, J. A. J. Montgomery, R. E. Stratmann, J. C. Burant, S. Dapprich, J. M. Millam, A. D. Daniels, K. N. Kudin, M. C. Strain, O. Farkas, J. Tomasi, V. Barone, M. Cossi, R. Cammi, B. Mennucci, C. Pomelli, C. Adamo, S. Clifford, J. Ochterski, G. A. Petersson, P. Y. Ayala, Q. Cui, K. Morokuma, D. K. Malick, A. D. Rabuck, K. Raghavachari, J. B. Foresman, J. Cioslowski, J. V. Ortiz, A. G. Baboul, B. B. Stefanov, G. Liu, A. Liashenko, P. Piskorz, I. Komaromi, R. Gomperts, R. L. Martin, D. J. Fox, T. Keith, M. A. Al-Laham, C. Y. Peng, A. Nanayakkara, C. Gonzalez, M. P. Challacombe, P. M. W. Gill, B. Johnson, W. Chen, M. W. Wong, J. L. Andres, C. Gonzalez, M. Head-Gordon, E. S. Replogle and J. A. Pople, Gaussian 09, Gaussian Inc., Pittsburgh, PA, 2009 Search PubMed.
- C. M. Breneman and K. B. Wiberg, J. Comput. Chem., 1990, 11, 361 CrossRef CAS.
- B. Roux and T. Simonson, Biophys. Chem., 1999, 78, 1 CrossRef CAS PubMed.
- M. Cossi, V. Barone, R. Cammi and J. Tomasi, J. Phys. Chem. Lett., 1990, 255, 327 CrossRef.
- B. R. Brooks, C. L. Brooks III, A. D. Mackerell Jr, L. Nilsson, R. J. Petrella, B. Roux, Y. Won, G. Archontis, C. Bartels, S. Boresch, A. Caflisch, L. Caves, Q. Cui, A. R. Dinner, M. Feig, S. Fischer, J. Gao, J. M. Hodoscek, W. Im, K. Kuczera, T. Lazaridis, J. Ma, V. Ovchinnikov, E. Paci, R. W. Pastor, C. B. Post, J. Z. Pu, M. Schaefer, B. Tidor, R. M. Venable, H. L. Woodcock, X. Wu, W. Yang, D. M. York and M. Karplus, J. Comput. Chem., 2009, 30, 1545 CrossRef CAS PubMed.
- B. Kvamme, Phys. Chem. Chem. Phys., 2002, 4, 942 RSC.
- L. H. Cohan, J. Am. Chem. Soc., 1938, 60, 433 CrossRef CAS.
- P. I. Ravikovitch and A. V. Neimark, Langmuir, 2002, 18, 9830 CrossRef CAS.
- P. Luliński, M. Dana and D. Maciejewska, Talanta, 2014, 119, 623 CrossRef PubMed.
Footnote |
| † Electronic supplementary information (ESI) available. See DOI: 10.1039/c7ra07590a |
| This journal is © The Royal Society of Chemistry 2017 |

