 Open Access Article
Unravelling diversity and metabolic potential of microbial consortia at each stage of leather sewage treatment†
Hebin Liangab,
Dongdong Yeab and
Lixin Luo *ab
*ab
aSchool of Bioscience and Bioengineering, South China University of Technology, Guangzhou, 510006, China. E-mail: btlxluo@scut.edu.cn; Fax: +86-20-39380601; Tel: +86-20-39380628
bGuangdong Provincial Key Laboratory of Fermentation and Enzyme Engineering, South China University of Technology, Guangzhou 510006, China
First published on 25th August 2017
Abstract
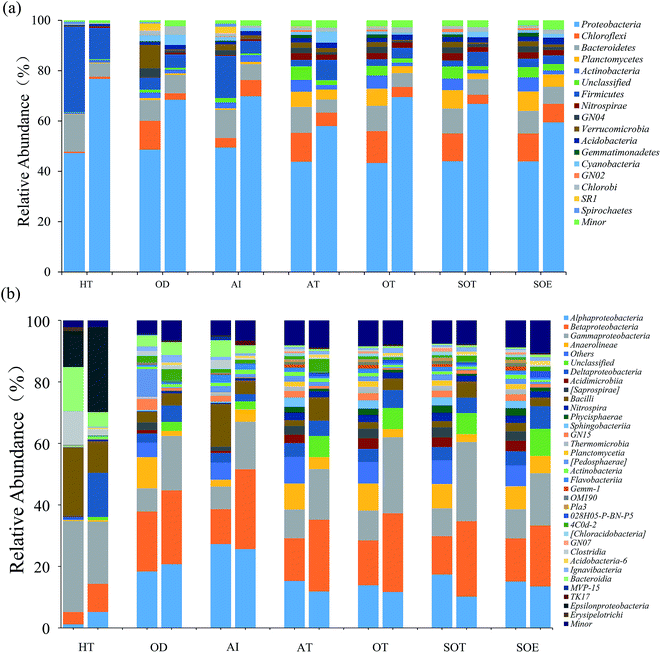
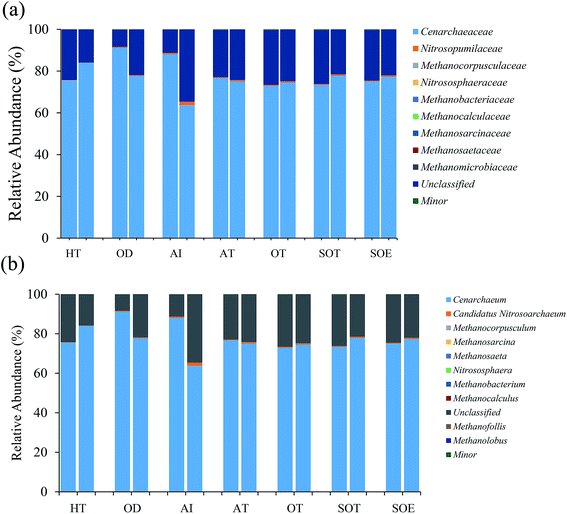
Activated sludge is essential for the biological wastewater treatment process and the identification of active microbes enlarges awareness of their ecological functions in this system. Microbial communities and their active members were investigated in activated sludge from a leather sewage treatment plant by a combined approach targeting both 16S rRNA and 16S rRNA genes. Although active bacteria obtained by RNA analysis exhibit similar diversity with DNA-based populations, the distribution of microbes significantly differed between the total and active communities. Several active taxa showed low abundance or even absence in the DNA-derived community. Moreover, microbial consortia, particularly bacterial communities, distinctly distributed at a particular treatment stage and both the total and active bacterial communities displayed high environmental sensitivity. Distributions of archaeal communities remained stable and the overrepresentations of active Cenarchaeaceae and Nitrosopumilaceae were potentially associated with ammonia oxidation across the treatment process. Furthermore, bacteria quantitatively dominate the microbial community in activated sludge and the 16S rRNA![[thin space (1/6-em)]](https://www.rsc.org/images/entities/char_2009.gif) :
:![[thin space (1/6-em)]](https://www.rsc.org/images/entities/char_2009.gif) 16S rRNA gene ratios of bacteria were positively correlated with the removal of contaminants. The results indicate that both dominant and low-abundance taxa with high potential activity play pivotal roles in removal of contaminants within sewage.
16S rRNA gene ratios of bacteria were positively correlated with the removal of contaminants. The results indicate that both dominant and low-abundance taxa with high potential activity play pivotal roles in removal of contaminants within sewage.
1. Introduction
In recent years, people around the world have increasingly focused on researching wastewater treatment. Wastewater, particularly industrial wastewater, leads to the decline of water quantity and quality and the leather industry is one of the most polluting industries in terms of the volume and the complexity of treatment of its effluents discharge.1 Leather wastewater is considered as a severe pollutant source for the environment due to its high concentration of inorganic/organic matters, nitrogenous compounds, color content, variable pH together with total suspended solids.2,3 Excess unqualified tannery wastewater can cause many deleterious effects, including the deterioration of ecological equilibrium.3 Therefore, an efficient treatment before its discharge is essential for reducing the detrimental effects to the water environment.Biological wastewater treatments are the most extensive pathway for wastewater treatment due to their low operational cost and high efficiency for contaminants removal.4 Activated sludge was composed of complex microbial consortia including bacteria, archaea, eukaryotes as well as viruses, in which bacteria are most dominant and play essential roles in biological treatment process.5 Hence, detailed information on microbial communities and their interactions may provide new sights into the control of biological treatment process and will help in improvement of removal efficiency. Currently, high-throughput sequencing has been widely applied to analyze DNA-based microbial diversity and abundance in various samples, such as soil,6 marine sediment7 and activated sludge.8 However, DNA associated with dead cells or the extent to residual “naked DNA” from cell lysis may mislead our acquaintances on microbial diversity and function in the environment.9 Moreover, dormant microorganisms with a low metabolic state might also dissemble changes in the active microbes with important ecosystem function.10 Although dormant cells can contain measurable numbers of ribosomes,11 rRNA transcripts, compared to rRNA genes, would be more reliable in detection of active state within a given consortia12 due to its higher concentration in active cells, since rRNA is a critical component of ribosomes which is essential to protein synthesis of growing cell.
Previous studies have assessed the total and active microbial communities in forest soil,13 salt marsh sediments,10 membrane bioreactor14 and anaerobic digestion of pig slurry15 by analysis of 16S rRNA gene and 16S rRNA, which further detected the active microbial community. However, most of the descriptive studies relies on sequence analysis targeting the 16S rRNA genes within activated sludge, which provides information regarding the total community of microbes (including active, dead and dormant individuals).7,8,16 Nevertheless, still comparatively little is known about the dormant and active microbial communities at each stage of an integrated tannery wastewater treatment process and their responses to physicochemical parameters. Hence, the combination of investigation via DNA and RNA-based detection on microbial community may help us distinguish potentially active microbial cells from dead cells in treatment process and provide insights into the response of microbial communities, especially the active taxa with ecosystem function.
With the aid of high-throughput sequencing method, diversity and dynamics of microbial communities at each step in an integrated treatment process were well studied by DNA and RNA-based methods. Additionally, the abundances of total and potentially active populations of bacteria and archaea were appraised by means of qPCR and reverse transcription qPCR (RT-qPCR) targeting the 16S rRNA gene sequence. Multivariate analyses were performed to appraise the microbial dormancy and potential activity in the process and their responses to environmental conditions.
2. Material and methods
2.1. Samples collection
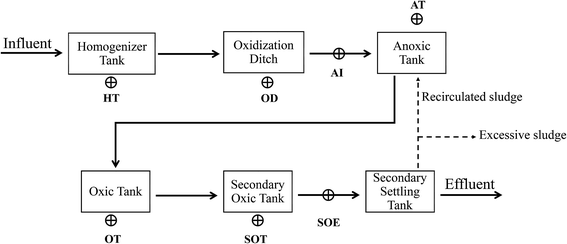
Mixed-liquor samples were taken from the homogeneous tank (HT), oxidation ditch (OD), influent of anoxic tank (AI), oxic tank (OT), secondary oxic tank (SOT) and effluent of secondary oxic tank (SOE) of a full-scale industrial sewage treatment plant in Shangqiu City, Henan Province, China (34°25′N 115°39′E) which treats tannery wastewater (Fig. 1). This plant is designed to remove ammonium and inorganic/organic matter with the combination of oxidation ditch and anoxic/oxic/oxic (A/O/O) process. Three subsamples were collected and combined at each treatment step. Then, the samples were immediately delivered to the laboratory in ice box and stored in a −20 °C refrigerator for further usage.2.2. Chemical analyses
For each sampling site, physicochemical characteristics and operational parameters were determined (Table 1). pH was measured in suit using STARTER 300 pH meter (Ohaus, USA). Chemical oxygen demand (COD) and total ammonium nitrogen were measured by the potassium dichromate method and Nessler's reagent spectrophotometry, respectively. Details of measurement and calculation were described as our previous study.17| Sample | COD (mg L−1) | TAN (mg L−1) | pH |
|---|---|---|---|
| a Abbreviations: HT: homogeneous tank; OD: oxidation ditch; AI: anoxic tank influent; OT: oxic tank; SOT: secondary oxic tank; SOE: secondary oxic tank effluent. COD: chemical oxygen demand; TAN: total ammonia nitrogen concentration. | |||
| HT | 1005.20 | 112.6 ± 10.53 | 8.21 ± 0.08 |
| OD | 149.05 ± 14.71 | 70.16 ± 6.35 | 8.07 ± 0.14 |
| AI | 184.51 ± 27.85 | 57.32 ± 7.19 | 8.22 ± 0.12 |
| AT | 117.2 ± 10.64 | 29.67 ± 6.14 | 8.02 ± 0.1 |
| OT | 109.66 ± 22.15 | 22.52 ± 5.35 | 8.08 ± 0.1 |
| SOT | 125.33 ± 25.1 | 13.58 ± 2.03 | 8.16 ± 0.08 |
| SOE | 118.36 ± 9.85 | 12.44 ± 3.38 | 8.19 ± 0.05 |
2.3. Nucleic acids extraction, reverse transcription and illumina sequencing
For each mixed-liquor sample, samples of 20 ml were centrifuged at 8000 rpm. For 10 min at 4 °C to collect the activated sludge. Then DNA and RNA were extracted from the pellet with E.Z.N.A.® Soil DNA Kit and E.Z.N.A.® Soil RNA Kit (Omega Bio-Tek, Norcross, GA, USA) respectively according to the manufacturer's instructions.The concentration and purity of RNA and DNA was determined by using NanoDrop 1000 Spectrophotometer (Thermo Fisher Scientific, USA). The erasure of genomic DNA and reverse transcription reactions were performed with PrimeScript™ RT reagent Kit with gDNA Eraser (Takara, Japan), following the manufacturer's protocol and using 2 μg RNA in a final volume of 60 μl. Both cDNA and DNA were stored at −80 °C for subsequent analyses. Subsequently, the V4 regions of the 16S rRNA for bacteria (∼250 nucleotides) and archaea (∼380 nucleotides) were amplified in three independent PCR reactions, then purified PCR products were used to construct sequencing libraries and the libraries were finally sequenced on an Illumina HiSeq2500 platform (for details, see ESI S1†). All 16S rRNA sequences from high-throughput sequencing have been deposited into the NCBI short-reads archive database with accession number SRP076775.
2.4. Real-time qPCR assay
All qPCR assays were performed on an ABI 7500 Real Time PCR System (Applied Biosystems). The copy numbers of 16S rRNA and 16S rRNA genes were estimated by using universal primer pair 338F/518R for bacteria and PARCH340f/519r for archaea.18,19 More details on qPCR calibration curves and qPCR procedure (including correlation coefficients and efficiency of PCR amplification) are described in ESI S2.†2.5. Sequence and statistical analysis
The raw sequencing data were processed using the QIIME pipeline v1.7.0 to obtain the high-quality tags20 and chimera checked using UCHIME algorithm21 against the reference database (Gold database) to generate clean data. Then the effective tags from all samples were clustered into operational taxonomic units (OTUs) using Uparse v7.0.1001 (ref. 22) with 97% similarity. Taxonomy was assigned to the representative sequences using the RDP classifier and Greengenes Database v. May 2013.23 The following diversity analyses were determined in QIIME (v1.7.0): α-diversity (Shannon index, Simpson index and number of observed OTUs), principal coordinate analysis (PCoA) and cluster analysis based on weighted UniFrac. The R Studio version 3.2.3. software (http://www.r-project.org)24 was used for statistical analysis. Permutational analysis of variance (PERMANOVA) based on Euclidean distances was performed with 9999 permutations to assess significant differences in community composition between DNA community and RNA community in the R “vegan” package.25 The similarity of bacterial community between DNA and RNA community was further estimated by principal components analysis (PCA) using R “vegan” package. SIMPER analysis in PRIMER-E v5 (PRIMER-E Ltd, Ivybridge, UK) was applied to filter out phyla that contributed to 30% of dissimilarity between DNA-derived and RNA-derived community. Standard Mantel test was used to determine correlations between environmental factors and community composition (based on the relative abundance of phyla) with the R “vegan” package. Redundancy analysis was conducted to further analyze changes in the bacterial community under constraint of physico-chemical parameters with Canoco for Windows version 4.5 software. All statistical tests performed in this study were assumed to be significant at P-values ≤ 0.05.2.6. Network analysis and functional predictions
A Spearman correlation-based network analysis was used to detect the correlations between bacterial phyla and environmental parameters. The Spearman correlation was calculated in the R “Hmisc” package26 and P-value adjustments for coefficients were performed using Benjamini–Hochberg false discovery rate.27 Any bacterial taxa with occurrence in ≤20% samples and averaged abundance ≤1% (in total 16S rRNA/16S rRNA gene sequences of each sample) were excluded. Only strong and statistically significant correlations (Spearman's coefficient ≥ 0.7 or ≤− 0.7; corrected P-value ≤ 0.05) were visualized in Cytoscape v 3.4.0.28The functional contents of our bacterial community dataset were assessed based on 16S rRNA/rRNA gene sequencing data with Phylogenetic Investigation of Communities by Reconstruction of Unobserved States (PICRUSt), which is a bioinformatics tool that allows for the reconstruction of a metagenome by inference of gene content using 16S ribosomal DNA sequences.29 For the analysis, based on the rarefied 16S sequences, the closed-reference OTUs were picked against the May 2013 Greengenes database using QIIME v 1.7 according to the online protocol, then the PICRUSt algorithm adjusted for the resulting OTUs and finally predicted functional genes, which were further classified into KEGG (Kyoto Encyclopedia of Genes and Genomes) orthologues according to the online protocol described by the developers (http://picrust.github.com/picrust/tutorials/quickstart.html#quickstart-guide).
3. Results and discussion
3.1. Diversity of microbial communities
In total, approximately 721 680 sequence tags of bacterial 16S rRNA and 16S rRNA gene with an average length of 250 bp, and 709 919 tags of archaeal 16S rRNA and 16S rRNA gene with an average length of 380 bp were acquired after denoising and chimera removal. Following subsampling, a total of 26 664 and 16 477 OTUs, defined at 97% similarity for bacteria and archaea were obtained respectively.To assess the internal (within-sample) complexity of individual microbial populations, the numbers of OTUs, Shannon and Simpson indices at cutoff level of 3% were summarized in Table 2. With regard to bacterial diversity, the Shannon and Simpson indices between total and active bacteria community showed no detectable distinctions (Table 2; P > 0.61). Also, the Chao1 estimator predictions were not detectably different between total and active communities (Table 2; P > 0.8). Strikingly, PCA followed by PERMANOVA showed significant differences in structure between total and active bacterial community (Fig. 2a, F = 13.14, P < 0.001), which was in line with previous studies in which the differences of microbial community structure between DNA- and RNA-derived communities had been reported.10,30,31 A possible explanation for this observation was that DNA of some dead bacteria could persist for a prolonged period of time.9 Furthermore, the divergence between the bacterial diversity and structure suggested that the structure of the active community cannot represent the total community, which was consistent with previous study.10 Regarding the archaeal biodiversity, neither the diversity estimators (Chao1, Shannon and Simpson indices) nor structure were significantly different between DNA- and RNA-based archaeal community (P > 0.24 and 0.39, respectively; Table 2) which was in accordance with previous work in microbial electrolysis cells anode biofilm, indicating that the archaeal community within activated sludge was well depicted and kept certain stability in composition.15 Meanwhile, these results also indirectly validated the fact that eubacteria play a pivotal role in wastewater treatment.5 In addition, the rarefaction curves tended to reach saturation, indicating that the sequencing depth could reveal the microbial diversity within these samples (Fig. S1†).
| Category | Sample | OTUs | Shannon | Simpson | Chao1 | ACE | Goods coverage |
|---|---|---|---|---|---|---|---|
| Bacteria | |||||||
| DNA | HT | 891 | 5.082 | 0.942 | 1414.44 | 1571.173 | 0.985 |
| OD | 1515 | 6.99 | 0.969 | 1472.267 | 1508.526 | 0.99 | |
| AI | 1864 | 7.641 | 0.983 | 1776.667 | 1922.212 | 0.986 | |
| AT | 2189 | 8.59 | 0.992 | 2381.439 | 2457.824 | 0.98 | |
| OT | 2077 | 8.659 | 0.994 | 2260.65 | 2267.562 | 0.982 | |
| SOT | 2134 | 8.435 | 0.991 | 2029.64 | 2104.107 | 0.984 | |
| SOE | 2118 | 8.693 | 0.993 | 2261.757 | 2313.769 | 0.982 | |
| RNA | HT | 1494 | 5.076 | 0.905 | 1391.735 | 1512.119 | 0.992 |
| OD | 1860 | 7.219 | 0.975 | 1831.063 | 1876.748 | 0.992 | |
| AI | 1819 | 7.562 | 0.986 | 1738.094 | 1783.152 | 0.992 | |
| AT | 2113 | 7.926 | 0.987 | 2047.024 | 2085.496 | 0.992 | |
| OT | 2140 | 7.764 | 0.982 | 2069.407 | 2126.919 | 0.991 | |
| SOT | 2213 | 7.791 | 0.984 | 2141.347 | 2237.782 | 0.99 | |
| SOE | 2237 | 8.587 | 0.993 | 2057.228 | 2133.893 | 0.994 | |
![[thin space (1/6-em)]](https://www.rsc.org/images/entities/char_2009.gif) |
|||||||
| Archaea | |||||||
| DNA | HT | 522 | 3.404 | 0.803 | 452.14 | 484.725 | 0.998 |
| OD | 1208 | 6.692 | 0.943 | 1213.069 | 1206.356 | 0.995 | |
| AI | 1258 | 6.509 | 0.943 | 1238.283 | 1254.166 | 0.995 | |
| AT | 1424 | 7.052 | 0.961 | 1416.183 | 1446.092 | 0.994 | |
| OT | 1340 | 6.664 | 0.94 | 1326.077 | 1350.274 | 0.995 | |
| SOT | 1353 | 6.717 | 0.942 | 1332.148 | 1343.893 | 0.995 | |
| SOE | 1345 | 6.848 | 0.946 | 1311.371 | 1335.742 | 0.996 | |
| RNA | HT | 848 | 5.205 | 0.926 | 824.25 | 850.904 | 0.996 |
| OD | 1138 | 6.479 | 0.951 | 1089.121 | 1104.626 | 0.996 | |
| AI | 1003 | 7.159 | 0.981 | 2106.81 | 1319.97 | 0.992 | |
| AT | 1265 | 7.592 | 0.979 | 1250.519 | 1265.165 | 0.996 | |
| OT | 1262 | 7.489 | 0.976 | 1280.685 | 1276.664 | 0.995 | |
| SOT | 1193 | 7.607 | 0.985 | 1190.986 | 1195.123 | 0.996 | |
| SOE | 1318 | 7.801 | 0.985 | 1287.785 | 1299.202 | 0.996 | |
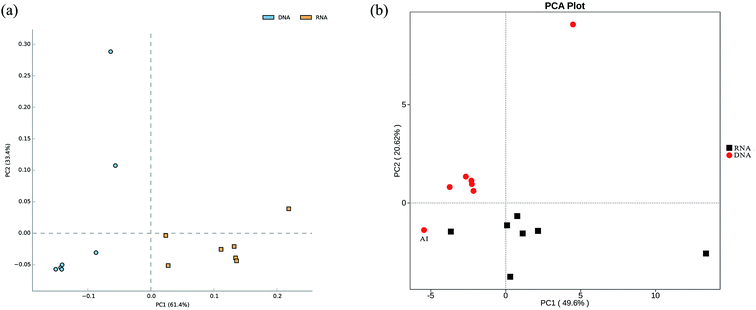 | ||
| Fig. 2 Principal component analysis (PCA) plot showing both total and active bacterial communities (a), as well as their functional diversity (b). | ||
3.2. Differences between total and active microbial communities
3.3. Environment-species associations and functional predication
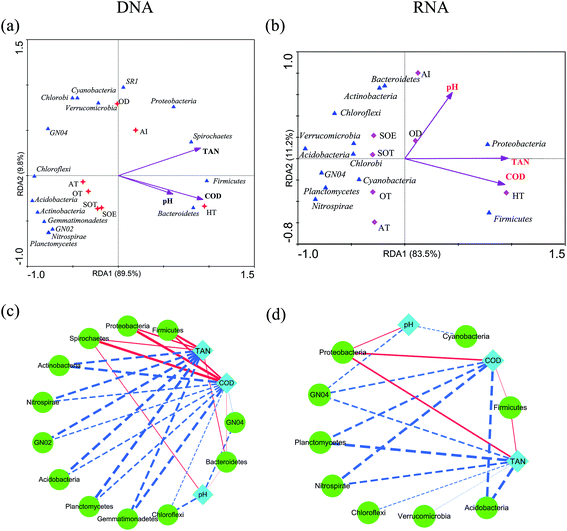
Environmental factors are generally considered as critical roles for changes of microbial consortia in activated sludge.30 In this study, multivariate analyses were applied to detect this relationship. The Mantel test indicated significant correlations (r = 0.704, P = 0.022) between DNA-derived bacterial assemblages and physicochemical variables, which displayed tighter than that of RNA community (r = 0.6208, P = 0.032). This is in line with the previous study in activated sludge.38 Moreover, RDA analysis and the integrated network analysis further confirmed this and revealed the environment-species associations (Fig. 5). Ecological functions could be associated with 81.87–98.87% of the dominant phyla of the bacterial community. Among the selected phyla, such as Proteobacteria, Bacteroidetes, Firmicutes and Spirochaetes, relative abundance in the DNA community was primarily correlated with COD and total ammonium nitrogen via positive correlations (Fig. 5a). Thus, the increase in COD and total ammonium nitrogen concentration may result in the accumulation of these phyla, by contrast, negative correlations dominated the associations between COD, total ammonium nitrogen and bacterial taxa, meaning that the increase in COD and total ammonium nitrogen may reduce the abundance of most dominant phyla in wastewater treatment process. Regarding the RNA community, Proteobacteria was strongly positive with COD and total ammonium nitrogen concentration (Spearman correlation: COD, rho = 0.853, P = 0.0003; total ammonium nitrogen, rho = 0.863, P = 0.0002, respectively) and Firmicutes showed the similar correlation (COD, rho = 0.744, P = 0.004; total ammonium nitrogen, rho = 0.78, P = 0.002, respectively), while all the rest presented negative correlations with COD and total ammonium nitrogen concentration (Fig. 5b, P < 0.05). Indeed, network analysis (Fig. 5c and d) further tracked that COD and total ammonium nitrogen with more edges related to bacterial phyla explained much better association with bacterial diversity than pH with fewer edges, indicating that COD and total ammonium nitrogen in this process may significantly influence the microbial structure, as described elsewhere.17,38 Positive correlations between active Proteobacteria and COD could potentially contribute to its overrepresentation compared to the total community.34 Moreover, Nitrospira, who was considered as nitrite-oxidizing bacteria, had a negative relationship with total ammonium nitrogen concentration, which could be transformed to nitrite by ammonia-oxidizing bacteria.38 Thus, the increasement in Nitrospira abundance within both total and active community could be linked with the reduction of total ammonium nitrogen concentration. Previous study reported that Acidobacteria was capable of competing substrate via K-selected strategy.46 Indeed, in this work, phylum Acidobacteria was negatively related with COD concentration and was preferentially detected in the RNA-based community, which indicated their activity during the process. In addition, there was no significant effect of pH on total and active community structure (Fig. 5a and b, P > 0.42), which could be interpreted by the stability of pH (Table 1). However, no significant linkages were observed between environmental variability and archaeal community composition in either DNA samples or RNA samples (P > 0.05), which might result from the insignificant variation of archaeal community structure. Overall, the environment-species associations in this study preliminarily implicated the importance of same environmental filters in shaping assembly of both total and active bacterial communities in activated sludge.30,38The microbial consortia within activated sludge may manifest many crucial functions which are essential to biological wastewater treatment. In present study, PICRUSt, a predictive exploratory tool, was performed to predict metabolic functions of bacterial 16S rRNA/rRNA genes and found that 41 level 2 KEGG orthology groups which might be associated with variations in OTU abundance detected via 16S sequencing were inferred in the activated sludge. The predictive functional profiling (Fig. 6) indicated that the most predicted metabolic functional categories were related to membrane transport (11.25–12.8%), amino acid metabolism (9.18–10.48%), carbohydrate metabolism (8.51–10.12%), replication and repair (6.87–7.96%) and energy metabolism (5.8–6.74%), suggesting that microbes in activated sludge kept metabolically active during the process, which in accordance with the conventional interpretation that the complex mixture of pollutant within wastewater were degraded by a diverse metabolic pathways of cells.47 When comparing the function of gene predicated with the active bacteria of the complete bacterial community, the relative abundances of most of the gene families of DNA community showed significantly statistical differences with that of RNA community (Fig. 2b, F = 3.41, P = 0.0142). However, the bacterial 16S rRNA genes from AI showed no significant statistical differences in predictive functional profiling with bacterial 16S rRNA, which could be interpreted the inherent limitation that the accuracy of PICRUSt is dependent on the phylogenetic dissimilarity among reference genomes and sequenced sequence.29 An alternative explanation might be the loss of those genes which were not included in the input database.29 Unfortunately, we also found genes relating to human disease in those samples, which was in line with the aforementioned detections of Clostridium and Arcobacter (Fig. S3 and S4†).48,49 Even though several functions were inferred by PICRUSt, the loss of many actual functions of microbe in activated sludge should be further explored with the aid of multiple omics approaches.
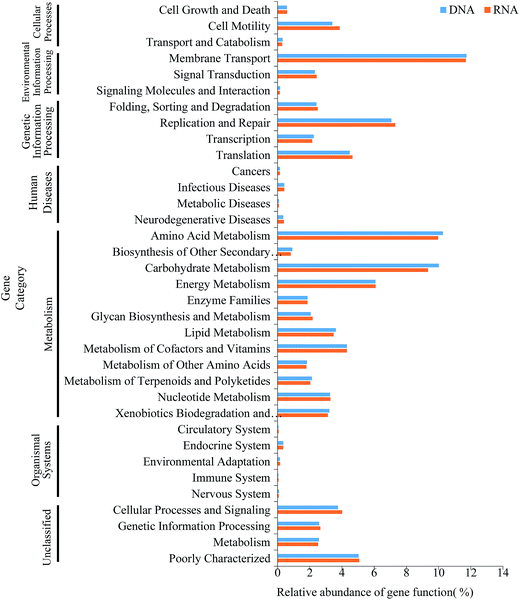 | ||
| Fig. 6 Comparison of predicted metabolic functions of the DNA- and RNA-based bacterial communities found in activated sludge. | ||
3.4. Quantifications and 16 rRNA/rRNA gene ratios of total bacteria and archaea
Synchronously quantifying the number of copies of the 16S rRNA and 16S rRNA genes in the same set of assays provided new insights into both the abundances and activity status of the microbial communities. Fig. 7 showed the mean copies of 16S rRNA genes and 16S rRNA of both bacteria and archaea. The results indicated that the abundance of total bacterial and archaeal were slightly variable throughout the integrated treatment process, while the values of copy numbers of bacterial and archaeal 16S rRNA were 1–3 orders of magnitude in HT, OD and AI than other samples. Additionally, the 16S rRNA genes copy numbers of bacteria were higher than those of archaea, indicating that bacteria played an important role in biological wastewater treatment.5 | ||
| Fig. 7 Quantification of the relative abundance of microbial 16S rRNA genes and their transcripts in 7 samples. (a) Bacteria; (b) archaea. | ||
The 16S rRNA/16S rRNA gene ratio was frequently applied to estimate microbial activity and the 16S rRNA/16S rRNA gene ratio > 1 was considered as a threshold for whether the microbe was potentially active to assess the diversity of active taxa.10,16,50 Previous study reported that metabolically active Mycolata with high 16S rRNA/16S rRNA gene ratio might lead to foaming in membrane bioreactors (MBRs).50 In this study, the 16S rRNA/16S rRNA gene ratio ranged from 1.96 to 2907.35 across samples from HT, OD and AI in both bacterial and archaeal communities, suggesting that microbes in these samples kept potentially metabolic activity. However, the ratios sharply decreased to less than one in the later stage, especially the 16S rRNA/16S rRNA gene ratio in sample from SOE which almost went down to 0, presuming that it contained on average less active populations than other samples, possibly due to the nutrient limitation (Table 1). Hence, we concluded that both the higher rRNA concentrations and 16S rRNA/16S rRNA gene ratios indirectly reflected the relationship between potentially metabolic activity of microbes and nutrient, as well as the removal efficiency.
4. Conclusions
In this work, microbial community and its active taxa were compared in activated sludge by the independent analysis of 16S rRNA and 16S rRNA gene. The results demonstrated that the active community significantly differed from the total community. The dominant group, such as Proteobacteria, and rare taxa with low abundance, such as NC10 and GAL15, were preferentially detected in the RNA-based community, indicating the limitations of DNA-based study, which possibly miss considerable portions of active microbial populations. In the activated sludge, microbial communities showed differences in their distributions due to the characteristics of wastewater and the 16S rRNA/16S rRNA gene ratio of microbes presented a downward trend along with the process, which likely result from nutrition deficiency. Thus, environmental factors could affect both total and active communities within activated sludge. Further study should focus on the relationships between total and active communities and how environmental change influences the associations to determine microbial function during wastewater treatment process.Conflicts of interest
The authors declare no conflict of interest.Acknowledgements
We would like to acknowledge the National Natural Foundation of China (grant 31271924) for the financial support. The authors would like to thank the lab colleagues for their endless support.References
- A. Deghles and U. Kurt, Chem. Eng. Process., 2016, 104, 43–50 CrossRef CAS.
- A. Deghles and U. Kurt, Desalin. Water Treat., 2016, 57, 14798–14809 CrossRef CAS.
- R. Ganesh, P. Sousbie, M. Torrijos, N. Bernet and R. A. Ramanujam, Clean Technol. Environ., 2015, 17, 735–745 CrossRef CAS.
- L. Ye and T. Zhang, Appl. Microbiol. Biotechnol., 2013, 97, 2681–2690 CrossRef CAS PubMed.
- T. C. Yadav, A. A. Khardenavis and A. Kapley, Bioresour. Technol., 2014, 165, 257–264 CrossRef CAS PubMed.
- S. Banerjee, M. Baah-Acheamfour, C. N. Carlyle, A. Bissett, A. E. Richardson, T. Siddique, E. W. Bork and S. X. Chang, Environ. Microbiol., 2016, 18, 1805–1816 CrossRef PubMed.
- J. Gong, F. Shi, B. Ma, J. Dong, M. Pachiadaki, X. Zhang and V. P. Edgcomb, Environ. Microbiol., 2015, 17, 3722–3737 CrossRef CAS PubMed.
- T. Zhang, M.-F. Shao and L. Ye, ISME J., 2012, 6, 1137–1147 CrossRef CAS PubMed.
- V. Kapoor, T. Pitkänen, H. Ryu, M. Elk, D. Wendell and J. W. Santo Domingo, Appl. Environ. Microbiol., 2015, 81, 91–99 CrossRef PubMed.
- P. J. Kearns, J. H. Angell, E. M. Howard, L. A. Deegan, R. H. R. Stanley and J. L. Bowen, Nat. Commun., 2016, 7, 12881 CrossRef CAS PubMed.
- S. J. Blazewicz, R. L. Barnard, R. A. Daly and M. K. Firestone, ISME J., 2013, 7, 2061–2068 CrossRef CAS PubMed.
- R. C. Mueller, L. Gallegos-Graves, D. R. Zak and C. R. Kuske, Microb. Ecol., 2016, 71, 57–67 CrossRef PubMed.
- P. Baldrian, M. Kolařík, M. Štursová, J. Kopecký, V. Valášková, T. Větrovský, L. Žifčáková, J. Šnajdr, J. Rídl and Č. Vlček, ISME J., 2012, 6, 248–258 CrossRef CAS PubMed.
- P. Maza-Márquez, R. Vilchez-Vargas, F.-M. Kerckhof, E. Aranda, J. González-López and B. Rodelas, Water Res., 2016, 105, 507–519 CrossRef PubMed.
- M. Cerrillo, M. Viñas and A. Bonmatí, Water Res., 2017, 110, 192–201 CrossRef CAS PubMed.
- A. M. Klein, B. J. M. Bohannan, D. A. Jaffe, D. A. Levin and J. L. Green, Front. Microbiol., 2016, 7, 772 Search PubMed.
- H. Liang, D. Ye, P. Li, T. Su, J. Wu and L. Luo, RSC Adv., 2016, 6, 87380–87388 RSC.
- G. Muyzer, E. C. De Waal and A. G. Uitterlinden, Appl. Environ. Microbiol., 1993, 59, 695–700 CAS.
- L. Ovreås, L. Forney, F. L. Daae and V. Torsvik, Appl. Environ. Microbiol., 1997, 63, 3367–3373 Search PubMed.
- J. G. Caporaso, J. Kuczynski, J. Stombaugh, K. Bittinger, F. D. Bushman, E. K. Costello, N. Fierer, A. G. Pena, J. K. Goodrich and J. I. Gordon, Nat. Methods, 2010, 7, 335–336 CrossRef CAS PubMed.
- R. C. Edgar, B. J. Haas, J. C. Clemente, C. Quince and R. Knight, Bioinformatics, 2011, 27, 2194–2200 CrossRef CAS PubMed.
- R. C. Edgar, Nat. Methods, 2013, 10, 996–998 CrossRef CAS PubMed.
- D. McDonald, M. N. Price, J. Goodrich, E. P. Nawrocki, T. Z. DeSantis, A. Probst, G. L. Andersen, R. Knight and P. Hugenholtz, ISME J., 2012, 6, 610–618 CrossRef CAS PubMed.
- R. C. Team, 2013, ISBN 3-900051-07-0, http://www.R-project.org.
- J. Oksanen, F. G. Blanchet, R. Kindt, P. Legendre, P. R. Minchin, R. B. O'Hara, G. L. Simpson, P. Solymos, M. H. H. Stevens and H. Wagner, Vegan: community ecology package, R package version 2.3-5, 2016 Search PubMed.
- F. E. Harrell, R package version, 2008, 3, 4.
- Y. Benjamini and Y. Hochberg, J. R. Stat. Soc. Series B Stat. Methodol., 1995, 289–300 Search PubMed.
- P. Shannon, A. Markiel, O. Ozier, N. S. Baliga, J. T. Wang, D. Ramage, N. Amin, B. Schwikowski and T. Ideker, Genome Res., 2003, 13, 2498–2504 CrossRef CAS PubMed.
- M. G. Langille, J. Zaneveld, J. G. Caporaso, D. McDonald, D. Knights, J. A. Reyes, J. C. Clemente, D. E. Burkepile, R. L. V. Thurber and R. Knight, Nat. Biotechnol., 2013, 31, 814–821 CrossRef CAS PubMed.
- Y. Zhang, Z. Zhao, M. Dai, N. Jiao and G. J. Herndl, Mol. Ecol., 2014, 23, 2260–2274 CrossRef CAS PubMed.
- A. Rodríguez-Blanco, V. Antoine, E. Pelletier, D. Delille and J. F. Ghiglione, Environ. Pollut., 2010, 158, 663–673 CrossRef PubMed.
- D. Shu, Y. He, H. Yue and Q. Wang, Bioresour. Technol., 2015, 186, 163–172 CrossRef CAS PubMed.
- K. J. Romanowicz, Z. B. Freedman, R. A. Upchurch, W. A. Argiroff and D. R. Zak, FEMS Microbiol. Ecol., 2016, 92, fiw149 CrossRef PubMed.
- K. Takai, B. J. Campbell, S. C. Cary, M. Suzuki, H. Oida, T. Nunoura, H. Hirayama, S. Nakagawa, Y. Suzuki and F. Inagaki, Appl. Environ. Microbiol., 2005, 71, 7310–7320 CrossRef CAS PubMed.
- K. F. Ettwig, T. Van Alen, K. T. van de Pas-Schoonen, M. S. Jetten and M. Strous, Appl. Environ. Microbiol., 2009, 75, 3656–3662 CrossRef CAS PubMed.
- E. M. Fykse, T. Aarskaug, E. H. Madslien and M. Dybwad, Bioresour. Technol., 2016, 222, 380–387 CrossRef CAS PubMed.
- B. Nogales, E. R. B. Moore, E. Llobet-Brossa, R. Rossello-Mora, R. Amann and K. N. Timmis, Appl. Environ. Microbiol., 2001, 67, 1874–1884 CrossRef CAS PubMed.
- F. Ju and T. Zhang, ISME J., 2015, 9, 683–695 CrossRef CAS PubMed.
- S. F. Stoddard, B. J. Smith, R. Hein, B. R. Roller and T. M. Schmidt, Nucleic Acids Res., 2014, 43, D593–D598 CrossRef PubMed.
- B. Lee, J.-G. Park, W.-B. Shin, D.-J. Tian and H.-B. Jun, Bioresour. Technol., 2017, 234, 273–280 CrossRef CAS PubMed.
- S. J. Hallam, K. T. Konstantinidis, N. Putnam, C. Schleper, Y.-i. Watanabe, J. Sugahara, C. Preston, J. de la Torre, P. M. Richardson and E. F. DeLong, Proc. Natl. Acad. Sci. U. S. A., 2006, 103, 18296–18301 CrossRef CAS PubMed.
- M. Könneke, A. E. Bernhard, R. José, C. B. Walker, J. B. Waterbury and D. A. Stahl, Nature, 2005, 437, 543–546 CrossRef PubMed.
- F. Fegatella, J. Lim, S. Kjelleberg and R. Cavicchioli, Appl. Environ. Microbiol., 1998, 64, 4433–4438 CAS.
- A. M. Ziganshin, E. E. Ziganshina, S. Kleinsteuber and M. Nikolausz, Archaea, 2016, 2016, 12 CrossRef PubMed.
- A. M. Ziganshin, T. Schmidt, Z. Lv, J. Liebetrau, H. H. Richnow, S. Kleinsteuber and M. Nikolausz, Bioresour. Technol., 2016, 217, 62–71 CrossRef CAS PubMed.
- V. Torsvik and L. Øvreås, Curr. Opin. Microbiol., 2002, 5, 240–245 CrossRef CAS PubMed.
- E. W. Low and H. A. Chase, Water Res., 1999, 33, 1119–1132 CrossRef CAS.
- M. Sebaihia, B. W. Wren, P. Mullany, N. F. Fairweather, N. Minton, R. Stabler, N. R. Thomson, A. P. Roberts, A. M. Cerdeño-Tárraga and H. Wang, Nat. Genet., 2006, 38, 779–786 CrossRef PubMed.
- C. Phillips, Food Control, 2001, 12, 1–6 CrossRef.
- P. Maza-Márquez, R. Vílchez-Vargas, N. Boon, J. González-López, M. V. Martínez-Toledo and B. Rodelas, Water Res., 2016, 92, 208–217 CrossRef PubMed.
Footnote |
| † Electronic supplementary information (ESI) available. See DOI: 10.1039/c7ra07470k |
| This journal is © The Royal Society of Chemistry 2017 |

