 Open Access Article
Kinetics and thermodynamics of dissolved petroleum hydrocarbons in sediment under sophorolipid application and their effects on oil behaviour end-results in marine environment
Haoshuai Liab,
Xiaohong Zhuangab and
Mutai Bao *ab
*ab
aKey Laboratory of Marine Chemistry Theory and Technology, Ministry of Education, Ocean University of China, Qingdao 266100, China. E-mail: mtbao@ouc.edu.cn; Fax: +86-532-6678254; Tel: +86-532-6678254
bCollege of Chemistry and Chemical Engineering, Ocean University of China, Qingdao 266100, China
First published on 26th September 2017
Abstract
The behaviour end-result of dissolved petroleum hydrocarbons (DPHs) is known to interact with sediments in marine environments. The simulated experiments presented here investigated the progress of behaviour end-results, including the adsorption isotherm, adsorption kinetics, and thermodynamics parameters, and focuses specifically on the effects of factors in the presence of sophorolipids. The results show that there is good agreement between the experimental data and the Lagergren pseudo-second-order model (R2 = 0.968). A Freundlich isotherm model (R2 = 0.924) was derived to describe the adsorption process, where ΔHθ and ΔSθ were 39.1 kJ mol−1 and 104.0 J (K mol)−1, respectively. Such calculations indicated that this process is part of a complex physical and chemical reaction and is an endothermic reaction. It is worth noting that randomness at the solid-solution interface increased during the adsorption process. The adsorption sites met the need of petroleum hydrocarbon molecules when the sediment concentration reached 3 g L−1. The dominant sediment grain size fractions were <150 μm, and the total adsorption quantity of the fraction accounted for 0.27. The DPHs adsorbed hydrocarbons more easily when a chemical dispersant, GM-2, was applied, but at the same depth, the hydrocarbon content adsorbed by the sediment under biosurfactant application was relatively low. It is significant that sediment samples had a lower adsorption capacity when using a sophorolipid as a biosurfactant, rather than a rhamnolipid. Understanding the adsorption of DPHs onto sediment under sophorolipid application will broaden the understanding of heavy oil transport mechanisms and will provide a theoretical basis for remediation of areas with serious oil pollution.
1. Introduction
In the past years, major oil spills have attracted the attention of the public and the media, which has created a global awareness of the social, economic, and ecological impacts of these incidents.1–4 Oil spills not only affect the seawater into which they are introduced but also affect the coast as they migrate landward. Beached oil causes severe damage to coastlines and requires large sums of money to remediate.5 Several serious offshore oil spills have occurred since 1995, such as the spill from the Sea Empress that produced approximately 5000 tons of oil that reached the UK coastline.6 The cost associated with the logistics of cleaning up the Sea Empress oil spill was estimated to be $120 million. When the impacts to the economy and environment were taken into account, the final cost of the spill was estimated to be $240 million.7In marine ecosystems, the sorption and desorption behaviours of hydrocarbons are important because they affect the transport and fate of crude oil, which is a highly hydrophobic material composed of components that have low water solubility.8 Sorption and desorption are the key processes that affect the distribution of substances between different sub-environments in marine ecosystems.9 These processes have also been found to be some of the dominant processes that dictate the bioavailability of soil/sediment-bound hydrophobic organic contaminants.10 Oil dispersants and microbially produced biosurfactants are known to strongly affect the sorption and desorption behaviours of many organic contaminants and are expected to influence the sorption and desorption processes that occur during the removal of heavy oil from sediment. This information is important for understanding the roles of oil dispersants and biosurfactants in the distribution and transport of petroleum PAHs in marine sediments.11 Due to the amphiphilic nature of surfactants, dispersants can cause contrasting effects on the sorption of crude oil by sediments.12,13 On the one hand, a surfactant can increase the apparent solubility of PAHs because it has a hydrophobic tail, which reduces sorption and favours desorption of PAHs. On the other hand, the sorption of surfactants on sediments enhances the partitioning of additional PAHs onto the immobilized surfactant. The overall effects of a dispersant would depend on the relative influence of these contrasting factors.
In recent years, dispersants have been used to remediate oil pollution and to investigate the influence of dispersants in marine systems.11 Some studies found that the presence of dispersants can accelerate the adsorption of pollutants.14,15 Such information can facilitate a sounder assessment of the fate and distribution of dispersed oil hydrocarbons in marine systems.16 Most of these studies investigated the oil content of the oil phase, but few studies investigated the oil content of the water phase after an oil spill. Many studies have investigated the sorption and desorption kinetics of hydrophobic organic compounds (HOCs).17,18 Some studies have investigated the adsorption and desorption of PAHs in the presence of a biosurfactant.19,20 The use and commercial application of biosurfactants in the petroleum industry have been developed during the past decades.21 The use of biosurfactants is a promising and environmentally benign alternative to the use of chemically synthesized surfactants, and in the future, biosurfactants will be more commonly used.22,23 The investigation of sorption and desorption of oil in marine sediments in the presence of biosurfactants is crucial to producing transport and risk assessment models, but the mechanisms related to how sorption and desorption rates vary are not fully understood.24,25
The objectives of this study were to (i) build kinetic and thermodynamic models of DPH adsorption onto sediment in the presence of sophorolipid in a simulated marine environment, (ii) investigate the effects of temperature, sediment concentration, and the distribution of particle size on the adsorption of DPHs, (iii) calculate whether DPHs were adsorbed more easily when using a chemical dispersant, rather than a biosurfactant, and (iv) confirm that sediments had a lower adsorption capacity when using a sophorolipid as a biosurfactant, rather than a rhamnolipid.
2. Materials and methods
2.1. Materials
| Items | Performance indexes | |
|---|---|---|
| Appearance | Clear, transparent, no separation | |
| pH | 7–7.5 | |
| Flash point | >70 °C | |
| Viscosity (under 30 °C) | <50 mm2 s−1 | |
| Emulsification rate | 10 min | >20% |
| 3 s | >20% | |
| Biodegradation BOD5/COD (%) | >30% | |
| Biological toxicity 3000 mg L−1 half-lethal time | >24 h | |
| Application amount | 20%–30% of oil spill volume | |
2.2. Kinetic experiments
The seawater/crude oil system was stirred at 100 rpm to avoid phase separation and oil–water emulsions. The concentration of DPHs in the seawater was measured until it became constant, which indicated that a petroleum hydrocarbon saturated solution had been obtained. The oil that remained in the aqueous phase was extracted with petroleum ether and analysed by UV spectrophotometry. The adsorption and desorption properties were studied by static immersion, using sediment as the adsorbent and DPHs as the adsorbate. The adsorption experiments were conducted in 250 mL conical flasks. A total of 0.3 g of sediment was transferred into the flask before the addition of 100 mL of saturated petroleum hydrocarbon solution. Two control experiments were conducted. The first control (a mixture of sediment and clean seawater) was used to eliminate the influence of dissolved substances. The second control (only a saturated petroleum hydrocarbon solution) was used to remove the influence of evaporation. The conical flasks were placed in a reciprocal shaker at 25 °C, were shaken at 120 rpm and were sampled at 10, 20, and 30 min and at 1, 2, 4, 6, 12, and 24 h to determine the time-variable concentration of the DPHs in the solutions. The amount of adsorption QA (mg g−1) was measured at these intervals by obtaining the concentration of the petroleum hydrocarbons.To investigate the effect of temperature on the process and evaluate the kinetic activation energy and associated thermodynamic parameters, some of the experiments were conducted at 293 K, 298 K, and 303 K, and the sediment concentrations in such experiments were 3, 5, and 10 g L−1.
After adsorption equilibrium was established, the supernatant was replaced with 100 mL of clean seawater. The conical flasks containing the contaminated sediment samples and clean seawater were used in the desorption experiments. The experimental conditions that had been used for the adsorption experiment were used for the desorption experiment. Measurements were made at 0.5, 1, 2, 6, 12, 24, 48, and 54 h to determine the concentration of DPHs in order to calculate the amount of desorption QD (mg g−1).
The oil that remained in the aqueous phase was extracted with petroleum ether and analysed using UV spectrophotometry. All trials were carried out in triplicate to ensure the accuracy of the experiments.
2.3. Effect factors
The effects of sediment particle size, the contamination level of the water, the concentration of the sediment, and environmental temperature on the adsorption of crude oil in water onto the sediment were investigated. The sediment concentration was set at 3, 5 and 10 g L−1 to investigate the effects of sediment concentration. Contamination levels was controlled by diluting the original solution. To study the effect of temperature and the thermodynamic parameters of the process, some adsorption experiments were conducted at 298, 303 and 313 K. These studies helped to improve the understanding of heavy oil transport mechanisms and provided a theoretical basis for the remediation of serious oil pollution.2.4. Vertical distribution in column simulation experiment
A 100 mL separator funnel filled with the treated beach sediment was the experimental simulation device and was used to simulate the vertical migration process of dissolved petroleum hydrocarbons on the beach. The simulation column effluent speeds were adjusted to 45 drops per min and 90 drops per min. In different cases, dissolved oil hydrocarbon eluted the sea sand in the simulating column. At the outlet, 50 mL of each effluent was collected as a unit, and the petroleum hydrocarbon concentration was detected in the solution until the petroleum hydrocarbon concentration in the effluent remained unchanged. Then, samples were extracted at different depths with petroleum ether. All trials were carried out in triplicate to ensure the accuracy of the experiments.3. Results and discussion
3.1. Adsorption kinetics of DPHs
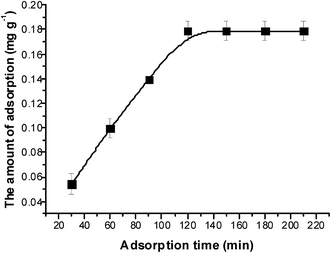
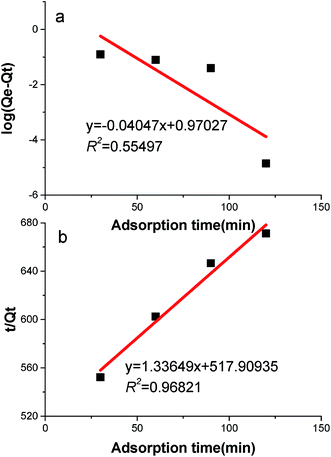
According to the results of the control experiments, it was determined that the influence of DPH evaporation can be neglected and that the amount of petroleum hydrocarbons released from the sediment could also be disregarded. Fig. 1 shows the adsorption kinetics curve of the crude oil in a sophorolipid solution. The amount of adsorption increased over time until it reached adsorption equilibrium at approximately 120 min, and the amount of adsorbed crude oil reached 0.18 mg g−1. Approximately 13.5% of DPHs were adsorbed onto the sediments.There are many models that can be used to describe the adsorption data. The Lagergren pseudo-first-order27 and Lagergren pseudo-second-order28 sorption kinetic models were fitted to the sorption kinetic data, and the fitted curves are shown in Fig. 2. A hypothesis had been proposed that the adsorption rate was proportional to the difference between the amount of equilibrium adsorption and instantaneous adsorption. The transform functions of the Lagergren pseudo-first-order equation and Lagergren pseudo-second-order equation are:
log(Qe − Qt) = log![[thin space (1/6-em)]](https://www.rsc.org/images/entities/char_2009.gif) Qe − k1t Qe − k1t
| (1) |
| t/Qt = 1/(k2Qe2) + t/Qe | (2) |
The experimental adsorption data (Fig. 2a) did not fit the Lagergren pseudo-first-order equation, eqn (1), well. These experimental results had a low correlation coefficient of 0.555. However, there was good agreement between the experimental data and the Lagergren pseudo-second-order model, as shown in Fig. 2b. The correlation coefficient was 0.968, so eqn (2) is satisfactory for describing the adsorption process.
In addition, the calculated Qe value derived using the Lagergren pseudo-second-order model agreed well with experimental data and was better than the Qe value derived using the Lagergren pseudo-first-order model. All of these results illustrated that the adsorption behaves according to the Lagergren pseudo-second-order model.
3.2. Adsorption isotherms of DPHs
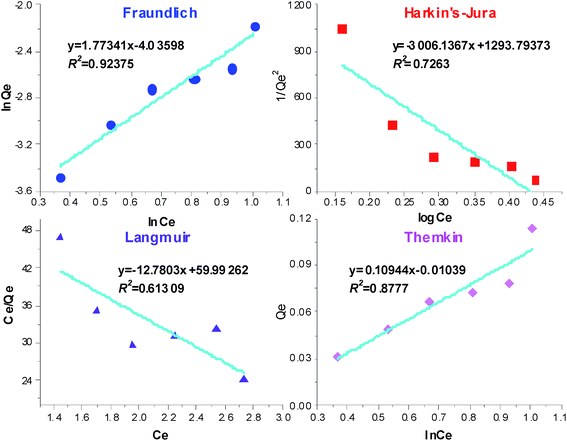
In this study, four adsorption models were used to fit the experimental data. The first model was the Langmuir isotherm model 1/Qe = 1/Qm + 1/KLQmCe (where Qm (mg g−1) is the saturated adsorption capacity, Ce (mg L−1) is the crude oil concentration at equilibrium in solution, and KL (L mg−1) is the isotherm constant); the second was the Freundlich isotherm model ln![[thin space (1/6-em)]](https://www.rsc.org/images/entities/char_2009.gif) Qe = ln
Qe = ln![[thin space (1/6-em)]](https://www.rsc.org/images/entities/char_2009.gif) KF + 1/n(ln
KF + 1/n(ln![[thin space (1/6-em)]](https://www.rsc.org/images/entities/char_2009.gif) Ce) (where KF (mg g−1) is the isotherm constant); the third was the Temkin isotherm model Qe = β
Ce) (where KF (mg g−1) is the isotherm constant); the third was the Temkin isotherm model Qe = β![[thin space (1/6-em)]](https://www.rsc.org/images/entities/char_2009.gif) ln
ln![[thin space (1/6-em)]](https://www.rsc.org/images/entities/char_2009.gif) α + β
α + β![[thin space (1/6-em)]](https://www.rsc.org/images/entities/char_2009.gif) ln
ln![[thin space (1/6-em)]](https://www.rsc.org/images/entities/char_2009.gif) Ce; and the fourth was Hurkin's-Jura isotherm model 1/Qe2 = B/A − 1/A(log
Ce; and the fourth was Hurkin's-Jura isotherm model 1/Qe2 = B/A − 1/A(log![[thin space (1/6-em)]](https://www.rsc.org/images/entities/char_2009.gif) Ce) (where A and B are the isotherm constants).29,30
Ce) (where A and B are the isotherm constants).29,30
The Freundlich isotherm model was used to describe non-uniform and multiple-substance adsorption, which was not restricted to the formation of a monolayer.31 Fig. 3 gives the values of KF and n in the Freundlich isotherm. The parameter KF indicates the sorption capacity, and the parameter n shows the facility with which the adsorption process occur: n = 1 indicates that the sorption isotherm can cross into the Henry isotherm, n > 1 indicates heterogeneous adsorption, and n < 1 indicates monomolecular adsorption. The values of the Harkin's-Jura isotherm constants and the correlation coefficient were calculated from data presented in Fig. 3. The low R2 value of 0.726 indicated that the Harkin's-Jura isotherm was not a good fit for the experimental data. Fig. 3 also shows a Langmuir isotherm, in which Qm < 0 and the correlation coefficient was 0.613. These results indicate the poor applicability of the Langmuir isotherm. The value of n < 1 and R2 = 0.924 observed in this study indicated that the adsorption was heterogeneous adsorption. In the case of the Temkin isotherm, the constants α and β were calculated from Fig. 3. The correlation coefficient was 0.878, which was lower than the value for the Freundlich isotherm. These results demonstrated the poor applicability of the Temkin isotherm.
3.3. Effect of temperature and adsorption thermodynamics
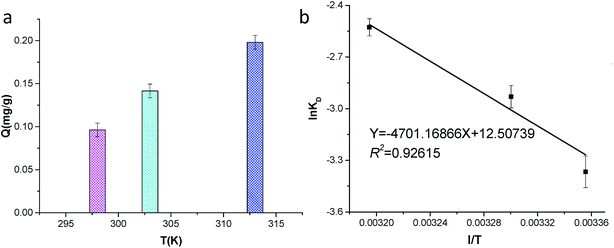
The effect of temperature on the adsorption was evaluated at 298, 303 and 313 K (Fig. 4a). As the temperature increased, the adsorption quantity increased, which can be attributed to increased adsorption rates and collisions between DPHs and the sediment surface. Adsorption at relatively high temperatures increased the adsorption rate without significant additional energy input. Thus, the higher temperatures had a positive effect on promoting the sorption process. The increase in sorption capacity was due to the activation of adsorbate during the rise in temperature. The result also illustrated that the adsorption process was an endothermic process. The reaction may be caused by the sophorolipid, where the high temperature accelerated the solution of sophorolipid, facilitating the sophorolipid desorption from the sediment and the adsorption of crude oil onto the sediment.To determine the thermodynamics of the adsorption process, the enthalpy change ΔHθ and entropy change ΔSθ were derived using the follow equation:
ln![[thin space (1/6-em)]](https://www.rsc.org/images/entities/char_2009.gif) KD = − ΔHθ/(RT) + ΔSθ/R KD = − ΔHθ/(RT) + ΔSθ/R
| (3) |
The values of ΔHθ and ΔSθ were calculated from Fig. 4b, which were 39.1 kJ mol−1 and 104.0 J (K mol)−1, respectively. The positive value of ΔHθ indicated that the process was complex with simultaneous physical and chemical reactions32 and that the process was an endothermic reaction.33 The positive value of ΔSθ indicated that the randomness that occurs at the solid-solution interface increases during the adsorption process.
3.4. Sediment concentration and distribution of particle size
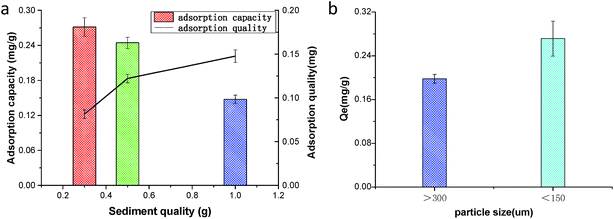
As the amount of sediment increased from 3 g L−1 to 10 g L−1, the adsorption of petroleum hydrocarbons onto sediment gradually increased in the sophorolipid solution. However, the unit mass of petroleum hydrocarbons adsorbed on the sediment decreased as the amount of sediment increased. Thus, it can be seen that at a sediment concentration of 3 g L−1, adsorption sites had already met the need of the petroleum hydrocarbon molecules (Fig. 5a). Adding in carrier adsorption soon afterwards, the adsorption process of petroleum hydrocarbons had no great contributions, and sediment adsorption quantity was also reduced, which generated larger error in the measurement results. It is evident from the experiments that the amount of adsorbed crude oil increased but the equilibrium sorption capacity of the sediment decreased as the concentration of sediment increased. This is because a higher concentration of sediment has a larger surface area than a lower concentration of sediment. However, every particle cannot come into contact with crude oil, and as such, the adsorption capacity will decrease when the amount of adsorbed crude oil is averaged over every particle.The detection ranges of particle size fractions were 0.02 to 700 μm. Hence, these size fractions were used in our investigation of the adsorption of crude oil (Fig. 5b). The dominant grain sizes were <150 μm, and the total adsorption quantity of the fraction accounted for 0.27. Generally, crude oil was more easily adsorbed onto sediment that was <150 μm than onto sediment that was >300 μm. It is well know that the larger the particle size is, the smaller the surface area of the sediment. Under conditions of the same sediment volume and crude oil concentration, the sediment that has a smaller particle size will host a higher heavy oil concentration per unit area. This scenario enhances the sorption rate, revealing that a small particle size is favourable.34
3.5. DPH adsorption under application of the chemical dispersant GM-2
With the presence of the dispersant GM-2 in the petroleum hydrocarbon effluents, the hydrocarbon content gradually increased as the eluent increased. After the effluents reached a certain hydrocarbon concentration, no further change was observed. However, the petroleum hydrocarbon concentration observed in the effluent did not reach the initial leaching concentration in the eluent. The inflow is faster and the outflow is slower, which balances the time and the concentration in the effluents, which are basically identical (Fig. 6a). The GM-2 dissolved oils from petroleum hydrocarbons as used in analysing the solution leaching sediment flow rate are not significantly different from the experimental results. This result may be caused by the vertical migration of the hydrocarbons in the solution when the concentration reaches a certain value. These results indicate that migration velocity does not have a significant effect on adsorption.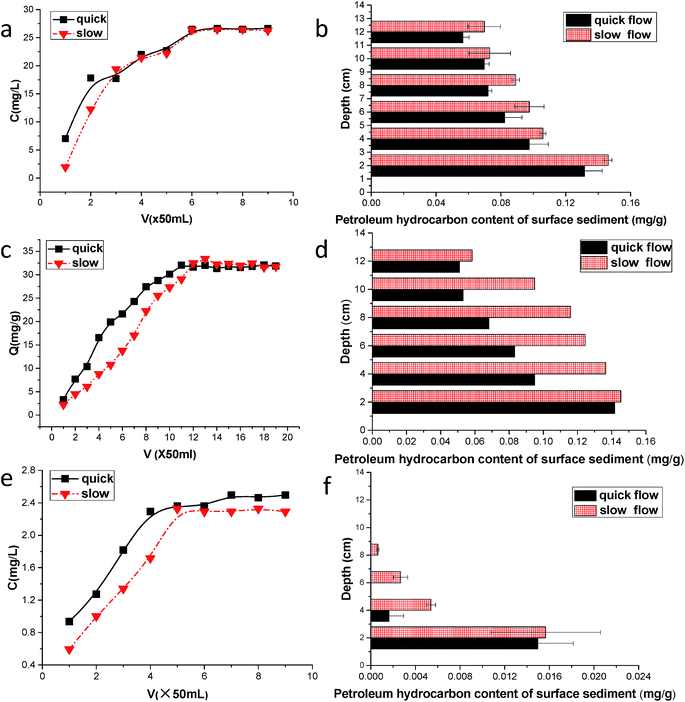 | ||
| Fig. 6 Petroleum hydrocarbon concentration in the effluent and distribution at different depths under GM-2, rhamnolipid and sophorolipid application. | ||
Similar to past results, the concentration of the petroleum hydrocarbons in the sediment decreased gradually as depth increased. Samples from the surface layer yielded concentrations of 0.14 mg g−1, and samples from near the bottom of the experimental volume yielded concentrations of 0.07 mg g−1. A group of experiments with variable flow velocity resulted in an increased content of petroleum hydrocarbons at slower velocity, resulting in a concentration difference close to 0.02 mg g−1 (Fig. 6b). Such results are identical to previous findings in several ways. The difference shows that GM-2 is a good oil dispersant. It produces an oil slick emulsion and transforms the oil to tiny particles that can be dispersed in water, making the petroleum hydrocarbons easily dissolved in water. This also increases their concentration in the solution, along with other associated chemicals. In the vertical migration through the sediments, at the different depths and velocities, regarding the sediment adsorption of oil hydrocarbons, the difference is not very apparent. The crude oil was concentrated from the chemical dispersants during vertical migration, particularly at the surface layer.35 The concentration at a 5 cm depth below the surface was quite low, and other measurements showed that the petroleum hydrocarbon concentration increased as the depth decreased. The vertical change is caused by the large dissolved oil hydrocarbons in the liquid, which results in a higher petroleum hydrocarbon concentration.
GM-2 is a type of a chemical dispersant that can fully emulsify crude oil.36 However, it also introduces some adverse effects, such as an increase in the petroleum hydrocarbon concentration in water, which can lead to the sediment adsorption of a large amount of petroleum hydrocarbons. Meanwhile, the higher viscosity of the hydrocarbons in the sediment and their adsorption can result in sediment pore blockage, which could lead to the loss of permeability and interstitial air flow. This kills living organisms in the sediment and affects their surrounding environment, thus affecting larger aquatic life and damaging the normal operation of the tidal flat ecology. Adsorption of the petroleum hydrocarbons onto the sediment will constantly result in desorption into the water, introducing secondary pollution to the marine environment.
3.6. DPH adsorption using a biosurfactant and rhamnolipid at different depths
The petroleum hydrocarbon content in the effluents increased gradually as the eluent increased. After reaching a certain concentration of hydrocarbons in the effluents, there was no further change. However, petroleum hydrocarbon concentrations in the effluents had yet to reach the initial leaching concentration in the eluent. As the eluent migrates through the sediment, petroleum hydrocarbons are adsorbed onto the sediments, and after adequate leaching, the sediment has reached the saturated adsorption level, and a small amount of the sediment adsorption solution of petroleum hydrocarbons continues leaching. Although the concentration changes dramatically, the reaction is no longer progressing. Additionally, some of the input fluids flow faster than the outflow fluids to maintain a balance over a long time. The fluids that demonstrated a faster flow rate of petroleum hydrocarbon concentration had higher effluents (Fig. 6c). With regard to vertical migration, the flow velocity is faster in the set of solutions that had a shorter contact time. The petroleum hydrocarbons have not been used as the solution in the area of the sediment outflow, making the oil hydrocarbon concentration in the effluents higher.The petroleum hydrocarbon concentration in the sediment gradually decreased as depth increased, with a smaller content of petroleum hydrocarbons in the sediment with increasing depth, and the surface sediment concentration of the petroleum hydrocarbons was approximately nine times greater than that of the underlying sediments. In the Pan et al. migration simulation experiment,37 they noted that these results were consistent with the petroleum hydrocarbons, particularly on the sediment surface, where the surface has a high concentration that gradually decreases downward. Regarding the long duration and direct contact between the surface sediment and the petroleum hydrocarbons, the volume of the petroleum hydrocarbons can be fully adsorbed onto the sediments, whereas the lower sediments are not fully in contact with the petroleum hydrocarbons. Additionally, a set of experiments showed faster velocities and higher sediment adsorption, whereas those with slower velocity had a lower content and a low sediment adsorption (Fig. 6d). By shifting to the sediment of the injector cylinder, the adsorption process is continued, explaining the reduction of the petroleum hydrocarbon concentration in the effluents.
Fig. 6e shows the conversion of oil concentration as a function of sorption at different depths when eluted at different speeds. The oil concentration decreased as the depth increased regardless of whether the speed was quick or slow. This is because the concentration of crude oil decreased with the depth due to sorption. This is consistent with some previous investigations that showed that spilled hydrocarbons remained predominantly in the organic surface horizons of the soil where spillage occurred.38 However, at lower depths, a fraction of total TG does not break down properly, leading to the production of MG and DG instead of methyl esters. Overall, the oil concentration was smaller when eluted at a quicker speed than at slower speeds. This was because the contact time was longer when eluted at quicker speeds than at slower speeds, where the crude oil had enough time to be adsorbed onto the sediment. Fig. 6f shows that the petroleum hydrocarbon content of the surface sediment was approximately 0.015 mg g−1 and gradually decreased as depth increased until it disappeared. This result was different with rhamnolipid. This may be due to a lower petroleum hydrocarbon content in the solution, which is more difficult to adsorb onto the sediment and results in a shorter contact time between the petroleum hydrocarbons and sediments during vertical migration. In this case, the sediment adsorbed little hydrocarbon oil near the bottom. In the faster group, the sediments had no petroleum hydrocarbon deposits under 4 cm, but in the slower group, the petroleum hydrocarbon component disappeared below 8 cm.
The comparison of sophorolipid with rhamnolipid indicated that rhamnolipid reached a balance for a long time at the same depth during the vertical migration process. Adsorption of petroleum hydrocarbons onto the sediment was higher. These results illustrated that sediments had significantly lower adsorption capacity when sophorolipid was used as a biosurfactant rather than rhamnolipid. To avoid the adsorption of petroleum hydrocarbons onto sediment and the introduction of them again into the sea, because adsorption of petroleum hydrocarbons onto benthic sediment causes harmful damage to the environment and secondary pollution of chemical dispersants can be introduced into the marine environment, active biological surface agents such as sophorolipids, as opposed to chemical methods, are the best choice for disposing of oil spills.
4. Conclusion
This study built kinetics (Lagergren pseudo-second-order model) and thermodynamics (Freundlich isotherm model) models of the adsorption of DPHs onto sediment and analysed the adsorption process when using a sophorolipid. The results indicated that this process included complex physical and chemical endothermic reactions, where ΔHθ and ΔSθ were 39.1 kJ mol−1 and 104.0 J (K mol)−1, respectively. Adsorption sites met the need of petroleum hydrocarbon molecules at 3 g L−1, and the dominant grain size fractions were <150 μm. Even more interesting is that DPHs adsorbed sediments more easily when using a chemical dispersant, GM-2. Sediments had a significantly lower adsorption capacity when using sophorolipid as a biosurfactant rather than rhamnolipid. The adsorption of DPHs onto sediment when using a sophorolipid will broaden the understanding of how heavy oil behaves in marine environments.Conflicts of interest
There are no conflicts to declare.Acknowledgements
This work was founded by the National Key Research and Development Program (2016YFC1402301); the National Natural Science Foundation of China (41376084); the Open Foundation of Key Laboratory of Marine Spill Oil Identification and Damage Assessment Technology of SOA (201702); and the Program for Innovative Research Team in University (IRT1289).References
- R. C. Prince, Environ. Sci. Technol., 2015, 49, 6376–6384 CrossRef CAS PubMed.
- Z. G. Ji, W. R. Johnson and G. L. Wikel, Environ. Sci. Technol., 2014, 48, 10505–10510 CrossRef CAS PubMed.
- S. E. Allan, B. W. Smith and K. A. Anderson, Environ. Sci. Technol., 2012, 46, 2033–2039 CrossRef CAS PubMed.
- C. Aeppli, C. A. Carmichael, R. K. Nelson, K. L. Lemkau, W. M. Graham, M. C. Redmond, D. L. Valentine and C. M. Reddy, Environ. Sci. Technol., 2012, 46, 8799–8807 CrossRef CAS PubMed.
- C. Gertler, G. Gerdts, K. N. Timmis and P. N. Golyshin, FEMS Microbiol. Ecol., 2009, 69, 288–300 CrossRef CAS PubMed.
- C. C. Nikitik and A. W. Robinson, Mar. Pollut. Bull., 2003, 46, 1125–1141 CrossRef CAS PubMed.
- Y. Li, A. J. Brimicombe and M. P. Rlphs, Comput Environ Urban, 2000, 24, 95–108 CrossRef.
- W. Wu, Y. Hu, Q. Guo, J. Yan, Y. Chen and J. Cheng, J. Hazard. Mater., 2015, 297, 59–65 CrossRef CAS PubMed.
- Y. D. Soubaneh, J. P. Gagné, M. Lebeuf, V. Nikiforov, B. Gouteux and A. M. Osman, Chemosphere, 2015, 131, 48–54 CrossRef CAS PubMed.
- R. Kraaij, W. Seinen, J. Tolls, G. Cornelissen and A. C. Belfroid, Environ. Sci. Technol., 2002, 36, 3525–3529 CrossRef CAS PubMed.
- Y. Gong, X. Zhao, S. E. O'Reilly, T. Qian and D. Zhao, Environ. Pollut., 2014, 185, 240 CrossRef CAS PubMed.
- Y. Gong, J. Fu, S. E. O'Reilly and D. Zhao, J. Hazard. Mater., 2015, 287, 142–150 CrossRef CAS PubMed.
- G. Pan, C. Jia, D. Zhao, C. You, H. Chen and G. Jiang, Environ. Pollut., 2009, 157, 325–330 CrossRef CAS PubMed.
- R. Thavasi, S. Jayalakshmi and I. M. Banat, Bioresour. Technol., 2011, 102, 3366–3372 CrossRef.
- R. Tecon and J. R. van der Meer, Appl. Microbiol. Biotechnol., 2010, 85, 1131–1139 CrossRef PubMed.
- X. Zhao, W. Liu, J. Fu, Z. Cai, S. E. O'Reilly and D. Zhao, Mar. Pollut. Bull., 2016, 109, 526–538 CrossRef CAS PubMed.
- D. Kupryianchyk, M. I. Rakowska, J. T. C. Grotenhuis and A. A. Koelmans, Environ. Pollut., 2012, 161, 23–29 CrossRef CAS PubMed.
- J. Zhang and M. He, J. Hazard. Mater., 2010, 184, 432–438 CrossRef CAS PubMed.
- J. Short and S. Murray, Nature, 2011, 472, 162–163 CrossRef CAS PubMed.
- E. Congiu and J. Ortega-Calvo, Environ. Sci. Technol., 2014, 48, 10869–10877 CrossRef CAS PubMed.
- P. Mani, P. Sivakumar and S. S. Balan, Achievements in the Life Sciences, 2016, vol. 10, pp. 102–110 Search PubMed.
- M. Bueno-Montes, D. Springael and J. J. Ortega-Calvo, Environ. Sci. Technol., 2011, 45, 3019–3026 CrossRef CAS PubMed.
- H. Zhu and M. D. Aitken, Environ. Sci. Technol., 2010, 44, 7260–7265 CrossRef CAS PubMed.
- E. Eek, G. Cornelissen and G. D. Breedveld, Environ. Sci. Technol., 2010, 44, 6752–6759 CrossRef CAS PubMed.
- W. Wu and H. Sun, Chemosphere, 2010, 81, 961–967 CrossRef CAS PubMed.
- E. Hasty and R. Revesz, Am. Lab., 1995, 27, 66–74 CAS.
- Y. S. Ho and G. McKay, Process Biochem., 1999, 34, 451–465 CrossRef CAS.
- G. P. Yang, X. L. Liu and J. W. Zhang, Environ. Pollut., 1998, 101, 405–414 CrossRef CAS.
- H. Yu, G. H. Huang, C. J. An and J. Wei, J. Hazard. Mater., 2011, 190, 883–890 CrossRef CAS PubMed.
- X. Zhuang, Y. Pi, M. Bao, Y. Li and X. Zheng, RSC Adv., 2015, 5, 98990–98998 RSC.
- K. V. Kumar, M. M. de Castro, M. Martinez-Escandell, M. Molina-Sabio and F. Rodriguez-Reinoso, J. Phys. Chem. C, 2010, 114, 13759–13765 CAS.
- V. K. Gupta, R. Jain and S. Varshney, J. Colloid Interface Sci., 2007, 312, 292–296 CrossRef CAS PubMed.
- A. Özcan, E. M. Öncű and A. S. Özcan, Colloids Surf., A, 2006, 277, 90–97 CrossRef.
- L. Sun and S. Zang, Sci. Total Environ., 2013, 461, 180–187 CrossRef PubMed.
- Z. Liu, J. Liu, Q. Zhu and W. Wu, Environ. Res. Lett., 2012, 7, 035302 CrossRef.
- H. Li, T. Shen and M. Bao, Mar. Pollut. Bull., 2016, 111, 358–364 CrossRef CAS PubMed.
- F. Pan, J. Ma, Y. Wang, Y. Zhang, L. Chen and W. M. Edmunds, Environ. Monit. Assess., 2013, 185, 8023–8034 CrossRef CAS PubMed.
- S. Cram, C. Siebe, R. Ortíz-Salinas and A. Herre, Soil Sediment Contam., 2004, 13, 341–360 CrossRef.
| This journal is © The Royal Society of Chemistry 2017 |

