 Open Access Article
Co–Fe hydrotalcites for efficient removal of dye pollutants via synergistic adsorption and degradation
Feifei Chen *ab,
Xi Wua,
Ran Bua and
Feng Yanga
aCollege of Chemistry and Chemical Engineering, Wuhan Textile University, Wuhan, 430073, Hubei, China. E-mail: chff1977@163.com; Fax: +86-27-59367336; Tel: +86-27-59367336
bHubei Key Laboratory of Biomass Fibers and Eco-dyeing and Finishing, Wuhan Textile University, Wuhan, 430073, Hubei, China
First published on 30th August 2017
Abstract
Layered double hydroxides (LDHs) with hydrotalcite-like structures containing Co(II) and Fe(III) were prepared and used for the removal of direct red 23 (DR23) from water solution. These CoFe–LDHs were characterized before and after reaction by XRD, FTIR, BET, and XPS. The factors affecting the adsorption and catalytic performance of the CoFe–LDHs were systematically investigated. The adsorption process followed pseudo-first-order kinetics, while equilibrium adsorption isotherm data were well fitted by the Freundlich model. Moreover, CoFe–LDHs exhibited high catalytic activity in the degradation of direct red 23 in the pH range 4–10. Under a catalyst dosage of 0.5 g L−1 and H2O2 concentration of 6.5 mmol L−1, the degradation ratio of direct red 23 was 95.6% after 30 min. The adsorption–degradation relationship in the presence of CoFe–LDHs was investigated. Intermediates were detected by GC/MS and a possible pathway for DR23 degradation was proposed. The reaction mechanism showed that cobalt ions play a critical role in the catalytic performance of CoFe–LDHs. Furthermore, the catalytic activity of CoFe–LDHs was maintained after three reaction cycles, demonstrating the recyclability and stability of this catalyst.
1. Introduction
Dye wastewater is among the most polluted types of wastewater due to its high chemical oxygen demand (COD), strong color, high pH, and low biodegradability. During the dyeing process, 10–15% of the utilized dyes are discharged into the environment. These effluents can have serious effects on the environment and public health when disposed of improperly. Moreover, different types of dyes with various chemical structures are used in dyeing and finishing plants, which complicates the treatment of textile wastewaters. Azo dyes, characterized by one or more azo groups (–N![[double bond, length as m-dash]](https://www.rsc.org/images/entities/char_e001.gif) N–), constitute over 50% of all textile dyes and have been widely used in the printing and dyeing industries. Several methods have been applied to removing dyes from wastewater, such as adsorption, coagulation, flocculation, and membrane treatment.1–4 However, conventional chemical and biological methods are not efficient means of degrading azo dyes, only transferring the dyes from the liquid phase to the solid phase or another liquid phase, which can cause secondary pollution. Biological treatments are regarded as environmentally friendly methods. However, azo dye wastewaters with BOD5/COD ratios of less than 0.3 indicate low biodegradability and unsatisfactory biodegradation.5 Therefore, it is necessary to find an effective method to remove azo dyes from wastewaters.
N–), constitute over 50% of all textile dyes and have been widely used in the printing and dyeing industries. Several methods have been applied to removing dyes from wastewater, such as adsorption, coagulation, flocculation, and membrane treatment.1–4 However, conventional chemical and biological methods are not efficient means of degrading azo dyes, only transferring the dyes from the liquid phase to the solid phase or another liquid phase, which can cause secondary pollution. Biological treatments are regarded as environmentally friendly methods. However, azo dye wastewaters with BOD5/COD ratios of less than 0.3 indicate low biodegradability and unsatisfactory biodegradation.5 Therefore, it is necessary to find an effective method to remove azo dyes from wastewaters.
Advance oxidation processes (AOPs) are effective for degrading dyes in water by destroying double bonds in the dyes molecules. Hydroxyl free radicals (˙OH) are generated in this process, which are the most powerful oxidizing species. These ˙OH species can decompose many organic pollutants to yield short-chain organic components, H2O, and CO2 as the degradation products. Fenton oxidation is a common AOP using dissolved ferrous salt as catalyst. Electron transfer between Fe2+ and H2O2 generates ˙OH radicals via a simple process that is low-cost and environmentally friendly. However, the common homogenous Fenton reaction has some significant disadvantages, such as requiring low pH values (usually pH 2–4) and generating large amounts of sludge. Therefore, it is necessary to adjust the pH before and after this reaction process to deal with the iron sludge.6,7
To overcome these drawbacks, various heterogeneous Fenton catalysts have been proposed. Active carbon, biosorbents, clay, alumina, and silica have been used as efficient supports for iron and iron oxides.8 Use of these supports enhances the dispersion of iron-containing active sites, but produces marked iron leaching. Other researchers have focused on heterogeneous Fenton catalysts containing ferrous and ferric ions, such as goethite, hematite, ferrihydrite, and pyrite.9 Furthermore, Co2+ and related cobalt salts can be used to degrade pollutants in the presence of H2O2 as an oxidant.10
Hydrotalcites are an important class of lamellar anionic clay with the general formula [MII1−xMIIIx (OH)2]x+[An−]x/n·mH2O (MII = Mg, Zn, Ni, etc. MIII = Al, Cr, etc.), in which MIII can partially substitute for MII and the positive charge is balanced by anions (carbonate, sulfate, nitrate, etc.) arranged in the interlayer. Due to the exchangeability of interlayer anions and high charge density of the laminate, hydrotalcites have attracted great interest for removing various anions. Currently, layered double hydroxides (LDHs) and modified LDHs have been employed in processes to remove pollutants from aqueous solution, including fluoride, heavy metals, humic acid, and dyes.11–13 LDHs have also been shown to act as heterogeneous Fenton catalysts to degrade organic pollutants.14,15
Oxidative degradations primarily occur on the surface of a heterogeneous catalyst. Therefore, adsorption on the catalyst surface plays a key role in the degradation process.16 Previous research has demonstrated that an increase in the affinity of the organic pollutant for the catalyst can accelerate degradation. In this work, Co–Fe LDHs (CoFe–LDHs) are synthesized and used as heterogeneous Fenton catalysts for the degradation of direct red 23 (DR23), a typical azo dye often used as a model pollutant. The features of DR23 adsorption and degradation on CoFe–LDHs were investigated under various experimental conditions. The results show that the combination of Co2+ and Fe3+ has the strongest acceleration effect on the Fenton reaction. Moreover, CoFe–LDHs have very low solubility in water and metal ions that show reduced leaching. Furthermore, the reaction mechanism for H2O2 activation on the catalyst surface is discussed.
2. Experimental
2.1 Materials
DR23 was purchased from Jiangsu Shenxin Dyestuff Chemicals Co., Ltd and used without further purification. DR23 solution was prepared by dissolving DR23 in double distilled water. FeCl3·6H2O, CoCl2·6H2O, H2O2 (30 wt%), NaOH, and Na2CO3 were of analytical grade and obtained from Sinopharm Chemical Reagent Co., Ltd.2.2 Synthesis and characterization of CoFe–LDHs
CoFe–LDHs with a Co/Fe molar ratio of 2 were prepared using the coprecipitation method. In this method, a mixture of FeCl3·6H2O and CoCl2·6H2O solutions (total metal ion concentration, 0.46 M) was combined with a precipitating solution containing 0.8 M NaOH and Na2CO3 in deionized water with vigorous stirring. During mixing, the pH was kept at around 9.0. After complete addition, the suspension was aged at 65 °C for 24 h. The preparation was carried out under a nitrogen atmosphere. The suspension was filtered, washed with a large amount of deionized water, and dried in a vacuum oven.X-ray diffraction (XRD) patterns were measured on Bruker D8 Advance X-ray diffractometer (Cu Kα source, λ = 0.154 nm) in the 2θ range of 5–80°. Fourier transform infrared (FT-IR) spectra were analyzed on a Bruker spectrometer in the region 400–4000 cm−1. Chemical compositions of the CoFe–LDHs were determined by inductively coupled plasma atomic emission spectroscopy (ICP-AES) (ICP2060T, Skyray Instrument Inc.). Specific surface areas were analyzed using the BET method. N2 adsorption–desorption was performed on a micromeritics TristarII3020 instrument at 77 K. X-ray photoelectron (XPS) spectra were recorded on ESCALAB 250Xi X-ray photoelectron spectroscope with monochromatic Al Kα (1486.6 eV). The binding energies were calibrated with respect to C 1s (284.6 eV). The zeta potentials of adsorbents were measured using a Zetasizer Nano ZS90 instrument at pH values of 4–11.
2.3 Adsorption and catalytic degradation
Typical adsorption experiments were performed with catalyst (0.1 g) in DR23 solution (100 mL, 150 mg L−1). This suspension was mechanically stirred to establish an adsorption equilibrium. After reaching equilibrium, the suspension was filtered through a 0.45 μm PES filter. Dye concentrations in the filtrate were measured using UV-visible spectrophotometry at the maximum adsorption wavelength (λ = 506 nm). Investigation of the adsorption process kinetics was performed at 25 °C. Suspensions were stirred for different times (5–600 min). To study the sorption isotherms, the adsorbents (50 mg L−1) and dye solutions at different concentrations (10–200 mg L−1) were stirred at equilibrium at 25 °C.The catalytic activities of the CoFe–LDHs were evaluated using DR23 degradation in the presence of a certain amount of H2O2. The pH was adjusted using 0.1 M HCl and NaOH solutions. At regular time intervals, the suspension was filtered through a 0.45 μm PES filter to completely remove catalyst particles. In each recyclability test, the catalyst was filtered, washed thoroughly with deionized water, and dried at 50 °C. The dye concentration in the solution was measured by UV-visible spectrophotometry (METASH, V-5600) at the maximum adsorption wavelength of the dye. Total organic carbon (TOC) was measured using a Vario TOC Elementar analyzer. TOC was calculated from the difference between total carbon and total inorganic carbon. Electron paramagnetic resonance (EPR) spectra were collected using a Bruker A300 spectrometer. The nitrone spin trap, 5,5-dimethyl-1-pyrroline N-oxide (DMPO), was used to detect free radicals. Intermediate products of DR23 were analyzed by GC/MS. The GC column was operated at 80 °C for 2 min and then increased to 250 °C at a rate of 15 °C min−1.
3. Results and discussion
3.1 Characterization of CoFe–LDHs
XRD analysis of CoFe–LDHs before and after the Fenton reaction was performed to identify the phase structure (Fig. 1(a)). In the XRD patterns of the CoFe–LDHs, diffraction signals located at 11.6°, 23.2°, 34.0°, 38.7°, 59.1°, and 60.5° were characteristic of CoFe–LDHs (PDF 50-0235). These peaks corresponded to the (003), (006), (009), (015), (110), and (113) planes of typical hydrotalcite structures. The unit cell parameters of CoFe–LDHs a and c were calculated using the equations (a = 2d110, c = 3d003). Lattice parameters a and c were 0.3124 nm and 2.3588 nm, respectively. A similar result was observed in previous research.17 Moreover, sharp and symmetric diffraction peaks at low values of 2θ angles showed that the hydrotalcite phase was highly formed and that the samples were well crystallized. The SEM image (Fig. 1(a)) of the prepared CoFe–LDHs showed a plate-like morphology, containing plates several nanometers thick with a lateral distance of approximately 5–10 μm. Moreover, SEM images of the CoFe–LDHs after the Fenton reaction showed that the lamellar structure was retained.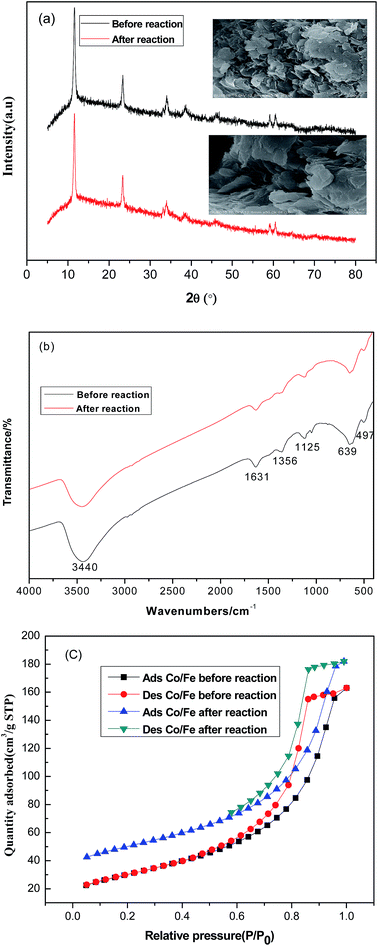 | ||
| Fig. 1 Characterization of CoFe–LDHs by (a) XRD, (b) FTIR, and (c) BET N2 adsorption–desorption before and after the Fenton reaction. | ||
FTIR spectra of CoFe–LDHs before and after the Fenton reaction are shown in Fig. 1(b). The adsorption band at around 3440 cm−1 was attributed to the stretching vibration of –OH in the layer hydroxyl groups and interlayer water molecules. The medium intensity band at 1631 cm−1 was attributed to the bonding mode of interlayer water molecules.18 The band at 1356 cm−1 was assigned to the antisymmetric stretching vibration of carbonate species.19 The peak at 1125 cm−1 was attributed to the NO3− stretching vibration in the CoFe–LDH layers.20 Bands in the region 500–700 cm−1 were attributed to metal–oxygen–metal stretching.21
The CoFe–LDHs had a BET surface area of 108 m2 g−1 both before and after the reaction (Table 1). Furthermore, the pore volume showed little change during Fenton reaction, suggesting that the CoFe–LDH framework remained intact after Fenton reaction process. Both isotherms of the CoFe–LDHs were type IV (Fig. 1(c)), which indicated that CoFe–LDHs contained a mixture of micropores and mesopores.22 Hysteresis loops were of type H1 and attributed to narrow pore size distributions and well-defined structures.23
| Catalyst | BET surface area (m2 g−1) | Pore volume (cm3 g−1) | Pore diameter (nm) |
|---|---|---|---|
| CoFe–LDHs (before reaction) | 108.9 | 0.244 | 7.45 |
| CoFe–LDHs (after reaction) | 108.7 | 0.223 | 9.62 |
These results showed that CoFe–LDHs before and after the Fenton reaction were almost the same, suggesting that there was no detectable change in their physicochemical properties during Fenton reaction.
To investigate the surface elemental composition and valence states of CoFe–LDHs, X-ray photoelectron spectroscopy (XPS) was conducted. Fig. 2(a) shows peaks from the XPS survey spectra, which were mainly attributed to C 1s, O 1s, Co 2p, and Fe 2p regions.24 Furthermore, Co/Fe ratios were almost constant before and after the Fenton reaction. Fig. 2(b) shows high-resolution Co 2p XPS spectra before and after the Fenton reaction. The Co 2p spectrum before the reaction shows two prominent peaks corresponding to Co 2p3/2 and Co 2p1/2 observed at 780.9 and 796.8 eV, respectively, along with satellite peaks. This suggested that the surface of the CoFe–LDHs was composed of Co2+. This result match reported data for Co(OH)2.24,25 After the reaction, the Co 2p3/2 peak shifted to a lower binding energy region (779.8 eV), indicating a partial valence state transformation from Co2+ to Co3+,25 which indicated that the activities of the cobalt ions were related. No obvious change was observed in the high-resolution XPS spectra of Fe 2p before and after the Fenton reaction (Fig. 2(c)). The appearance of satellite bands near the Fe 2p main peaks indicated the presence of the Fe3+ valence state. Moreover, Fig. 2(d) shows the bonding energies of Fe 2p3/2 and Fe 2p1/2 of 709.2 eV and 711.6 eV, which were ascribed to Fe2+ and Fe3+, respectively.26 This revealed the coexistence of Fe2+ and Fe3+ at the CoFe–LDH surface. The electron couples of Fe3+/Fe2+ and Co3+/Co2+ coexisted in the CoFe–LDH structure, providing notable catalytic activity. In the O 1s spectrum (Fig. 2(e)), the peak at 531.0 eV was ascribed to surface hydroxyls and the peak at 529.9 eV was attributed to bridging oxygen M (Co, Fe)–O linkages.27
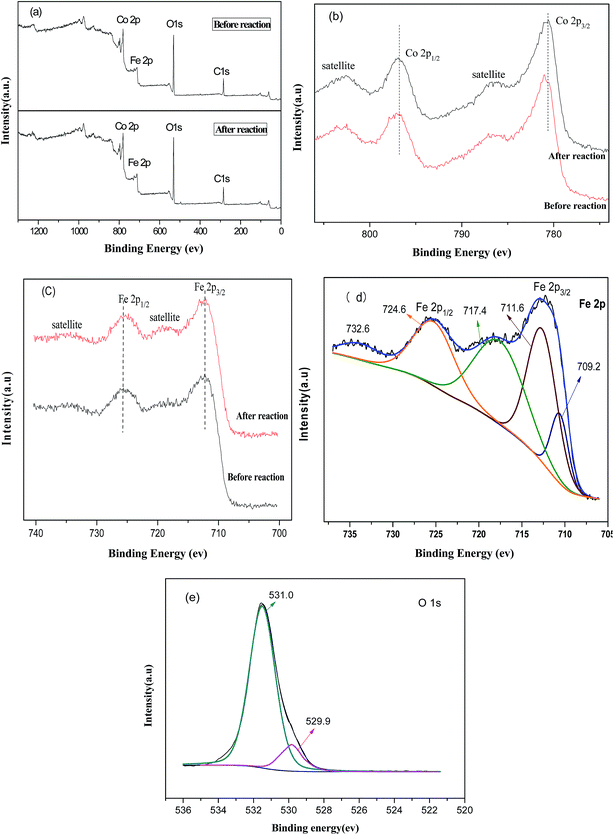 | ||
| Fig. 2 (a) Full XPS spectra of CoFe–LDHs before and after the Fenton reaction, high resolution spectra of (b) Co 2p and (c) Fe 2p, (d) XPS of Fe peaks, and (e) XPS of O peaks. | ||
3.2 Decolorization of DR23
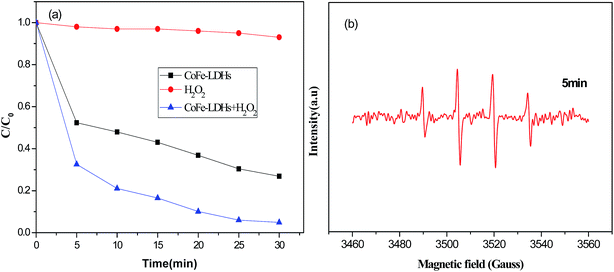
The decolorization of DR23 in solutions at neutral pH was carried out under various reaction conditions, as shown in Fig. 3(a). The results in Fig. 3(a) showed that the decolorization efficiency was almost negligible for H2O2 alone. This might be due to the low oxidation potential of hydrogen peroxide.28 Without H2O2, decolorization of DR23 with CoFe–LDHs alone was attributed to the adsorption process. DR23 decolorization reached 73% after 30 min, which confirmed that the CoFe–LDHs had a good adsorption storage capacity for DR23. When both CoFe–LDHs and H2O2 were present, excellent DR23 removal efficiency was obtained (up to 95.6% after 30 min). It was speculated that H2O2 was activated by CoFe–LDHs and the Fenton reaction occurred at the surface of the CoFe–LDHs. To prove this point, a DMPO-trapped EPR experiment was performed to detect ˙OH by measuring the intensity of the DMPO–OH adduct signal (Fig. 3(b)). Quartet lines with peak height ratios of 1![[thin space (1/6-em)]](https://www.rsc.org/images/entities/char_2009.gif) :
:![[thin space (1/6-em)]](https://www.rsc.org/images/entities/char_2009.gif) 2
2![[thin space (1/6-em)]](https://www.rsc.org/images/entities/char_2009.gif) :
:![[thin space (1/6-em)]](https://www.rsc.org/images/entities/char_2009.gif) 2
2![[thin space (1/6-em)]](https://www.rsc.org/images/entities/char_2009.gif) :
:![[thin space (1/6-em)]](https://www.rsc.org/images/entities/char_2009.gif) 1 were observed in the specific spectrum. This result confirmed that ˙OH was generated in the presence of CoFe–LDHs.29,30 These results showed that CoFe–LDHs could be used as an effective catalyst for the heterogeneous oxidation of DR23.
1 were observed in the specific spectrum. This result confirmed that ˙OH was generated in the presence of CoFe–LDHs.29,30 These results showed that CoFe–LDHs could be used as an effective catalyst for the heterogeneous oxidation of DR23.
Pseudo-first-order kinetic equation:
 | (1) |
Pseudo-second-order kinetic equation:
 | (2) |
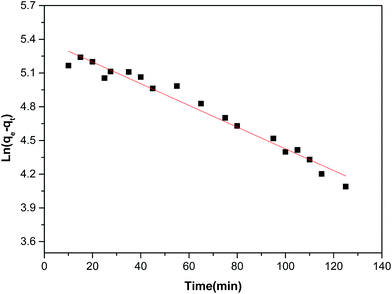
As shown in Fig. 4 and Table 2, the high correlation coefficients (0.97) suggested that the adsorption process followed a pseudo-first-order kinetic model. Furthermore, the difference between the calculated qe obtained from pseudo-first-order kinetic equation and the experimental qe was small, meaning that the pseudo-first-order kinetic model was reasonable. The DR23 adsorption capacity was found to be above 200 mg g−1, which indicated that CoFe–LDHs are efficient materials for the adsorption of DR23 from aqueous solutions.
| Pseudo-first-order model | qe cal (mg g−1) | 223.2 |
| qe Exp (mg g−1) | 210.0 | |
| K1 (min−1) | 0.01052 | |
| R2 | 0.97 | |
| Pseudo-second-order model | qe cal (mg g−1) | 45.5 |
| qe Exp (mg g−1) | 210.0 | |
| K2 (g mg−1 min−1) | 6.24 × 10⁻⁴ | |
| R2 | 0.79 |
Equilibrium adsorption data were explored using Langmuir and Freundlich models. The Langmuir model is given by the equation:
 | (3) |
The Freundlich model is given by the equation:
 | (4) |
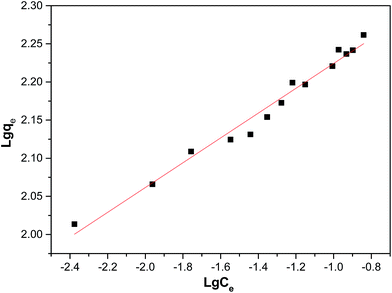
The isotherm parameters were calculated from the intercept and slope of the plot and are presented in Table 3. Linear plots of the Freundlich models of the DR23 adsorptions are shown in Fig. 5. According to the correlation coefficient values, the adsorption data were conformed better to the Freundlich model than the Langmuir model, perhaps due to the nonuniform distribution of active sites on the CoFe–LDH surface.
| Model | Parameters | |
|---|---|---|
| Langmuir model | qmax (mg g−1) | 173.3 |
| KL (L mg−1) | 6.22 × 10⁻³ | |
| R2 | 0.62 | |
| Freundlich model | KF (mg1/n L1/n g−1) | 10.8 |
| 1/n | 0.1627 | |
| R2 | 0.98 |
| ˙OH + H2O2 → ˙HO2 + H2O | (5) |
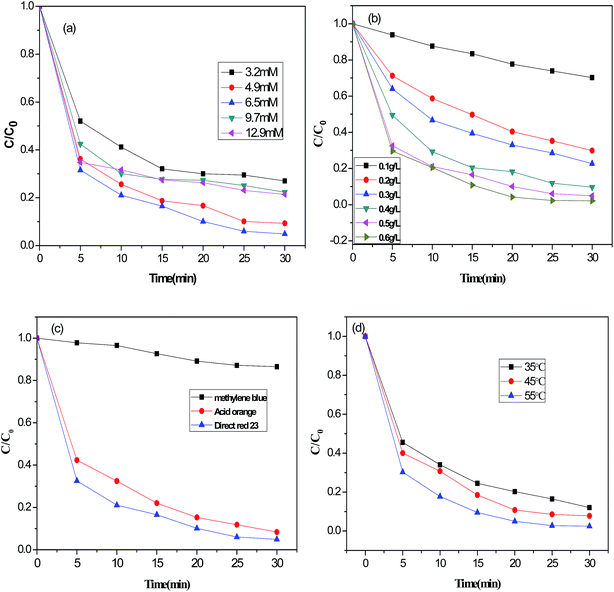
To achieve a high degradation efficiency and prevent the occurrence of radical scavengers, an H2O2 concentration of 6.5 mM was adopted for further experiments.
Fig. 6(b) shows the effect of CoFe–LDH dosage on DR23 degradation under the following conditions: H2O2 concentration, 6.5 mM; initial dye concentration, 0.02 g L−1; neutral pH. DR23 degradation increased sharply with increasing catalyst amount from 0.1 to 0.5 g L−1. This enhanced degradation might be due to the increase in concentration of active sites of CoFe–LDHs. Further increasing the amount of CoFe–LDHs resulted in a slight increase. It was speculated that using too much CoFe–LDHs generated excessive Fe3+ irons, which might eliminate H2O2.31,32
Furthermore, different types of dyes (anionic and cationic dyes) were used in the Fenton reaction. Anionic dyes (acid orange, DR23) and cationic dyes (methylene blue) were adopted in the following experiments and the results are shown in Fig. 6(c). The degradation efficiencies of acid orange and DR23 were much higher than that of methylene blue. To explain this, it is necessary to understand the surface charge on the CoFe–LDHs and dyes. The surface charge of LDHs is positive due to the partial replacement of divalent metal ions with trivalent metal ions. Methylene blue with positive charges was difficult to adsorb on the surface of CoFe–LDHs because of electrostatic repulsion. Improving the degradation efficiency of cationic dyes by changing the surface properties of CoFe–LDHs should be further investigated in future.
The effect of reaction temperature on DR23 degradation was also tested, and the results are depicted in Fig. 6(d). The degradation performance of the CoFe–LDH catalyst increased with increasing reaction temperature, perhaps because the number of ˙OH radicals increased at a higher temperature, leading to faster discoloration of DR23.33
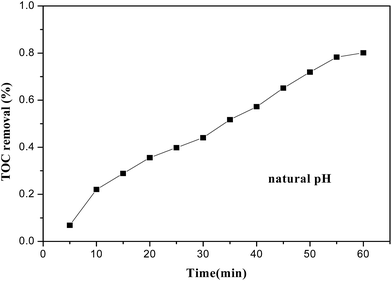
DR23 mineralization, related to TOC removal from the dye aqueous solution, is shown in Fig. 7. Dye mineralization was slower than dye decolorization. For instance, DR23 decolorization was about 95.6% after 30 min, while only 45% of DR23 was mineralized after 30 min. This occurred because intermediate products were produced during the dye degradation process, resulting in a longer reaction time being needed. After 60 min, TOC removal reached about 80%. These results indicated that the CoFe–LDH catalyst could effectively mineralize DR23 into CO2 and H2O.
![[triple bond, length as m-dash]](https://www.rsc.org/images/entities/char_e002.gif) Co2+ →
Co2+ → ![[triple bond, length as m-dash]](https://www.rsc.org/images/entities/char_e002.gif) Co3+ would be thermodynamically favorable in a basic medium
Co3+ would be thermodynamically favorable in a basic medium  , but thermodynamically unfavorable in an acidic medium
  .34 In contrast, LDH layers were built up by condensation of the octahedral unit, OH groups were shared by three octahedral cations (Co2+ and Fe3+), and Co–OH was formed in the CoFe–LDH layers.35 It could be deduced that an alkaline environment was beneficial to
 ![[triple bond, length as m-dash]](https://www.rsc.org/images/entities/char_e002.gif) Co2+/
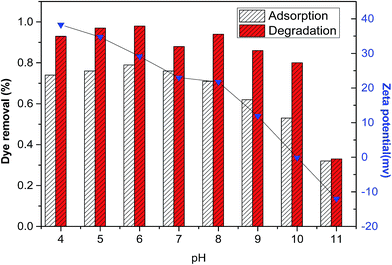
Co2+/![[triple bond, length as m-dash]](https://www.rsc.org/images/entities/char_e002.gif) Co3+ conversion (eqn (6)). This compensated for the disadvantage in adsorption with increasing pH values. In brief, this showed that adsorption was beneficial for promoting Fenton reaction, but there was no linear relationship between adsorption and degradation. Furthermore, this result demonstrated that the CoFe–LDHs could be used to degrade DR23 over a wide pH range, making CoFe–LDHs advantageous regarding the working environment.
Co3+ conversion (eqn (6)). This compensated for the disadvantage in adsorption with increasing pH values. In brief, this showed that adsorption was beneficial for promoting Fenton reaction, but there was no linear relationship between adsorption and degradation. Furthermore, this result demonstrated that the CoFe–LDHs could be used to degrade DR23 over a wide pH range, making CoFe–LDHs advantageous regarding the working environment.
3.3 Mechanism of adsorption and catalytic oxidations
Based on the above results, a possible mechanism for DR23 adsorption on CoFe–LDHs was proposed. There were three main interaction forces between DR23 and CoFe–LDHs. The first was the electrostatic attraction between the anionic sulfate groups and positively charged CoFe–LDH surface. The second was hydrogen bonds between the sulfate groups and hydroxyl groups on the CoFe–LDH surface. Furthermore, ion exchange process between the interlayer anions of LDHs and anionic groups of dyes might exist. Fig. 8 shows that there was an obvious change in DR23 removal by CoFe–LDHs with changing pH. This indicated that electrostatic interaction between the DR23 and CoFe–LDHs was predominant.The main processes involved in the catalytic activation of H2O2 by CoFe–LDHs were proposed as follows. The activation mechanism of H2O2 by cobalt ions was attributed to the redox pairs ![[triple bond, length as m-dash]](https://www.rsc.org/images/entities/char_e002.gif) Co2+/
Co2+/![[triple bond, length as m-dash]](https://www.rsc.org/images/entities/char_e002.gif) Co3+.36,37
Co3+.36,37
![[triple bond, length as m-dash]](https://www.rsc.org/images/entities/char_e002.gif) Co2+ + H2O2 → Co2+ + H2O2 → ![[triple bond, length as m-dash]](https://www.rsc.org/images/entities/char_e002.gif) Co3+ + ˙OH + OH− Co3+ + ˙OH + OH−
| (6) |
| H2O2 + OH− → OOH− + H2O | (7) |
![[triple bond, length as m-dash]](https://www.rsc.org/images/entities/char_e002.gif) Co3+ + OOH− → Co3+ + OOH− → ![[triple bond, length as m-dash]](https://www.rsc.org/images/entities/char_e002.gif) Co2+˙OOH Co2+˙OOH
| (8) |
![[triple bond, length as m-dash]](https://www.rsc.org/images/entities/char_e002.gif) Co2+˙OOH → Co2+˙OOH → ![[triple bond, length as m-dash]](https://www.rsc.org/images/entities/char_e002.gif) Co2+ + ˙O2H Co2+ + ˙O2H
| (9) |
![[triple bond, length as m-dash]](https://www.rsc.org/images/entities/char_e002.gif) represents surface species. As previously mentioned, the CoFe–LDH catalyst showed superior catalytic performance at pH values in the range 4–10 (Fig. 8). Similar results have been reported previously.33 The mechanism above further explained that increasing the initial pH values facilitated H2O2 activation, generating a larger number of OOH−, which accelerated the reduction of Co3+ (eqn (7)–(9)). However, a further increase in the initial pH (>10) led to H2O2 decomposition into water and oxygen. This was consistent with the results shown in Fig. 8.
represents surface species. As previously mentioned, the CoFe–LDH catalyst showed superior catalytic performance at pH values in the range 4–10 (Fig. 8). Similar results have been reported previously.33 The mechanism above further explained that increasing the initial pH values facilitated H2O2 activation, generating a larger number of OOH−, which accelerated the reduction of Co3+ (eqn (7)–(9)). However, a further increase in the initial pH (>10) led to H2O2 decomposition into water and oxygen. This was consistent with the results shown in Fig. 8.
In the CoFe–LDH catalysts, iron ions played an important role in dye degradation. The mechanism of the Fe3+-initiated Fenton reaction can be described by the following reactions:38,39
![[triple bond, length as m-dash]](https://www.rsc.org/images/entities/char_e002.gif) Fe3+ + H2O2 → Fe3+ + H2O2 → ![[triple bond, length as m-dash]](https://www.rsc.org/images/entities/char_e002.gif) Fe2+ + HO2˙ + H+ Fe2+ + HO2˙ + H+
| (10) |
![[triple bond, length as m-dash]](https://www.rsc.org/images/entities/char_e002.gif) Fe3+ + HO2˙ → Fe3+ + HO2˙ → ![[triple bond, length as m-dash]](https://www.rsc.org/images/entities/char_e002.gif) Fe2+ + H+ + O2˙− Fe2+ + H+ + O2˙−
| (11) |
![[triple bond, length as m-dash]](https://www.rsc.org/images/entities/char_e002.gif) Fe2+ + H2O2 → Fe2+ + H2O2 → ![[triple bond, length as m-dash]](https://www.rsc.org/images/entities/char_e002.gif) Fe3+ + ˙OH + OH− Fe3+ + ˙OH + OH−
| (12) |
It should be noted that iron ions facilitate the reduction of ![[triple bond, length as m-dash]](https://www.rsc.org/images/entities/char_e002.gif) Co3+. Considering the standard reduction potentials of Co2+/Co3+, the reduction of Co3+ by Fe2+ was thermodynamically favorable (eqn (13)),39 meaning that
Co3+. Considering the standard reduction potentials of Co2+/Co3+, the reduction of Co3+ by Fe2+ was thermodynamically favorable (eqn (13)),39 meaning that ![[triple bond, length as m-dash]](https://www.rsc.org/images/entities/char_e002.gif) Co2+/
Co2+/![[triple bond, length as m-dash]](https://www.rsc.org/images/entities/char_e002.gif) Co3+ and
Co3+ and ![[triple bond, length as m-dash]](https://www.rsc.org/images/entities/char_e002.gif) Fe2+/
Fe2+/![[triple bond, length as m-dash]](https://www.rsc.org/images/entities/char_e002.gif) Fe3+ were redox couples, as also evidenced by XPS (Fig. 2). The efficient regeneration of Co2+ at the catalyst surface would also be responsible for the superior catalytic activity of the CoFe–LDHs.
Fe3+ were redox couples, as also evidenced by XPS (Fig. 2). The efficient regeneration of Co2+ at the catalyst surface would also be responsible for the superior catalytic activity of the CoFe–LDHs.
| Co3+ + Fe2+ → Fe3+ + Co2+ | (13) |
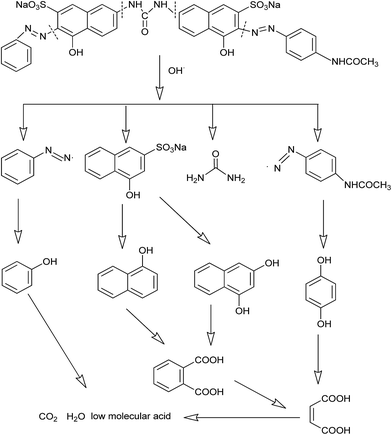
Organic intermediates generated during the Fenton reaction were detected by the GC/MS, as shown in Table 4. Based on the determined intermediates, a possible degradation reaction mechanism was speculated, as shown in Fig. 9. C–N bond cleavage was the first step of DR23 degradation, forming species including 1-naphthol, phthalic acid, urea, and hydroquinone. These intermediates were then further cleaved to form maleic acid and, finally, carboxylic acids, H2O, and CO2. The degradation products obtained in this work were consistent with those reported in the literature.40
3.4 Catalyst reusability and stability
The recyclability of the CoFe–LDH catalyst was assessed during three consecutive cycles. As shown in Fig. 10, the degradation efficiency of DR23 remained almost unchanged, indicating good catalyst stability and reusability. Moreover, the excellent chemical stability of the CoFe–LDH was further confirmed by XRD, FTIR, and BET (Fig. 1). No considerable change was observed after the Fenton reaction, further demonstrating the catalyst durability. The concentration of leached cobalt in the solution was less than 1 mg L−1 at natural pH after reaction for 30 min, which was lower than the permissible limit imposed by the Chinese government. No iron leaching was detected. The results indicated CoFe–LDH could behave as a stable and efficient heterogeneous catalyst for the removal of DR23.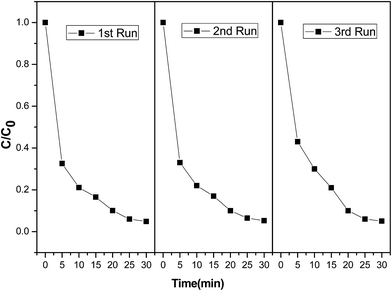 | ||
| Fig. 10 DR23 degradation efficiencies of recycled CoFe–LDHs (reaction conditions: temperature, 25 °C; H2O2 concentration, 6.5 mM; catalyst loading, 0.5 g L−1; initial dye concentration, 0.02 g L−1). | ||
4. Conclusions
CoFe–LDH was synthesized and tested as an adsorbent and heterogeneous catalyst for the removal of DR23 from aqueous solution. The degradation and adsorption of DR23 were studied in aqueous solutions, and the effects of initial solution pH on the adsorption and degradation characteristics of DR23 on CoFe–LDH were investigated. The adsorption capacity decreased with increasing solution pH, but the variation in DR23 degradation with changing pH was relatively small. The experimental results showed that CoFe–LDH can be used to degrade DR23 over a wide pH range. XPS studies of the catalysts showed that![[triple bond, length as m-dash]](https://www.rsc.org/images/entities/char_e002.gif) Co2+/
Co2+/![[triple bond, length as m-dash]](https://www.rsc.org/images/entities/char_e002.gif) Co3+ and
Co3+ and ![[triple bond, length as m-dash]](https://www.rsc.org/images/entities/char_e002.gif) Fe2+/
Fe2+/![[triple bond, length as m-dash]](https://www.rsc.org/images/entities/char_e002.gif) Fe3+ were the active catalyst species. Redox cycling during the Fenton reaction was identified and reaction mechanisms on CoFe–LDH were proposed. The metal leaching of CoFe–LDH was quite limited. These findings suggested that CoFe–LDH was a promising catalyst for dye adsorption and degradation in aqueous solution.
Fe3+ were the active catalyst species. Redox cycling during the Fenton reaction was identified and reaction mechanisms on CoFe–LDH were proposed. The metal leaching of CoFe–LDH was quite limited. These findings suggested that CoFe–LDH was a promising catalyst for dye adsorption and degradation in aqueous solution.
Conflicts of interest
There are no conflicts to declare.Acknowledgements
This work was supported by the Natural Science Foundation of Hubei Province, China (Grant No. 2016CFB577) and Educational Commission of Hubei Province of China (Grant No. 20171601).References
- T. A. Nguyen and R. S. Juang, Chem. Eng. J., 2013, 219, 109–117 CrossRef CAS.
- Q. C. Ge, P. Wang, C. F. Wan and T. S. Chung, Environ. Sci. Technol., 2012, 46, 6236–6243 CrossRef CAS PubMed.
- L. Yao, L. Z. Zhang, R. Wang, S. R. Chou and Z. L. Dong, J. Hazard. Mater., 2016, 301, 462–470 CrossRef CAS PubMed.
- V. Rizzi, F. D'Agostino, P. Fini, P. Semeraro and P. Cosma, Dyes Pigm., 2017, 140, 480–490 CrossRef CAS.
- L. Bilinska, M. Gmurek and S. Ledakowicz, Chem. Eng. J., 2016, 306, 550–559 CrossRef CAS.
- E. G. Garrido-Ramirez, B. K. G. Theng and M. L. Mora, Appl. Clay Sci., 2010, 47, 182–192 CrossRef CAS.
- M. R. Carrasco-Diaz, E. Castillejos-Lopez, A. Cerpa-Naranjo and M. L. Rojas-Cervantes, Chem. Eng. J., 2016, 304, 408–418 CrossRef CAS.
- J. Y. Feng, X. J. Hu and P. L. Yue, Environ. Sci. Technol., 2004, 38, 269–275 CrossRef CAS PubMed.
- P. V. Nidheesh, RSC Adv., 2015, 5, 40552–40577 RSC.
- X. X. Li, Z. D. Xiong, X. C. Ruan, D. S. Xia, Q. F. Zeng and A. H. Xu, Appl. Catal., A, 2012, 411–412, 24–30 CrossRef CAS.
- P. Koilraj and S. Kannan, Chem. Eng. J., 2013, 234, 406–415 CrossRef CAS.
- L. J. Ma, Q. Wang, S. M. Islam, Y. C. Liu, S. L. Ma and M. G. Kanatzidis, J. Am. Chem. Soc., 2016, 138, 2858–2866 CrossRef CAS PubMed.
- A. R. Auxilio, P. C. Andrews, P. C. Junk and L. Spiccia, Dyes Pigm., 2009, 81, 103–112 CrossRef CAS.
- J. F. Bai, Y. Liu, X. H. Yin, H. T. Duan and J. H. Ma, Appl. Surf. Sci., 2017, 416, 45–50 CrossRef CAS.
- X. X. Tang and Y. Liu, Dyes Pigment, 2016, 134, 397–408 CrossRef CAS.
- H. T. Lu, Z. l. Zhu, H. Zhang, J. Y. Zhu, Y. L. Qiu, L. Y. Zhu and S. Kuppers, ACS Appl. Mater. Interfaces, 2016, 8, 25343–25352 CAS.
- R. Extremera, I. Pavlovic, M. R. Perez and C. Barriga, Chem. Eng. J., 2012, 213, 392–400 CrossRef CAS.
- X. X. Tang, Y. Liu and S. H. Li, RSC Adv., 2016, 6, 80501–80510 RSC.
- A. Jawad, Y. B. Li, X. Y. Lu, Z. Q. Chen, W. D. Liu and G. C. Yin, J. Hazard. Mater., 2015, 289, 165–173 CrossRef CAS PubMed.
- H. S. Zhang, J. Wang, B. Zhang, Q. Liu, S. N. Li, H. J. Yan and L. H. Liu, Colloids Surf., A, 2014, 444, 129–137 CrossRef CAS.
- N. B. H. Abdelkader, A. Bentouami, Z. Derriche, N. Bettahar and L. C. de Menorval, Chem. Eng. J., 2011, 169, 231–238 CrossRef.
- Priyanka and V. C. Srivastava, Ind. Eng. Chem. Res., 2013, 52, 17790–17799 CrossRef CAS.
- S. J. Xia, F. X. Liu, Z. M. Ni, W. Shi, J. L. Xue and P. P. Qian, Appl. Catal., B, 2014, 144, 570–579 CrossRef CAS.
- K. Y. Ma, J. P. Cheng, J. Zhang, M. Li, F. Liu and X. B. Zhang, Electrochim. Acta, 2016, 198, 231–240 CrossRef CAS.
- R. Z. Ma, J. B. Liang, K. Takada and T. Sasaki, J. Am. Chem. Soc., 2011, 133, 613–620 CrossRef CAS PubMed.
- X. N. Li, J. Y. Liu, A. I. Rykov, H. X. Han, C. Z. Jin, X. Liu and J. H. Wang, Appl. Catal., B, 2015, 179, 196–205 CrossRef CAS.
- Y. P. Zhu, T. Z. Ren and Z. Y. Yuan, RSC Adv., 2015, 5, 7628–7636 RSC.
- H. Hassan and B. H. Hameed, Chem. Eng. J., 2011, 171, 912–918 CrossRef CAS.
- L. W. Chen, J. Ma, X. C. Li, J. Zhang, J. Y. Fang, Y. H. Guan and P. C. Xie, Environ. Sci. Technol., 2011, 45, 3925–3930 CrossRef CAS PubMed.
- X. J. Yang, X. M. Xu, J. Xu and Y. F. Han, J. Am. Chem. Soc., 2013, 135, 16058–16061 CrossRef CAS PubMed.
- Z. Jia, W. C. Zhang, W. M. Wang, D. Habibi and L. C. Zhang, Appl. Catal., B, 2016, 192, 46–56 CrossRef CAS.
- L. Singh, P. Rekha and S. Chand, Sep. Purif. Technol., 2016, 170, 321–336 CrossRef CAS.
- J. S. Mu, L. Zhang, M. Zhao and Y. Wang, J. Mol. Catal. A: Chem., 2013, 378, 30–37 CrossRef CAS.
- M. d. Arco, R. Trujillano and V. Rives, J. Mater. Chem., 1998, 8, 761–767 RSC.
- J. Perez-Ramirez, G. Mul, F. Kapteijn and J. A. Moulijn, J. Mater. Chem., 2001, 11, 2529–2536 RSC.
- Y. Shen, Z. H. Zhang and K. J. Xiao, RSC Adv., 2015, 5, 91846–91854 RSC.
- W. R. P. Barros, J. R. Steter, M. R. V. Lanza and A. C. Tavares, Appl. Catal., B, 2016, 180, 434–441 CrossRef CAS.
- Y. Wang, X. H. Lin, Z. Z. Shao, D. P. Shan, G. Z. Li and A. Irini, Chem. Eng. J., 2017, 313, 938–945 CrossRef CAS.
- Y. J. Yao, Y. M. Cai, G. D. Wu, F. Y. Wei, X. Y. Li, H. Chen and S. B. Wang, J. Hazard. Mater., 2015, 296, 128–137 CrossRef CAS PubMed.
- S. Song, H. P. Ying, Z. Q. He and J. M. Chen, Chemosphere, 2007, 66, 1782–1788 CrossRef CAS PubMed.
| This journal is © The Royal Society of Chemistry 2017 |

