 Open Access Article
Composite with TiO2 and extension of discharge voltage range for capacity enhancement of a Li4Ti5O12 battery†
Meng Ding,
Hui Liu *,
Xiangnan Zhao,
Lingyan Pang*,
Lu Deng and
Mengyan Li
School of Materials Science and Engineering, Shaanxi University of Science and Technology, Xi'an 710021, P. R. China. E-mail: liuhui@sust.edu.cn; hxplyl@126.com; Fax: +86-29-86177018; Tel: +86-29-86177018
First published on 12th September 2017
Abstract
Herein, nanosheet-assembled Li4Ti5O12–TiO2 (LTO–TiO2) microspheres were successfully obtained via a hydrothermal method. The structure and morphology of the composite were characterized using X-ray diffraction (XRD), field emission scanning electron microscopy (SEM), and transmission electron microscopy (TEM). Subsequently, the electrochemical performance of the product was determined by an electrochemical workstation and a LAND CT2001A (Land, China) battery testing system. The experimental results demonstrated that both the formation of a composite with anatase TiO2 and the extension of the discharge voltage range were beneficial for the enhancement of the specific capacity of Li4Ti5O12. When the discharge cut-off voltage was decreased to 0 V, the LTO–TiO2 composites exhibited a higher discharge specific capacity of 411.3 mA h g−1 during the first cycle in comparison with pure LTO, which was mainly attributed to the intercalation of more lithium ions into the LTO–TiO2 composites at a low potential (<1.0 V). Moreover, owing to the introduction of anatase TiO2, the Li+ charge/discharge process at a higher potential of around 2.0 V (vs. Li/Li+) was also favorable for the enhancement of the capacity of LTO composites and their applied voltage range. In addition, the LTO–TiO2 composites exhibited high electronic conductivity and lithium ion diffusion coefficients and excellent coulombic efficiency.
1. Introduction
Lithium-ion batteries play an important role as energy storage solutions for portable devices, automotive electronics, and renewable energy systems because of their many merits such as a high working voltage, high energy density, large capacity, long cycle life, low self-discharge rate, absence of memory effect, and environmental friendliness.1–6 The electrochemical properties of lithium-ion batteries are strongly dependent on the electrode materials. Electrode materials with high safety and excellent high-current charging/discharging properties are of considerable importance for high-power LIBs.7 Therefore, the research and promotion of new types of electrode material as anode materials is one of the key technologies for promoting the progress of lithium-ion battery technology.The spinel Li4Ti5O12 (LTO) has attracted significant attention because of its intrinsic characteristics such as a wide range of raw materials, low cost, good thermal stability, high specific energy, and good recycling performance.8 In comparison with commercial graphite materials, Li4Ti5O12 materials display greater advantages. First, they have a high insertion potential at around 1.55 V (vs. Li/Li+),9 which can avoid the formation of SEI layers and electroplating of lithium. Second, they are zero-strain materials,10–13 which can result in negligible changes in the unit cell volume during the intercalation and deintercalation of lithium ions. Thus, spinel Li4Ti5O12 has become one of the most important anode materials for lithium-ion batteries. However, the kinetic problems due to its low electrical conductivity (ca. 10−13 S cm−1)14 and lithium diffusion coefficient (from ca. 10−9 to 10−16 cm2 s−1)15 limit its full capacity at high charge–discharge rates;8 this results in a relatively low theoretical capacity of the LTO battery (175 mA h g−1),16–18 corresponding to the intercalation of three lithium ions into LTO in the voltage range of 1.0–2.5 V, which has been quoted by almost all studies reported on LTO batteries. Currently, significant efforts are being devoted towards improving the specific capacity of Li4Ti5O12 (175 mA h g−1) in LTO-based batteries. Most of the studies have been focused on changing the structure of the material to improve its capacity such as via doping with other elements and forming composites with other high-capacity materials.3,19 In particular, in recent years, compositing LTO with other anode materials (e.g., graphene),1 Fe2O3 (ref. 20), and TiO2 (ref. 21 and 22) has been seen as an important and efficient approach towards improving the performance of LTO electrodes. Among these materials, TiO2 is an attractive anode material due to its ability of fast lithium insertion/extraction, high insertion potential (2.0 V vs. Li/Li+), and low volume change (3–4%) during the charge/discharge process. Therefore, compositing LTO with TiO2 is deemed to be an advisable way to improve the capacity of LTO batteries.23–25
Furthermore, in addition to the formation of composites of LTO with other anode materials, the extension of the discharge voltage range is also a popular research topic for improving the capacity of LTO batteries. Recently, most of the studies have been focused on the voltage range of 1.0–2.5 V, but in other studies reported on the electrochemical characteristics of LTO electrodes, the voltage was lower than 1.0 V. Some studies indicate that widening of the discharge voltage range can increase the capacity of LTO at low current densities. Ge et al., Yao et al., and Ahn et al. reported the discharge of Li4Ti5O12 down to a near-zero voltage and noted a considerable capacity contribution to the total reversible capacity of Li4Ti5O12 at discharge voltages of less than 0.5 V. This total reversible capacity, which approached 250 mA h g−1, exceeded the generally accepted theoretical capacity of 175 mA h g−1 (ref. 3 and 26–30). Ge et al.28 also suggested that the theoretical capacity of Li4Ti5O12 is 293 mA h g−1 (2.5–0.01 V) and is limited by the number of tetravalent titanium ions and not the number of octahedral or tetrahedral sites available to accommodate lithium ions. The final composition after lithium intercalation was suggested to be Li9Ti5O12.31 The availability of the tetrahedral 8a sites for lithium-ion storage was also supported by Borghols et al. during their investigation on the size effects in Li4+xTi5O12 spinel.28,31
In this study, we proposed a new approach that comprised both the formation of a composite of LTO with TiO2 and the extension of the discharge voltage range to improve the specific capacity of Li4Ti5O12. LTO–TiO2 composite materials were synthesized by a hydrothermal method. We systematically investigated the effect of the formation of a composite of LTO with TiO2 and the cut-off voltage range (i.e., 1.0–2.5, 0.5–2.5, and 0–2.5 V) on the capacity improvement of LTO and the influence of LTO on the conductivity, ion transport, cycling stability, and coulombic efficiency.
2. Experimental
2.1 Materials and reagents
All chemicals were of analytical grade and used without further purification. Tetrabutyl titanate (TBOT) was purchased from Beijing Chemical Reagent Co., Ltd., China. Lithium hydroxide (LiOH) was purchased from Tianjin Chemical Reagent Co., Ltd., China. Hydrogen peroxide (H2O2, 30%) was obtained from Xi'an Chemical Reagent Co., Ltd., China. Acetylene black and polyvinylidene difluoride (PVDF) were purchased from Sigma Chemical Reagent Co., Ltd. Deionized water and ethanol were used for all treatment processes.2.2 Synthesis of LTO–TiO2 composites
LTO–TiO2 composites were synthesized using a simple one-step hydrothermal method. In a typical procedure, 5 mL H2O2 aqueous solution (30%) was added to 100 mL of 0.5 M LiOH solution, and then, 3.4 mL TBOT was added dropwise and the mixture was stirred for 3 h. After continuous stirring for 3 h, the reactions were completed. Next, the homogeneous solution was transferred into two 80 mL Teflon-lined autoclaves that were held at 130 °C for 18 h. After this, the faint white precipitate was obtained by centrifugation, washed three times with distilled water and ethanol, and then dried in an oven at 60 °C for 12 h. Finally, the dried precipitate was calcined at a heating rate of 3 °C min−1 at 500 °C for 3 h in air.In addition, pure Li4Ti5O12 was synthesized using a similar process by prolonging the hydrothermal reaction time to 36 h.
2.3 Structural characterization
The products were analyzed by X-ray diffraction (XRD, D/max-2200) using CuKα radiation of wavelength λ = 0.15418 nm at 40 kV and 40 mA. The morphology and microstructure of the as-prepared products were studied by a field-emission scanning electron microscope (FE-SEM, Hitachi S-4800). A transmission electron microscope (TEM, JEOL JEM-2100F) and high-resolution TEM with an accelerating voltage of 200 kV were used for morphological and structural analysis.2.4 Electrochemical measurements
The electrochemical performance of the LTO–TiO2 composite electrode was measured using a half-cell lithium-ion battery (LIB) configuration. The working electrode material slurry was prepared by mixing LTO–TiO2 composites, acetylene black, and polyvinylidene difluoride in a weight ratio of 80![[thin space (1/6-em)]](https://www.rsc.org/images/entities/char_2009.gif) :
:![[thin space (1/6-em)]](https://www.rsc.org/images/entities/char_2009.gif) 10
10![[thin space (1/6-em)]](https://www.rsc.org/images/entities/char_2009.gif) :
:![[thin space (1/6-em)]](https://www.rsc.org/images/entities/char_2009.gif) 10. Several drops of the 1-methyl-2-pyrrolidinone solvent were added to the mixture to prepare the active material slurry. The slurry was coated onto a copper foil current collector and dried at 110 °C for 12 h. Lithium wafers were used as the counter electrode and reference electrode, and 1.0 M LiPF6 solution in a mixture of ethylene carbonate/dimethyl carbonate/ethyl methyl carbonate (EC/DMC/EMC) (1
10. Several drops of the 1-methyl-2-pyrrolidinone solvent were added to the mixture to prepare the active material slurry. The slurry was coated onto a copper foil current collector and dried at 110 °C for 12 h. Lithium wafers were used as the counter electrode and reference electrode, and 1.0 M LiPF6 solution in a mixture of ethylene carbonate/dimethyl carbonate/ethyl methyl carbonate (EC/DMC/EMC) (1![[thin space (1/6-em)]](https://www.rsc.org/images/entities/char_2009.gif) :
:![[thin space (1/6-em)]](https://www.rsc.org/images/entities/char_2009.gif) 1
1![[thin space (1/6-em)]](https://www.rsc.org/images/entities/char_2009.gif) :
:![[thin space (1/6-em)]](https://www.rsc.org/images/entities/char_2009.gif) 1 by volume) was used as the electrolyte. Coin cells (CR2032) with a Li foil as the cathode and LTO–TiO2 composites as the anode were assembled in an Ar-filled glove box to test the electrochemical performance of the as-prepared electrodes. Galvanostatic charge/discharge cycling was carried out using a LAND CT2001A (Land, China) battery testing system between 1.0 and 2.5, 0.5 and 2.5, and 0–2.5 V vs. Li+/Li at various current densities at room temperature. Cyclic voltammetry measurements were carried out using an electrochemical workstation (CHI660D) in the potential ranges of 1.0–2.5, 0.5–2.5, and 0–2.5 V vs. Li+/Li at a scan rate of 0.1 mV s−1. These cells are hereinafter referred to as LTO-T-1, LTO-T-0.5, and LTO-T-0. Electrochemical impedance spectroscopy (EIS) measurements were carried out using an electrochemical workstation (CHI660D) in the frequency range from 10−2 to 105 Hz.
1 by volume) was used as the electrolyte. Coin cells (CR2032) with a Li foil as the cathode and LTO–TiO2 composites as the anode were assembled in an Ar-filled glove box to test the electrochemical performance of the as-prepared electrodes. Galvanostatic charge/discharge cycling was carried out using a LAND CT2001A (Land, China) battery testing system between 1.0 and 2.5, 0.5 and 2.5, and 0–2.5 V vs. Li+/Li at various current densities at room temperature. Cyclic voltammetry measurements were carried out using an electrochemical workstation (CHI660D) in the potential ranges of 1.0–2.5, 0.5–2.5, and 0–2.5 V vs. Li+/Li at a scan rate of 0.1 mV s−1. These cells are hereinafter referred to as LTO-T-1, LTO-T-0.5, and LTO-T-0. Electrochemical impedance spectroscopy (EIS) measurements were carried out using an electrochemical workstation (CHI660D) in the frequency range from 10−2 to 105 Hz.
3. Results and discussion
3.1 Characterization of the LTO–TiO2 composites
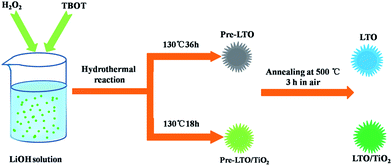
Fig. 1 illustrates the formation mechanism of the LTO microsphere structure. When TBOT was added dropwise to the LiOH solution with the assistance of H2O2, the Ti(OH)4 (eqn (1)) nuclei were immediately formed due to the hydrolysis of TBOT. TiO2 (eqn (2)) could further form because of the hydrolysis of Ti(OH)4, and subsequently, a transparent yellow solution was obtained. Simultaneously, OH− anions in the precursor solution retarded the hydrolysis of TBOT and thus reduced the aggregation of TiO2 and led to the formation of monodisperse TiO2 nanospheres. During the hydrothermal treatment, Li-rich Li1.81H0.19Ti2O5·nH2O was formed in the presence of OH−, H2O, and Li+ via a dehydration reaction. Finally, the Li4Ti5O12/TiO2 nanocomposite was obtained by a post-annealing process during which Li4Ti5O12 formed in Li-rich regions, whereas TiO2 formed in Li-poor regions.| Ti(OC4H9)4 + 4H2O → Ti(OH)4 + 4C4H9 | (1) |
| Ti(OH)4 → TiO2 + 2H2 | (2) |
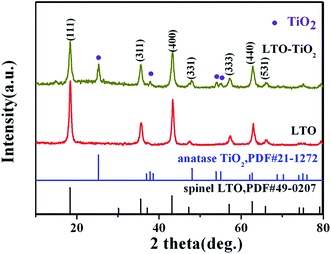
The crystal structures of pure Li4Ti5O12 and LTO–TiO2 composites were determined by X-ray diffraction. Fig. 2 shows the XRD patterns of pure Li4Ti5O12 and LTO–TiO2 composites. All the diffraction peaks of pure Li4Ti5O12 are in accordance with those of the spinel Li4Ti5O12 (JCPDS #49-0207). In comparison with those of pure Li4Ti5O12, the diffraction peaks of LTO–TiO2 composites are in good agreement with those of the spinel Li4Ti5O12 (JCPDS #49-0207) and anatase TiO2 (JCPDS #21-1272). The X-ray diffraction peaks at the 2θ values of 18.331°, 35.571°, 43.242°, 47.352°, and 62.833° correspond to the (111), (311), (400), (331), and (440) crystal planes of spinel Li4Ti5O12, whereas the X-ray diffraction peaks at the 2θ values of 25.281°, 37.800°, 48.049°, 53.890°, and 55.060° correspond to the (101), (004), (200), (105), and (211) crystal planes of anatase TiO2 (JCPDS #21-1272). The results indicated that the LTO–TiO2 composites were successfully synthesized.
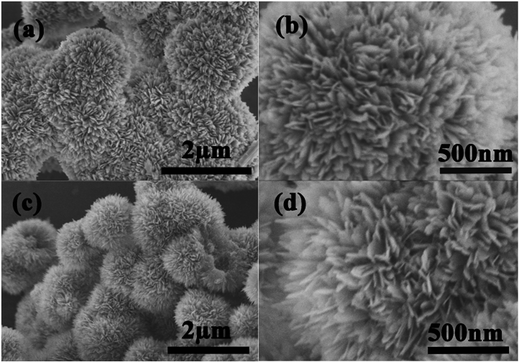
The morphologies of the as-prepared pure Li4Ti5O12 and LTO–TiO2 composites were characterized by SEM (Fig. 3). It can be seen that both pure Li4Ti5O12 (Fig. 3a and b) and the LTO–TiO2 composites (Fig. 3c and d) exhibit similar morphologies with an average particle diameter of about 1.5–2.0 μm and possess a flower-like microsphere structure that is self-assembled from scale-like nanosheets with a thickness of about 5–10 nm. The microsphere morphology was due to the use of H2O2. The decomposition of H2O2 can produce bubbles of O2, which can act as the center for the formation of crystals and subsequently form a microsphere morphology. As seen in the high-resolution SEM images (Fig. 3b and d), these nanosheet-assembled microsphere structures could not only provide a large number of channels for the access of an electrolyte but also buffer the strain due to volume changes during the charge–discharge process. Therefore, they are beneficial for the electrochemical performance of a battery.
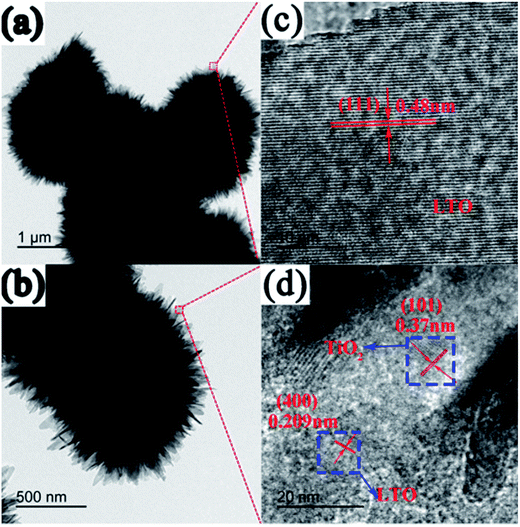
TEM and high-resolution TEM (HRTEM) were also performed to examine the morphology and composition of pure Li4Ti5O12 (Fig. 4a and c) and LTO–TiO2 composites (Fig. 4b and d). As illustrated in Fig. 4a and b, it can be seen that pure Li4Ti5O12 (Fig. 4a) and the LTO–TiO2 composites (Fig. 4b) comprise uniform microspheres, which are composed of small nanoflakes, each of which is stacked hierarchically and separately, which is in agreement with the SEM images. Fig. 4c and d show the HRTEM images of pure Li4Ti5O12 (Fig. 4c) and LTO–TiO2 composites (Fig. 4d). The clear lattice fringes of about 0.48 nm in Fig. 4c correspond to the (111) interplanar spacing of spinel Li4Ti5O12. As shown in Fig. 4d, the clear lattice fringes of about 0.209 and 0.37 nm correspond to the (400) and (101) interplanar spacings of spinel LTO and anatase TiO2, respectively, confirming the coexistence of the spinel Li4Ti5O12 and anatase TiO2. Obviously, the lattice of anatase TiO2 and the lattice of spinel LTO grew together, as shown in Fig. 4d, which was due to the distinct growth processes of the particles. During the process of crystal growth, the anatase TiO2 crystals on the surface first came in contact with the LiOH solution and were transformed into Li4Ti5O12. This would then surrounded the crystals inside the particles and prevent them from further contact and reaction with LiOH. Therefore, the components on the surface of LTO–TiO2 nanosheets are more likely to be the spinel LTO structures, whereas the internal part consists of two types of crystals: spinel LTO and anatase TiO2. This observation agreed well with the XRD results. The coexisting crystals in LTO–TiO2 could exert a synergistic effect on the process of Li-ion migration,22 by which the ions can easily diffuse between the lattices of LTO spinel and anatase TiO2.
3.2 Electrochemical performance of the LTO–TiO2 composites
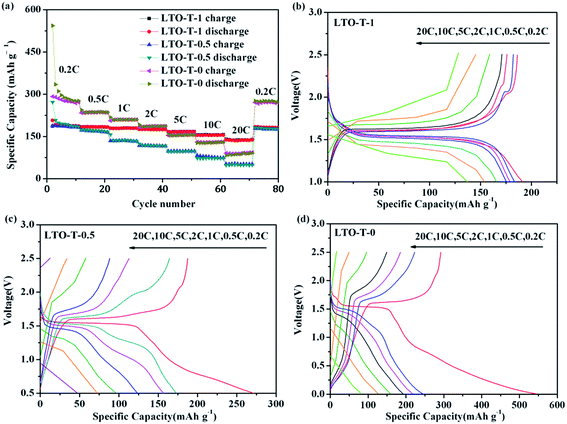
To gain an insight into the electrochemical process, the electrochemical behavior of the LTO–TiO2 composites in Li-ion batteries was investigated by rate capability measurements (Fig. 5). LTO–TiO2 composites were cycled from 0.2 to 20C over different voltage ranges, that is, from 2.5 V to 1.0, 0.5, and 0 V. The corresponding rate cycling performance and charge/discharge curves are shown in Fig. 5, and every stage of the charge/discharge cycle was repeated 10 times. In most stages of the charge/discharge cycle, the specific capacity of the LTO–TiO2 composites discharged to 0 V was higher than the specific capacity of the composites discharged to 1 V and 0.5 V and remained at a high level. Furthermore, as shown in Fig. 5a, it was clear that the specific capacity was much higher than 175 mA h g−1 at low current rates of 0.2, 0.5, 1, and 2C when the cut-off voltage was decreased to 0 V; this suggested that lithium ions could deeply intercalate into the LTO–TiO2 composites at low potentials. Moreover, in comparison with pure Li4Ti5O12 (Fig. S1a in the ESI†), the LTO–TiO2 composites had a higher specific capacity; this indicated that the presence of TiO2 in the electrode made a contribution to the actual capacities because of the impressive theoretical specific capacity of TiO2 (325 mA h g−1).32 However, when the current rate reached 10C or higher, the specific capacity of LTO–TiO2 discharged to 0 V was lower than that when it was discharged to 0.5 V and 1 V because of severe polarization of the LTO–TiO2 composites at higher current rates (>10C). When the cycling rate was returned to 0.2C, the original capacities of all three electrode materials were retained (Fig. 5a); this implied that the LTO–TiO2 composite electrodes had good structural stability. Therefore, the capacity fading at high current density for the LTO–TiO2 composite electrodes cycled from 0 V (or 0.5 V) to 2.5 V cannot be attributed to the structural decay of LTO–TiO2 composites.In addition, the capacity of the LTO–TiO2 composites was largely dependent on the charge/discharge rate and discharge cut-off voltage. As shown in Fig. 5b (LTO-T-1), it is clear that there are two plateaus in the initial charge/discharge curves at 0.2, 0.5, and 1C. The charge/discharge plateau at around 1.55 V (vs. Li/Li+) corresponds to the lithium ion insertion/deintercalation of LTO, and the charge/discharge plateau at around 2.0 V (vs. Li/Li+) corresponds to the lithium ion insertion/deintercalation of anatase TiO2. The discharge specific capacities at 0.2, 0.5, 1, 2, 5, 10, and 20C were 191.4, 183.4, 178.8, 175.4, 165.9, 154.1, and 138.1 mA h g−1, respectively. In comparison with pure LTO (Fig. S1b†), the LTO–TiO2 composites exhibited much higher specific capacities; this indicated their excellent rate performance. With an increase in the charge/discharge rate from 0.2 to 20C, the specific capacity of the LTO–TiO2 composites showed a clear downtrend, and the LTO–TiO2 composites cycled from 1.0 to 2.5 V displayed the least capacity fading and perfect charge/discharge plateaus. In addition, LTO-T-1 exhibited a relatively long charge/discharge plateau at around 1.55 V (vs. Li/Li+), which represented a stable working voltage plateau.
When the cut-off voltage was decreased to 0.5 V (Fig. 5c, LTO-T-0.5), the initial discharge specific capacity underwent an obvious increase at a low current rate of 0.2C, whereas it decreased rapidly and was even lower than the value obtained when the cut-off voltage was decreased to 1 V (Fig. 5b, LTO-T-1) and the charge/discharge rates were higher than 10C. Furthermore, the charge/discharge plateau became shorter than that when the LTO–TiO2 electrode was discharged to 1 V because of severe polarization. In comparison, the pure LTO electrode (Fig. S1c†) displayed a similar result to the LTO–TiO2 composites. Furthermore, when the LTO–TiO2 composites were discharged to 0 V (Fig. 5d, LTO-T-0), the corresponding discharge specific capacities at 0.2, 0.5, 1, 2, 5, 10, and 20C were 562.1, 254.0, 231.5, 204.1, 166.0, 145.8, and 114.7 mA h g−1, respectively. The initial discharge specific capacity underwent an exceptional increase at 0.2C that was even higher than that reported by Ge et al.,3,28 who suggested that the theoretical capacity of Li4Ti5O12 was 293 mA h g−1 (2.5–0.01 V). The specific capacity improvement can be attributed to the presence of TiO2, which contributed additional electrochemical capacity, and the specific capacities at lower current rates (<5C) were greatly increased because of the intercalation of additional lithium ions into Li7Ti5O12 to form Li9Ti5O12 (Fig. 5d).
However, when the discharge cut-off voltage was decreased to 0.5 and 0 V (Fig. 5c and d), the specific capacities at higher current rates (>10C) underwent a sharp decline, and the LTO–TiO2 composites displayed considerably poorer cycling stability when the charge/discharge rate was higher than 10C. In addition, it was found that the charge/discharge plateau at around 1.5 V (vs. Li/Li+) became much shorter and even disappeared with an increase in the charge/discharge rate because the polarization of the LTO–TiO2 composite electrodes cycled from 0.5 and 0 to 2.5 V was extremely high. In Fig. S1d,† it can also be seen that pure LTO display a similar change. The initial discharge specific capacity reached 406.8 mA h g−1, but the specific capacity quickly decreased in the subsequent cycles, and the charge/discharge plateau became shorter and even disappeared.
To gain a further insight into the electrochemical performance of the LTO–TiO2 composites, cyclic voltammetry (CV) testing was employed to investigate the kinetic processes. Fig. 6 shows the CV curves of LTO–TiO2 composites obtained at a scan rate of 0.1 mV s−1 over the voltage ranges of 1–2.5 V, 0.5–2.5 V, and 0–2.5 V, which are denoted as LTO-T-1, LTO-T-0.5, and LTO-T-0, respectively. Fig. 6a shows the CV curves of LTO–TiO2 discharged to 1 V. It is obvious that there are two pairs of redox peaks after the first cycle. The redox peaks at approximately 1.45/1.7 V (vs. Li/Li+) are assigned to the Li ions insertion and extraction of spinel LTO, which is characteristic of a reaction of the Ti4+/Ti3+ redox couple,33 whereas the other pair of redox peaks at 1.7/2.0 V (vs. Li/Li+) can be ascribed to the lithium ion insertion/deintercalation of anatase TiO2.34,35 It must also be mentioned that the current intensity of redox peaks at 1.7/2.0 V (vs. Li/Li+) is about 0.115 mA, which corresponds to the insertion/deintercalation of lithium ions into/from anatase TiO2, and is obviously lower than that for LTO at around 1.45/1.7 V (vs. Li/Li+) (Fig. 6a), which is about 0.7 mA because of its lower TiO2 content. In addition, the redox peaks of LTO were slightly shifted to higher potentials; this indicated that the electrode reaction of the LTO–TiO2 was controlled by a mixture of faradaic pseudocapacitive and diffusion-limited reactions, which was beneficial for enhancing the performance of electrode active materials.21,36 With an increase in the cycle number (Fig. 6a), the current intensity at the redox peak of LTO increased; this indicated that the interfacial reaction at the LTO–TiO2 electrode was generally enhanced. However, the peak current density of TiO2 gradually decreased with an increase in the cycle number because the initial formation of an SEI film consumed part of the capacity; this in turn suppressed further interfacial reactions and decreased the peak current density. In comparison with those of pure Li4Ti5O12, the CV profiles of LTO-1 (Fig. S2a†) only display one pair of redox peaks, which appear around 1.5 and 1.7 V (vs. Li/Li+) at a scan rate of 0.1 mV s−1 and correspond to the insertion and extraction processes of lithium ions in the spinel LTO.
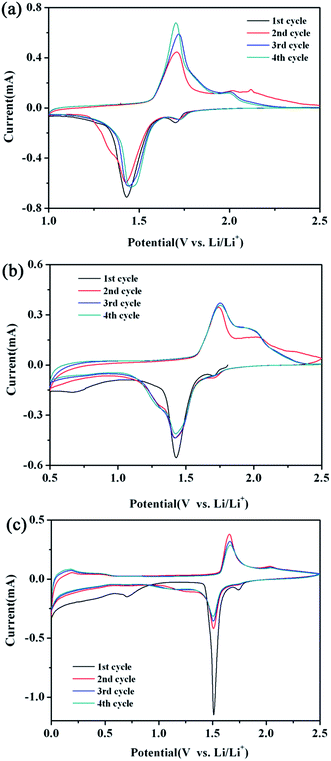 | ||
| Fig. 6 CV curves of the LTO–TiO2 electrodes ((a) LTO-T-1, (b) LTO-T-0.5, and (c) LTO-T-0) at a scan rate of 0.1 mV s−1 over various voltage ranges. | ||
With a decrease in the discharge cut-off voltage to 0.5 V (Fig. 6b, LTO-T-0.5), the redox peaks that appeared around 1.45/1.75 V (vs. Li/Li+) and 1.7/2.0 V (vs. Li/Li+) correspond to the Li+ insertion/deintercalation of LTO and anatase TiO2, respectively. Notably, during the first cycle, a third reduction peak was observed at about 0.71 V (vs. Li/Li+),37,38 which indicated that the electrolyte started to decompose irreversibly below 1.0 V. Moreover, the redox peaks of pure Li4Ti5O12 (Fig. S2b†) exhibited an obvious change such that an oxidation peak emerged at about 0.6 V when the discharge voltage was decreased to 0.5 V; this suggested that the change in the redox peaks of the LTO–TiO2 composites when the discharge voltage was below 1 V was caused by the intercalation of additional lithium ions into LTO. With a further decrease in the cut-off voltage to 0 V (Fig. 6c, LTO-T-0), the redox peaks that appeared above 1 V (vs. Li/Li+) corresponded to the insertion and extraction of Li+ ions into/from LTO spinel at 1.5/1.7 V (vs. Li/Li+) and TiO2 at 1.75/2.0 V (vs. Li/Li+), respectively. During the lithiation reaction process, the spinel Li4Ti5O12 was transformed into Li7Ti5O12 in the voltage range of 2.5–0.5 V. However, the pair of redox peaks below 0.5 V (vs. Li/Li+) is attributed to the combined action of LTO and conductive carbon black, and these peaks persisted during subsequent cycles; this indicated that the material had high reversible capacity below 0.5 V.37 The peak below 0.5 V was caused by the intercalation of additional lithium ions into Li7Ti5O12 to form Li9Ti5O12 (Fig. 6c), which increased the specific capacity of the LTO–TiO2 composite electrodes because the empty 8a sites of Li7Ti5O12 could accommodate more lithium ions. In addition, 40% of titanium present in 16d octahedral sites is in the oxidation state of Ti4+, which can be reduced to Ti3+ during the accommodation of additional lithium ions.3,28 Furthermore, pure Li4Ti5O12 (Fig. S2c†) displayed CV curves that were similar to those of the LTO–TiO2 composites in the voltage range of 0.6–0 V; this implied that the LTO–TiO2 composites had the same reaction mechanism as LTO between 0.6 and 0 V (Fig. 6c). It is also notable that (Fig. 6a–c) the larger voltage difference between the anodic and cathodic peaks suggests an increase in polarization and a decline in electrochemical reaction kinetics.7,25 This observation is in good agreement with the results of the rate capability measurements shown in Fig. 5.
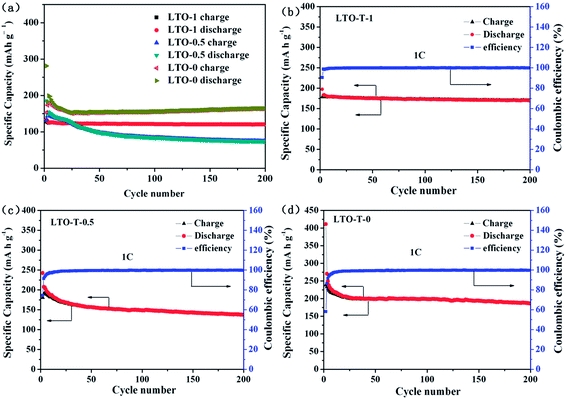
The cycling performance of the LTO–TiO2 electrodes at a charge/discharge rate of 1C is shown in Fig. 7a. Obviously, LTO–TiO2 discharged to 0 V displayed a higher specific capacity than that discharged to 1 and 0.5 V, which was maintained at approximately 200 mA h g−1 after 200 cycles. The initial discharge and charge specific capacities were 411.3 and 238.9 mA h g−1 (Fig. 7a), respectively. The results of cycling of the LTO–TiO2 electrode (LTO-T-0) for 500 cycles at a rate of 1C are shown in Fig. S3.† It can clearly be seen that the LTO–TiO2 electrode when discharged to 0 V at a rate of 1C displayed a capacity of approximately 200 mA h g−1 (191.7 mA h g−1) after 500 cycles, and the coulombic efficiency (CE) also reached 100%. In comparison, the pure LTO electrode (Fig. S4a†) displayed a much lower specific capacity than the LTO–TiO2 composites after 200 cycles. It can be seen that the specific capacities of the LTO–TiO2 electrodes are substantially affected by the discharge cut-off voltage and the formation of a composite with TiO2.
Fig. 7b and c show the cycling performance and the coulombic efficiency curves of the LTO–TiO2 composite electrodes when discharged to 1 and 0.5 V, respectively. When the cut-off voltage was decreased to 1 V (Fig. 7b) and 0.5 V (Fig. 7c), they displayed lower initial discharge and charge capacities of 197.3 and 178.5 mA h g−1 (Fig. 7b) and 242.5 and 180.6 mA h g−1 (Fig. 7c), which correspond to a CE of 90.46% (Fig. 7b) and 74.46% (Fig. 7c), respectively, and the coulombic efficiency approached 100% after 10 cycles. Similarly, the pure LTO exhibited a relatively lower specific capacity than the LTO–TiO2 composites when the discharge voltage was decreased to 1 V (Fig. S4b†) and 0.5 V (Fig. S4d†).
Note that the capacity of the LTO–TiO2 electrode when discharged to 0 V decreased markedly, in particular during the first three cycles, and corresponded to a coulombic efficiency (CE) (shown in Fig. 7d) of 58.1%, 86.37%, and 91.52%. This phenomenon could be mainly explained by the unique spinel structure of LTO and composited anatase TiO2. During the charge–discharge processes, some Li+ ions may have been stucked in the irreversible sites of the spinel LTO structure or filled in the irreversible sites of anatase TiO2. This factor was responsible for the capacity loss as well as the decomposition of the electrolyte, in particular during the first three cycles. This phenomenon was also consistent with the result of the CV curves (Fig. 6c). After 10 cycles, the specific capacity tended to be stable, and the coulombic efficiency was nearly 100%. More importantly, the LTO–TiO2 composites when discharged to 0 V (Fig. 7d) retained a relatively higher discharge capacity of 186 mA h g−1 after 200 cycles; this suggested that lithium ions could intercalate into LTO–TiO2 at low potentials. It also indicates that more lithium ions can be inserted into the LTO–TiO2 electrode when discharged to 0 V. The process of the insertion/deinsertion of lithium ions into/from LTO–TiO2 between 2.5 and 0 V is reversible. In comparison with pure Li4Ti5O12 (Fig. S4a and d†), it can be seen that the LTO–TiO2 composites exhibited a higher specific capacity, which indicated that both the discharge cut-off voltage and the formation of a composite with TiO2 were beneficial for the enhancement of the specific capacity of LTO–TiO2.
Fig. 8 shows initial three discharge–charge curves of LTO–TiO2 composite electrodes at a charge–discharge rate of 1C. It can be seen that the first discharge specific capacity of the electrodes increased with an increase in the discharge voltage range. As shown in Fig. 8a, the initial discharge capacity of the LTO–TiO2 composites was 197.3 mA h g−1 in the voltage range of 2.5–1.0 V, which was higher than the theoretical specific capacity of LTO (175 mA h g−1). As confirmation, it was found that the initial discharge capacity of LTO (Fig. S5a†) was 133 mA h g−1 in the voltage range of 2.5–1.0 V, which was lower than that of LTO–TiO2.
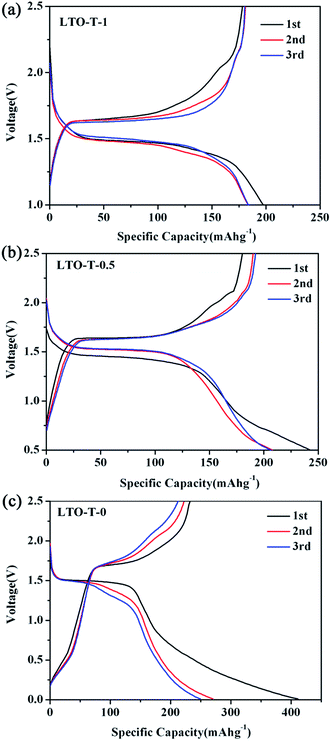 | ||
| Fig. 8 Initial three discharge–charge curves of the LTO–TiO2 electrodes ((a) LTO-T-1, (b) LTO-T-0.5, and (c) LTO-T-0) at a charge–discharge rate of 1C. | ||
When the discharge cut-off voltage was decreased to 0.5 and 0 V, the first discharge capacities of the LTO–TiO2 composites were 242.5 and 411.3 mA h g−1, respectively, which were much higher than the theoretical specific capacity of lithium titanate. Fig. S5b and c† show the initial three discharge–charge curves of pure Li4Ti5O12 at a scan rate of 0.1 mV s−1 when LTO was discharged to 0.5 and 0 V. It can be seen that the discharge capacity of the LTO–TiO2 composites underwent a great increase in comparison with that of pure LTO owing to the formation of a composite with TiO2 and the extension of the discharge voltage range. Notably, the increase in the capacity of the LTO–TiO2 composites upon an extension in the discharge voltage range was mainly due to the presence of spinel LTO. This may have been caused by the following factors. The theoretical specific capacity of LTO is 175 mA h g−1, which is defined in the voltage range of 2.5–1.0 V. During the discharge process, lithium ions are gradually inserted into vacant 16c octahedral sites in LTO together with the conversion of LTO into Li7Ti5O12. When the discharge voltage is lower than 1 V, lithium ions can be accommodated in the tetrahedral (8a) sites of Li7Ti5O12 and the specific capacity of LTO will therefore be much higher than 175 mA h g−1. As shown in Fig. 8–c, the second discharge specific capacity was much lower than the initial capacity. Obviously, the specific capacity loss of the LTO–TiO2 composites when discharged to 1 V was less than that when it was discharged to 0.5 V and 1 V; this was mainly caused by the irreversible storage of lithium ions during the SEI film formation process by the decomposition of the electrolyte.
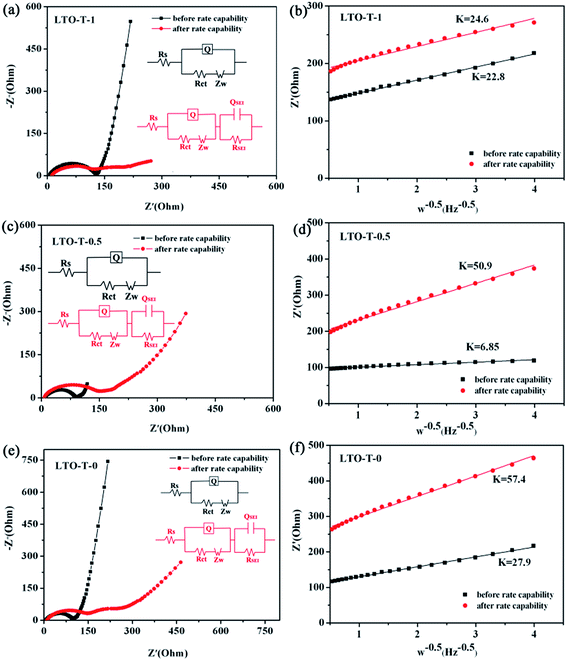
Electrochemical impedance spectroscopy (EIS) measurements were further performed to study the electrochemical reaction kinetics of the insertion/extraction of lithium ions into/from the LTO–TiO2 composite electrodes. The kinetic processes in the composite electrode were further investigated by modeling electrochemical impedance spectra based on the modified equivalent circuit. The Nyquist plots of the composite electrodes for different discharge cut-off voltages are shown in Fig. 9a, c, and e, and the obtained spectra were fitted by Z SimpWin software using different equivalent circuit models with an insertion (shown in the insets in Fig. 9a, c, and e), and the corresponding simulation results are shown in Table 1. The relationships between Zre and the square root of the frequency (ω−0.5) in the low-frequency region before and after rate capability testing of the LTO–TiO2 electrodes are shown in Fig. 9b, d, and f. As can be seen from Fig. 9a, c, and e, it is obvious that the curve was composed of a semicircle in the high-frequency region and a line with a slope of about 45° in the low-frequency region before the rate capability test. The intercept at the real axis, which corresponds to the ohmic resistance (Rs), reflects the electronic conductivity of the separator, electrolyte, and anodes. The radius of the semicircle corresponds to the charge transfer resistance (Rct), whereas the sloping line in the low-frequency region is associated with the Warburg impedance (ZW), which is related to the diffusion of Li ions in active materials. The high-frequency semicircle corresponds to the resistance RSEI and QSEI of the SEI film, and the semicircle in the medium-frequency region is assigned to the charge transfer resistance Rct and Q of the electrode/electrolyte interface. In general, before the rate capability test, the EIS spectra of the LTO–TiO2 electrodes (Fig. 9a, c, and e) displayed one partial quasi-semicircle at high frequencies. In contrast, after the rate capability test, the EIS spectra of the LTO–TiO2 electrodes (Fig. 9a, c, and e) displayed two partial quasi-semicircles at high to medium frequencies. However, in the Nyquist plot (Fig. 9c, LTO-T-0.5) of the LTO–TiO2 electrodes, the quasi-semicircle in the medium-frequency region is relatively small because the SEI film has just begun to form at about 0.7 V (vs. Li/Li+).
| Rs (Ω) | Rct (Ω) | RSEI (Ω) | DLi (cm2 s−1) | ||
|---|---|---|---|---|---|
| LTO-T-1 | Before rate capability | 8.3 | 97.2 | 3.297 × 10⁻¹¹ | |
| After rate capability | 10.85 | 109.6 | 106.5 | 2.832 × 10⁻¹¹ | |
| LTO-T-0.5 | Before rate capability | 11.47 | 73.17 | 2.119 × 10⁻¹⁰ | |
| After rate capability | 6.99 | 135.8 | 16.2 | 3.838 × 10⁻¹² | |
| LTO-T-0 | Before rate capability | 10.43 | 69.56 | 2.044 × 10⁻¹² | |
| After rate capability | 9.85 | 147.8 | 74.38 | 4.829 × 10⁻¹³ | |
As shown in Fig. 9a, the observation of two semicircles indicates that an SEI film can also form gradually on the LTO–TiO2 electrode after rate capability testing. The RSEI values of the LTO–TiO2 electrodes for LTO-T-1, LTO-T-0.5, and LTO-T-0 are 106.5 Ω, 16.2 Ω, and 74.38 Ω, respectively. An SEI film can form on the surface of the LTO–TiO2 electrode cycled above 0.1 V (vs. Li/Li+) because of intrinsic interfacial reactions between the LTO–TiO2 electrode and surrounding electrolytes.39–41 An SEI film will also form on the LTO–TiO2 electrode below 1.0 V because of the reduction of the electrolyte, together with the interfacial reactions. The kinetic parameters Rct can be obtained by data fitting according to the equivalent circuit model. The Rct values of the LTO–TiO2 electrodes for LTO-T-1, LTO-T-0.5, and LTO-T-0 are 109.6 Ω, 135.8 Ω, and 147.8 Ω (after the rate capability test), respectively. When the cut-off voltage was decreased from 1.0 V to 0.5 and 0 V, the Rct values of the LTO–TiO2 electrode gradually increased because a low discharge voltage might lead to the formation of an SEI over the LTO–TiO2 electrode.3
To obtain accurate values of the impedance and diffusion coefficient, the oblique linear Warburg part was fitted, and the results are shown in Fig. 9b, d, and e (plot of Z′ vs. ω−0.5). The Li-ion diffusion coefficient is determined by the low-frequency Warburg impedance. It is observed that the Warburg coefficient σw of the LTO–TiO2 electrode is shown in Fig. 9b, d, and e (the slope of the plot of Z′ vs. ω−0.5). Therefore, the lithium-ion diffusion coefficient can be calculated from eqn (3):22,42,43
 | (3) |
![[thin space (1/6-em)]](https://www.rsc.org/images/entities/char_2009.gif) 500 C mol−1), C is the concentration of lithium ions, and σw is the Warburg coefficient. According to the abovementioned equation, the Li+ ion diffusion coefficients for the LTO–TiO2 electrode are shown in Table 1. This clearly shows that the lithium ion diffusion coefficient becomes smaller after the rate capability test because during the lithium ion insertion and extraction process, some Li+ ions may be stucked in the irreversible sites of LTO–TiO2, which thus block some diffusion channels for Li+. This demonstrated that the lithium-ion diffusion coefficient was closely related to the degree of insertion of lithium into LTO–TiO2.
500 C mol−1), C is the concentration of lithium ions, and σw is the Warburg coefficient. According to the abovementioned equation, the Li+ ion diffusion coefficients for the LTO–TiO2 electrode are shown in Table 1. This clearly shows that the lithium ion diffusion coefficient becomes smaller after the rate capability test because during the lithium ion insertion and extraction process, some Li+ ions may be stucked in the irreversible sites of LTO–TiO2, which thus block some diffusion channels for Li+. This demonstrated that the lithium-ion diffusion coefficient was closely related to the degree of insertion of lithium into LTO–TiO2.
4. Conclusions
In summary, nanosheet-assembled LTO–TiO2 microspheres have been successfully synthesized by a simple hydrothermal approach. The nanosheet-assembled LTO–TiO2 microspheres can be used as anode materials for lithium-ion batteries. The results show that nanosheet-assembled LTO–TiO2 microspheres exhibit superior electrochemical performance to pure LTO; this indicated that the formation of a composite with TiO2 can increase the specific capacity of LTO. Electrochemical performance tests with different cut-off voltage ranges (i.e., 1.0–2.5, 0.5–2.5, and 0–2.5 V, respectively) demonstrated that the extension of the discharge voltage range could also increase the specific capacity of LTO–TiO2 composites. In the voltage range of 2.5–0 V, the process of the insertion/deinsertion of lithium ions into/from LTO–TiO2 was structurally reversible, and LTO–TiO2 exhibited a higher discharge specific capacity of 411.3 mA h g−1 in the first cycle. The LTO–TiO2 composites retained a relatively high discharge capacity of 186 mA h g−1 after 200 cycles; this suggested that the LTO–TiO2 composites have excellent cycling stability at low current densities. In addition, the composite of LTO with TiO2 can also contribute some capacity improvement as compared to pure LTO. We envision that the formation of composites with other high-capacity materials and the widening of the working voltage range will increase the capacity of LTO-based LIBs.Conflicts of interest
There are no conflicts to declare.Acknowledgements
We acknowledge the financial support received from the National Science Foundation of China (51272147), the Natural Science Foundation of Shaanxi Province (2015JM5208), and the Graduate Innovation Fund of the Shaanxi University of Science and Technology.References
- C. Chen, Y. Huang, H. Zhang, X. Wang, G. Li, Y. Wang, L. Jiao and H. Yuan, J. Power Sources, 2015, 278, 693–702 CrossRef CAS.
- H. G. Jung, M. W. Jang, J. Hassoun, Y. K. Sun and B. Scrosati, Nat. Commun., 2011, 2, 516 CrossRef PubMed.
- B. Zhao, R. Ran, M. Liu and Z. Shao, Mater. Sci. Eng., R, 2015, 98, 1–71 CrossRef.
- J. M. Tarascon and M. Armand, Nature, 2001, 414, 359 CrossRef CAS PubMed.
- W. M. Zhang, J. S. Hu, Y. G. Guo, S. F. Zheng, L. S. Zhong, W. G. Song and L. J. Wan, Adv. Mater., 2008, 20, 1160–1165 CrossRef CAS.
- X. Zheng and J. Li, Ionics, 2014, 20, 1651–1663 CrossRef CAS.
- C. Han, Y. B. He, S. Wang, C. Wang, H. Du, X. Qin, Z. Lin, B. Li and F. Kang, ACS Appl. Mater. Interfaces, 2016, 8, 18788 CAS.
- Z. Li, J. Li, Y. Zhao, K. Yang, F. Gao and X. Li, RSC Adv., 2016, 6, 15492–15500 RSC.
- E. Pohjalainen, T. Rauhala, M. Valkeapää, J. Kallioinen and T. Kallio, J. Phys. Chem. C, 2015, 119, 150126111745000 Search PubMed.
- T. Ohzuku, J. Electrochem. Soc., 1995, 142 Search PubMed.
- M. M. Thackeray, J. Electrochem. Soc., 1995, 142, 2558–2563 CrossRef CAS.
- A. Abouimrane, Y. Abu-Lebdeh, P. J. Alarco and M. Armand, J. Electrochem. Soc., 2004, 151, A1028–A1031 CrossRef CAS.
- A. D. Pasquier, A. Laforgue and P. Simon, J. Power Sources, 2004, 125, 95–102 CrossRef.
- C. H. Chen, J. T. Vaughey, A. N. Jansen, D. W. Dees, A. J. Kahaian, T. Goacher and M. M. Thackeray, J. Electrochem. Soc., 2001, 32, A102–A104 CrossRef.
- M. Kamata, S. Fujine, K. Yoneda, K. Kanda and T. Esaka, Solid State Ionics, 1999, 123, 165 CrossRef.
- Y. B. He, B. Li, M. Liu, C. Zhang, W. Lv, C. Yang, J. Li, H. Du, B. Zhang and Q. H. Yang, Sci. Rep., 2012, 2, 913 CrossRef PubMed.
- F. Ronci, P. Reale, A. B. Scrosati, S. Panero, V. R. Albertini, P. Perfetti, M. D. Michiel and J. M. Merino, J. Phys. Chem. B, 2002, 106, 3082–3086 CrossRef CAS.
- F. Wang, L. Wu, C. Ma, D. Su, Y. Zhu and J. Graetz, Nanotechnology, 2013, 24, 424006 CrossRef PubMed.
- T. F. Yi, S. Y. Yang and Y. Xie, J. Mater. Chem. A, 2015, 3, 5750–5777 CAS.
- M. Chen, W. Li, X. Shen and G. Diao, ACS Appl. Mater. Interfaces, 2014, 6, 4514–4523 CAS.
- X. Li, C. Lai, C. W. Xiao and X. P. Gao, Electrochim. Acta, 2011, 56, 9152–9158 CrossRef CAS.
- Y. Zhang, Y. Zhang, L. Huang, Z. Zhou, J. Wang, H. Liu and H. Wu, Electrochim. Acta, 2016, 195, 124–133 CrossRef CAS.
- T. Lan, H. Qiu, F. Xie, J. Yang and M. Wei, Sci. Rep., 2015, 5, 8498 CrossRef CAS PubMed.
- Y. Q. Wang, L. Gu, Y. G. Guo, H. Li, X. Q. He, S. Tsukimoto, Y. Ikuhara and L. J. Wan, J. Am. Chem. Soc., 2012, 134, 7874–7879 CrossRef CAS PubMed.
- L. Yang, H. Z. Li, J. Liu, Y. Lu, S. Li, J. Min, N. Yan, Z. Men and M. Lei, J. Alloys Compd., 2016, 689, 812–819 CrossRef CAS.
- D. Ahn and X. Xiao, Electrochem. Commun., 2011, 13, 796–799 CrossRef CAS.
- H. Ge, N. Li, D. Li, C. Dai and D. Wang, Electrochem. Commun., 2008, 10, 1031–1034 CrossRef CAS.
- H. Ge, N. Li, D. Li, C. Dai and D. Wang, J. Phys. Chem. C, 2009, 113, 6324–6326 CAS.
- X. L. Yao, S. Xie, H. Q. Nian and C. H. Chen, J. Alloys Compd., 2008, 465, 375–379 CrossRef CAS.
- Z. Zhong, C. Ouyang, S. Shi and M. Lei, ChemPhysChem, 2008, 9, 2104–2108 CrossRef CAS PubMed.
- W. J. H. Borghols, M. Wagemaker, U. Lafont, E. M. Kelder and F. M. Mulder, J. Am. Chem. Soc., 2009, 131, 17786–17792 CrossRef CAS PubMed.
- Q. Wang, J. Geng, C. Yuan, K. Long and B. Geng, Electrochim. Acta, 2016, 212, 41–46 CrossRef CAS.
- H. Xu, X. Hu, Y. Sun, W. Luo, C. Chen, Y. Liu and Y. Huang, Nano Energy, 2014, 10, 163–171 CrossRef CAS.
- Q. Zhu, H. Hu, G. Li, C. Zhu and Y. Yu, Electrochim. Acta, 2015, 156, 252–260 CrossRef CAS.
- G. Lin, X. Li, H. Hu, G. Li, H. Liu and Y. Yu, Electrochim. Acta, 2014, 120, 231–239 CrossRef.
- C. Lai, Y. Y. Dou, X. Li and X. P. Gao, J. Power Sources, 2010, 195, 3676–3679 CrossRef CAS.
- W. Lu, I. Belharouak, J. Liu and K. Amine, J. Electrochem. Soc., 2007, 154, 559–570 Search PubMed.
- J. Shu, Electrochem. Solid-State Lett., 2009, 12, 95–96 Search PubMed.
- J. Shu, J. Solid State Electrochem., 2009, 13, 1535–1539 CrossRef CAS.
- T. Nordh, R. Younesi, M. Hahlin, R. F. Duarte, C. Tengstedt, D. Brandell and K. Edström, J. Phys. Chem. C, 2016, 120, 3206–3213 CAS.
- Y. B. He, M. Liu, Z. D. Huang, B. Zhang, Y. Yu, B. Li, F. Kang and J. K. Kim, J. Power Sources, 2013, 239, 269–276 CrossRef CAS.
- L. J. Fu, H. Liu, H. P. Zhang, C. Li, T. Zhang, Y. P. Wu and H. Q. Wu, J. Power Sources, 2006, 159, 219–222 CrossRef CAS.
- X. Wang, H. Hao, J. Liu, T. Huang and A. Yu, Electrochim. Acta, 2011, 56, 4065–4069 CrossRef CAS.
Footnote |
| † Electronic supplementary information (ESI) available. See DOI: 10.1039/c7ra07390a |
| This journal is © The Royal Society of Chemistry 2017 |

