
 Open Access Article
 This Open Access Article is licensed under a
 Creative Commons Attribution 3.0 Unported Licence
Screening metal–organic frameworks for mixture separations in fixed-bed adsorbers using a combined selectivity/capacity metric†
Rajamani Krishna *
*
Van't Hoff Institute for Molecular Sciences, University of Amsterdam, Science Park 904, 1098 XH Amsterdam, The Netherlands. E-mail: r.krishna@contact.uva.nl; Fax: +31 20 525 5604; Tel: +31 20 627 0990
First published on 17th July 2017
Abstract
The separation performance of a fixed bed adsorption unit is dictated by a combination of two metrics: selectivity and uptake capacity. Most commonly, the screening of adsorbent materials on the basis of either of these metrics leads to contradicting hierarchies. To resolve this dilemma, this article defines a combined metric, termed the separation potential (ΔQ), that is calculable on the basis of the Ideal Adsorbed Solution Theory (IAST) for mixture adsorption equilibrium. For a binary mixture of A, and B in which B is more poorly adsorbed, ΔQ reflects the maximum productivity of pure B that can be recovered in the adsorption cycle of transient fixed bed operations; the same concept holds for recovery of pure A in the desorption cycle. For validation of the combined metric, transient breakthrough simulations were performed for separation of mixtures of Xe/Kr, C2H2/CO2, C2H2/C2H4, C2H4/C2H6, C3H6/C3H8, CO2/CH4, CO2/N2, CO2/H2, CO2/CO/CH4/H2, and hydrocarbon isomers in fixed beds packed with a wide variety of metal–organic frameworks (MOFs). In every case, the productivities determined from transient breakthrough simulations are determined to be linearly related to the values of ΔQ; the actual values are lower because of the distended nature of concentration breakthroughs in fixed beds. Indeed, if the “fronts” of the concentrations traverse the fixed bed in the form of “shock waves”, the productivity values for fixed beds coincide precisely with ΔQ. The important conclusion to be drawn is that MOFs can be compared and evaluated on the basis of IAST calculations of the combined metric, thus obviating the need for performing transient breakthrough calculations.
1. Introduction
Metal–organic frameworks (MOFs) have considerable potential for the separation of a wide variety of mixtures, offering energy-efficient alternatives to conventional distillation and absorption technologies. For any given separation task, a wide variety of MOFs are on offer; consequently, there is a need for a robust procedure for screening and ranking of MOFs. Particularly noteworthy are recent advances in the large-scale computational screening1–3 of MOFs for separation and storage applications, leading in some cases to the discovery of new materials.2 The potency of computational screening has been demonstrated for CO2 capture,4–6 NH3 capture,7 separation of hexane and heptane isomers,8 and Xe/Kr mixtures.9Two commonly used metrics for screening are selectivity and capacity. For separation of a binary mixture of components A and B, the adsorption selectivity, SA/B, is defined by
 | (1) |
| QA = ρqA; QB = ρqB | (2) |
For 20/80 Xe/Kr mixture separations, Fig. 1a shows that the hierarchy of SA/B values is Co-formate > Ag@NiMOF-74 > NiMOF-74 > SBMOF-2 > SAPO-34 > CuBTC. The calculations in Fig. 1 are based on the IAST using the experimental data on the unary isotherms; all calculation details are provided in the ESI,† that also includes the structural details for each of the MOFs mentioned and analyzed in this article. Wang et al.11 attribute the highly selective adsorption of Xe in Co-formate to commensurate positioning of Xe within the cages; such commensurate positioning also implies that the intra-crystalline diffusivity of Xe will be significantly lower than that of Kr.12–14 The introduction of well-dispersed Ag nanoparticles into NiMOF-74, results in stronger interactions of the polarizable Xe with the adsorbent Ag@NiMOF-74. The geometry of the channels of SBMOF-2 provides a better match for the larger Xe atoms rather than smaller Kr, and helps explain the selectivity for Xe over Kr. The hierarchy of Xe uptake capacities is Ag@NiMOF-74 > Co-formate > NiMOF-74 > SBMOF-2 > CuBTC > SAPO-34; this does not go hand-in-hand with the Sads hierarchy.
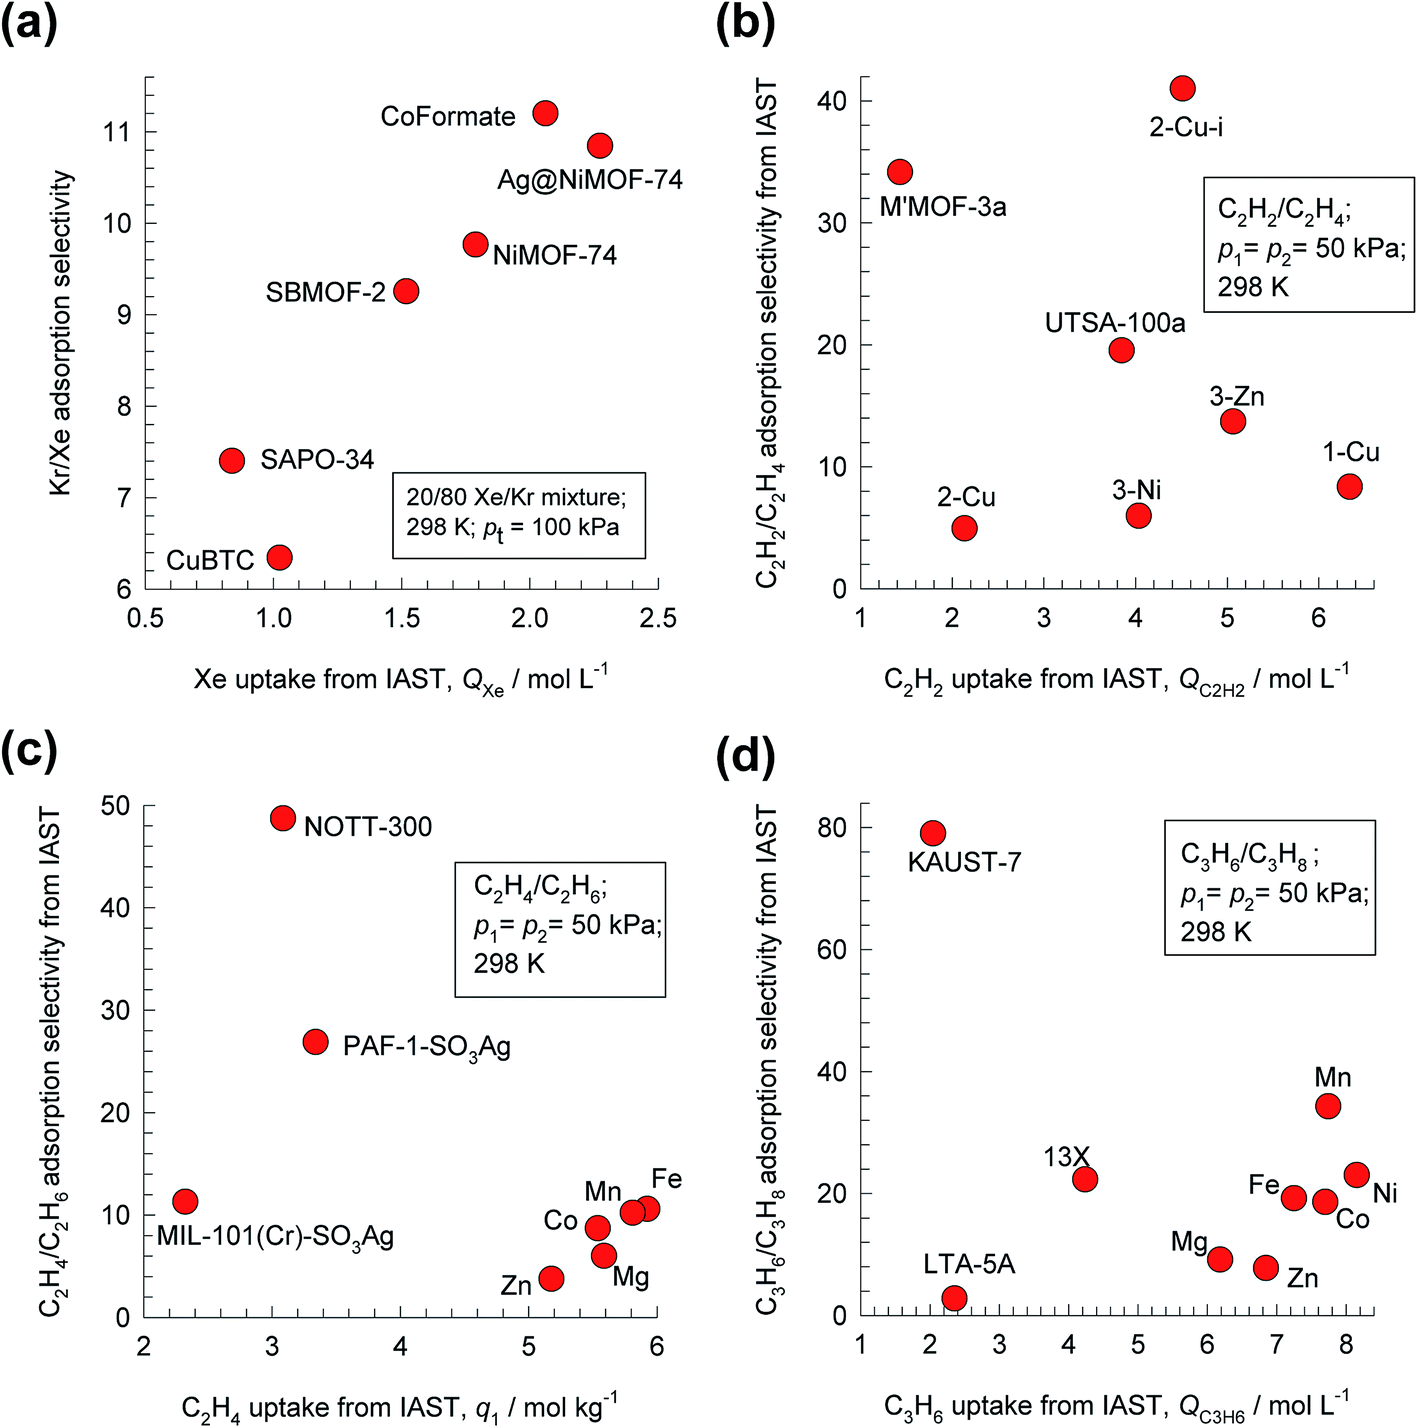 | ||
| Fig. 1 Plots of adsorption selectivity vs. uptake capacity for separation of four binary mixtures. (a) 20/80 Xe/Kr mixtures using NiMOF-74, Ag@NiMOF-74, CuBTC, SBMOF-2, Co-formate, and SAPO-34. (b) 50/50 C2H2/C2H4 using SIFSIX-(1-Cu, 2-Cu, 3-Zn, 2-Cu-i, 3-Ni), M′MOF-3a, and UTSA-100a. (c) 50/50 C2H4/C2H6 mixtures using M-MOF-74 (M = Fe, Co, Mn, Mg, Zn), PAF-1-SO3Ag, MIL-101-Cr-SO3Ag, and NOTT-300. (d) 50/50 C3H6/C3H8 mixtures using M-MOF-74 (M = Fe, Co, Ni, Mn, Mg, Zn), 13X zeolite, LTA-5A zeolite, and KAUST-7. In all cases, the temperature T = 298 K, and total pressure pt = 100 kPa. All calculation details and structural information on the various MOFs are provided in the ESI.† | ||
For 50/50 C2H2/C2H4 mixtures, the SA/B vs. C2H2 uptake capacity plots are shown in Fig. 1b. On the basis of selectivity, the best MOF is the SIFSIX-2-Cu-i (2 = 4,4′-dipyridylacetylene, i = interpenetrated); in this case, each C2H2 molecule is bound by two F atoms from different nets.15 However, SIFSIX-1-Cu, with the larger pore size, has the higher C2H2 uptake capacity.
For separations of 50/50 C2H4/C2H6 mixtures, the highest Sads values are realized with NOTT-300, and PAF-1-SO3Ag; see Fig. 1c. Simultaneous and cooperative hydrogen-bonding, and π⋯π stacking interactions account for the stronger binding of C2H4 in NOTT-300. The π-complexation of the alkenes with Ag(I) ions of PAF-1-SO3Ag, account for its high alkene/alkane selectivity. The C2H4 uptakes of NOTT-300 and PAF-1-SO3Ag are, however, significantly lower than that of FeMOF-74, and CoMOF-74; see Fig. 1c.
A MOF that has been customized for C3H6/C3H8 separations is NbOFFIVE-1-Ni (=KAUST-7), belonging to the same class of SIFSIX materials but using pyrazine as the organic linker;16 it exhibits the highest selectivity (see Fig. 1d). The tilting of the pyrazine molecule on the linker reduces the pore aperture to about 3 Å, permitting ingress of C3H6 molecules, but essentially excluding C3H8 on the basis of subtle differences in bond lengths and bond angles (see Fig. S19†). On the other hand, NiMOF-74, with 11 Å hexagonal-shaped channels, has the highest uptake capacity for the unsaturated alkene, but a significantly lower selectivity than KAUST-7.
In industrial processing operations, the MOFs are normally used in powder or pelleted form in fixed bed devices; see schematic in Fig. 2. Such units are most commonly operated in a transient mode, with adsorption and desorption cycles; they are called either pressure swing adsorbers (PSA) or temperature swing adsorbers (TSA) depending on the regeneration strategy employed. Most commonly, the separation performance in a fixed-bed adsorber is dictated by mixture adsorption equilibrium; both selectivity and capacity metrics are relevant and important. Other factors that influence separation performance include axial dispersion, intra-particle diffusional limitations, and resistance to diffusional transfer between the bulk gas phase and the surface of the particle.17–20 The dispersion and diffusional effects are strongly influenced by the particle size, interstitial fluid velocity, and equipment dimensions. Dispersion and diffusional effects often cause distended breakthrough characteristics and usually lead to diminished separation effectiveness.19,21
 | ||
| Fig. 2 Schematic of fixed bed adsorber filled with adsorbent particles of radius rc. | ||
Transient breakthrough experiments on laboratory scale fixed-bed equipment have been used for screening MOFs;16,22–24 however, this approach is labor intensive and time consuming. An alternative approach, that has gained currency in the literature, is to screen MOFs on the basis of transient breakthrough simulations;14,15,18,25–29 in these simulations it is customary to neglect dispersion and diffusional effects but such effects can be also be routinely included, as appropriate.21
The primary objective of this article to develop a simple and robust screening strategy that obviates the need for performing transient breakthrough simulations, or transient breakthrough experiments on a laboratory scale. Towards this end, we define a “new” metric, dubbed the separation potential, ΔQ, that combines the selectivity and capacity metrics in a manner that is truly representative of the separation characteristics of transient fixed bed operations. The value of ΔQ is calculated using the IAST for mixture adsorption equilibrium. For validation of the combined metric, comparisons are made with the separation performance determined from transient breakthrough simulations for several different mixtures: Xe/Kr, C2H2/CO2, C2H2/C2H4, C2H4/C2H6, C3H6/C3H8, CO2/CH4, CO2/N2, CO2/H2, CO2/CO/CH4/H2, and hydrocarbon isomers using a wide variety of MOFs.
The ESI,† accompanying this publication, provides (a) methodology used for transient breakthrough simulations, (b) analytic solutions to the shock wave model for fixed bed transient operations, (c) structural information on the MOFs investigated, (d) unary isotherm data for each guest/host combination, and (e) details simulation results for each of the investigated systems.
2. The separation potential of fixed bed adsorber
For quantifying the separation performance, we neglect axial dispersion effects and consider plug flow of an n-component gas mixture through a fixed bed adsorber maintained under isothermal, isobaric, conditions; see Fig. 2. The molar concentrations of the constituent species in the bulk fluid phase vary with position z along the bed, and time, t. At any position z in the fixed bed, and time t, the molar loadings in the adsorbed phase within the pores, varies along the radius of the particle, r. The molar concentrations in the gas phase at any position and instant of time are obtained by solving the following set of partial differential equations for each of the species i in the gas mixture.30
 | (3) |
In eqn (3), t is the time, z is the distance along the adsorber, ρ is the framework density, ε is the bed voidage, v is the interstitial gas velocity, and ![[q with combining macron]](https://www.rsc.org/images/entities/i_char_0071_0304.gif) i(t,z) is the spatially averaged molar loading within the crystallites of radius rc, monitored at position z, and at time t. The time t = 0, corresponds to the time at which the feed mixture is injected at the inlet to the fixed bed. Prior to injection of the feed, it is assumed that an inert, non-adsorbing, gas flows through the fixed bed.
i(t,z) is the spatially averaged molar loading within the crystallites of radius rc, monitored at position z, and at time t. The time t = 0, corresponds to the time at which the feed mixture is injected at the inlet to the fixed bed. Prior to injection of the feed, it is assumed that an inert, non-adsorbing, gas flows through the fixed bed.
At any time t, during the transient approach to thermodynamic equilibrium, the spatially averaged molar loading within the crystallite rc is obtained by integration of the radial loading profile
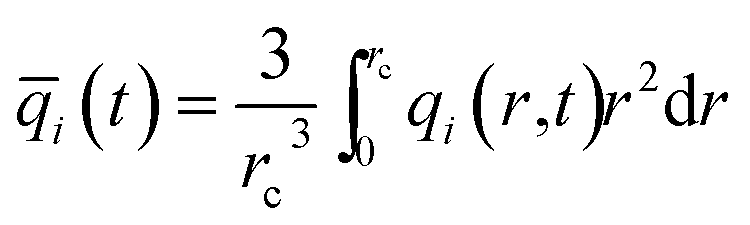 | (4) |
For transient unary uptake within a crystal at any position and time with the fixed bed, the radial distribution of molar loadings, qi, within a spherical crystallite, of radius rc, is obtained from a solution of a set of differential equations describing the uptake
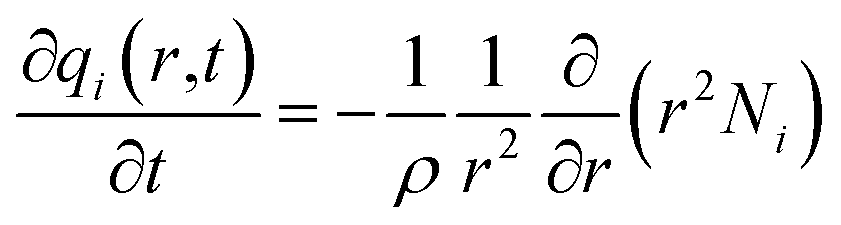 | (5) |
The molar flux Ni of component i may be described by the simplified version of the Maxwell–Stefan equations in which both correlation effects and thermodynamic coupling effects are considered to be of negligible importance21
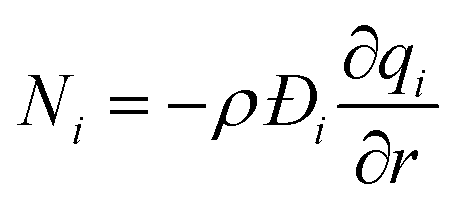 | (6) |
Summing eqn (4) over all n species in the mixture allows calculation of the total average molar loading of the mixture within the crystallite
 | (7) |
The interstitial gas velocity is related to the superficial gas velocity by
 | (8) |
In developing the concept of the separation potential, we assume that the value of  is large enough to ensure that intra-crystalline gradients are absent and the entire crystallite particle can be considered to be in thermodynamic equilibrium with the surrounding bulk gas phase at that time t, and position z of the adsorber
 | (9) |
The molar loadings qi(t,z) are calculated using the IAST for mixture adsorption equilibrium using the bulk gas phase partial pressures pi at that position z and time t. It should be noted that the applicability of the IAST is restricted to cases in which there is a homogenous distribution of adsorbate species throughout the microporous framework. The IAST fails for cases in which there is strong hydrogen bonding between the adsorbates, as is the case for water/alcohol, and alcohol/aromatic mixtures.31–34 The IAST predictions will also fail when strong segregation effects are present; examples of segregated adsorption include preferential siting of CO2 at the window regions,35–37 preferential location at the intersections of network of channels,38 or within pockets.9 Other conditions under which IAST calculations are not of adequate accuracy are discussed by Cessford et al.39
The adsorber bed, that is operated under isothermal, isobaric conditions, is assumed to be initially free of adsorbates, i.e. we have the initial condition
| t = 0; qi(0,z) = 0 | (10) |
Eqn (10) is relevant to the operation of the transient breakthrough experiments on a laboratory scale, but are not truly reflective of industrial operations.
At time, t = 0, the inlet to the adsorber, z = 0, is subjected to a step input of the n-component gas mixture and this step input is maintained till the end of the adsorption cycle when steady-state conditions are reached.
| t ≥ 0; pi(0,t) = pi0; u(0,t) = u0 | (11) |
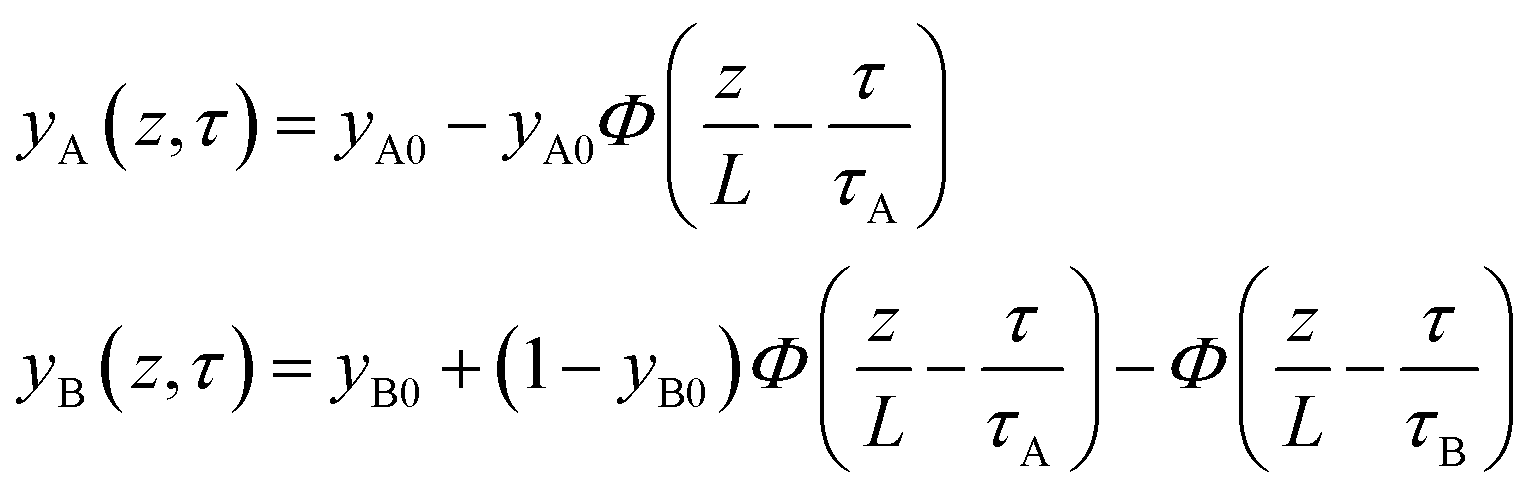
As illustration, Fig. 3 presents results of transient breakthrough simulations for the concentrations, and loadings along the length for 20/80 Xe/Kr mixtures in a fixed bed packed with SBMOF-2;40 for visual appreciation of the traversal of concentration and loading “fronts” along the length of the fixed bed, video animations are available as ESI.† The traversal velocity for the more strongly adsorbed Xe is significantly lower than that of the poorly adsorbed Kr.17,41 We define the displacement time interval, Δτ = τXe − τKr, as the difference between the breakthrough times of Xe and Kr; during this interval, pure Kr with <1000 ppm Xe can be recovered, as demanded by industrial process requirements.14 From a material balance on the adsorber, the productivity of pure Kr is determined to be 4.46 moles per L of adsorbent MOF that is loaded in the fixed bed. In this article, we consistently choose to express the productivities in volumetric terms because the comparison of different MOFs for the same separation task is on the basis of fixed bed units containing the same volume of MOF adsorbent particles.
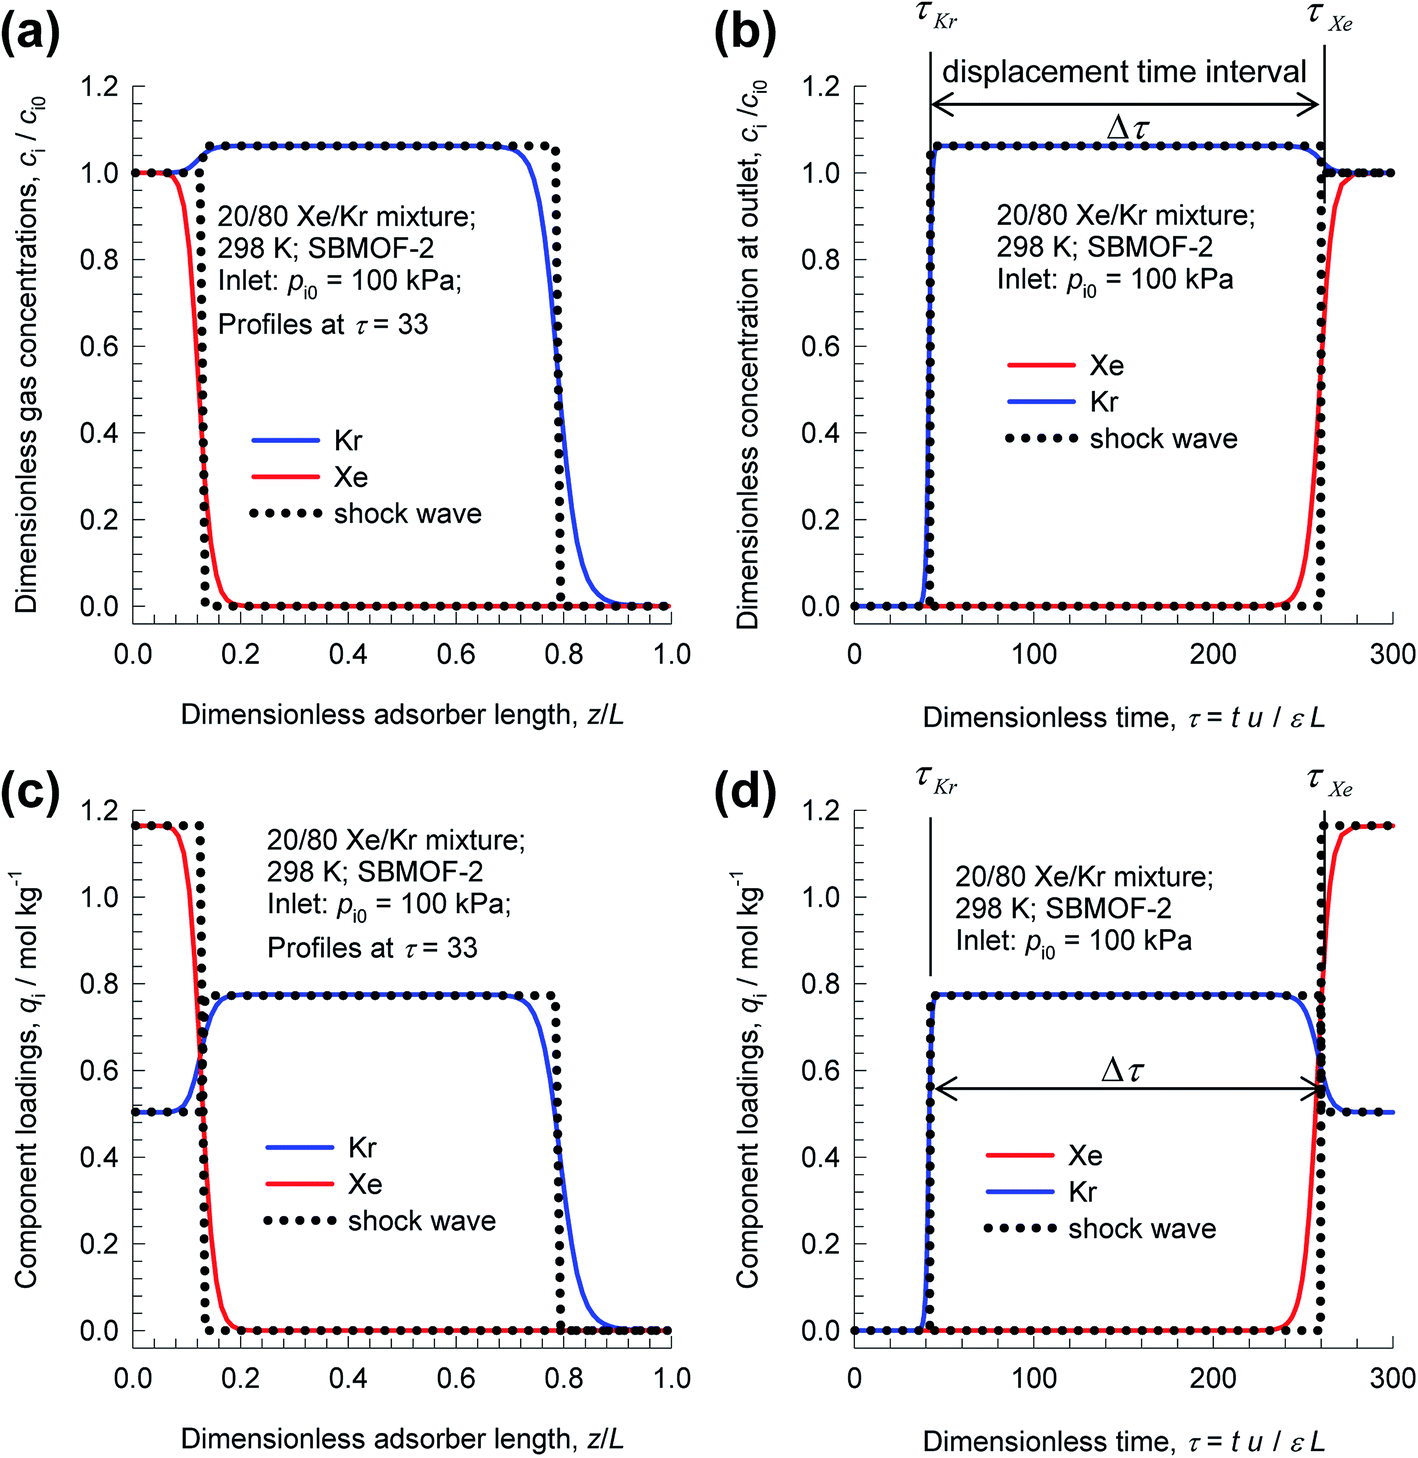 | ||
| Fig. 3 Transient breakthrough simulations for 20/80 Xe/Kr mixtures at 298 K and 100 kPa in a fixed bed packed with SBMOF-2. (a) Plot of dimensionless gas phase concentrations of Xe and Kr along the dimensionless length of the adsorber, z/L, monitored at τ = 33. (b) Plot of dimensionless gas phase concentrations of Xe and Kr at the position z = L, as a function of the dimensionless time, τ = tu/Lε. (c) Plot of component molar loadings along the dimensionless length of the adsorber, z/L, monitored at τ = 33. (d) Plot of component molar loadings at z = L, as a function of the dimensionless time, τ = tu/Lε. Video animations showing the spatio-temporal development of concentrations and loadings are also provided as ESI.† | ||
It is noteworthy that the spatio-temporal development of concentrations and loadings have distended characteristics, even though axial dispersion and diffusional resistances are ignored in eqn (3); for more detailed discussion of breakthrough characteristics, see the monographs of Ruthven.17,41 Such distended characteristics result in diminished productivity of pure Kr. The degree of distention of the concentration fronts is dictated, inter alia, by the adsorption selectivity, SA/B; higher selectivity values generally lead to sharper fronts.
In proceeding further, it is necessary to quantify the characteristics of an “ideal” fixed bed adsorber. If the concentration and loading “fronts” were to traverse the column as “shock waves”, the spatio-temporal distributions of gas phase mole fractions, for an A/B mixture, are described by42
 | (12) |
 | (13) |
The mole fraction yB in eqn (13) refers to composition of the feed mixture. In this article, the evaluation of the separation performance using the ΔQB/A is consistently based on the feed mixture composition entering the fixed bed adsorber, that is initially free of adsorbates (cf. eqn (10)).
For 20/80 Xe/Kr separation with SBMOF-2, with pA = 20 kPa, pB = 80 kPa, IAST calculations yield QA = 1.52 mol L−1, QB = 0.66 mol L−1, Sads = 9.25, ΔQ = 5.4 mol L−1, somewhat higher than the Kr productivity value of 4.46 mol L−1, determined from breakthrough simulations. Analogous calculations for the other five MOFs considered in Fig. 1a, enable the construction of a plot of the productivity of pure Kr versus the values of 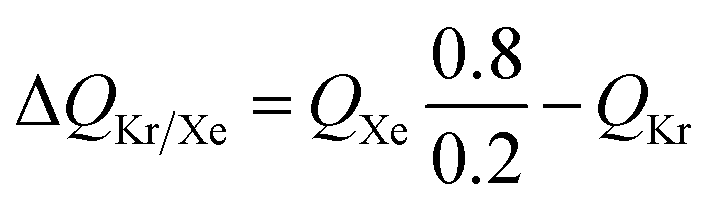 , calculated from eqn (13); see Fig. 4a. The two sets of data are linearly inter-related, leading us to conclude that the use of the metric ΔQKr/Xe leads to the same hierarchy of Kr productivities as that obtained from transient breakthrough simulations.
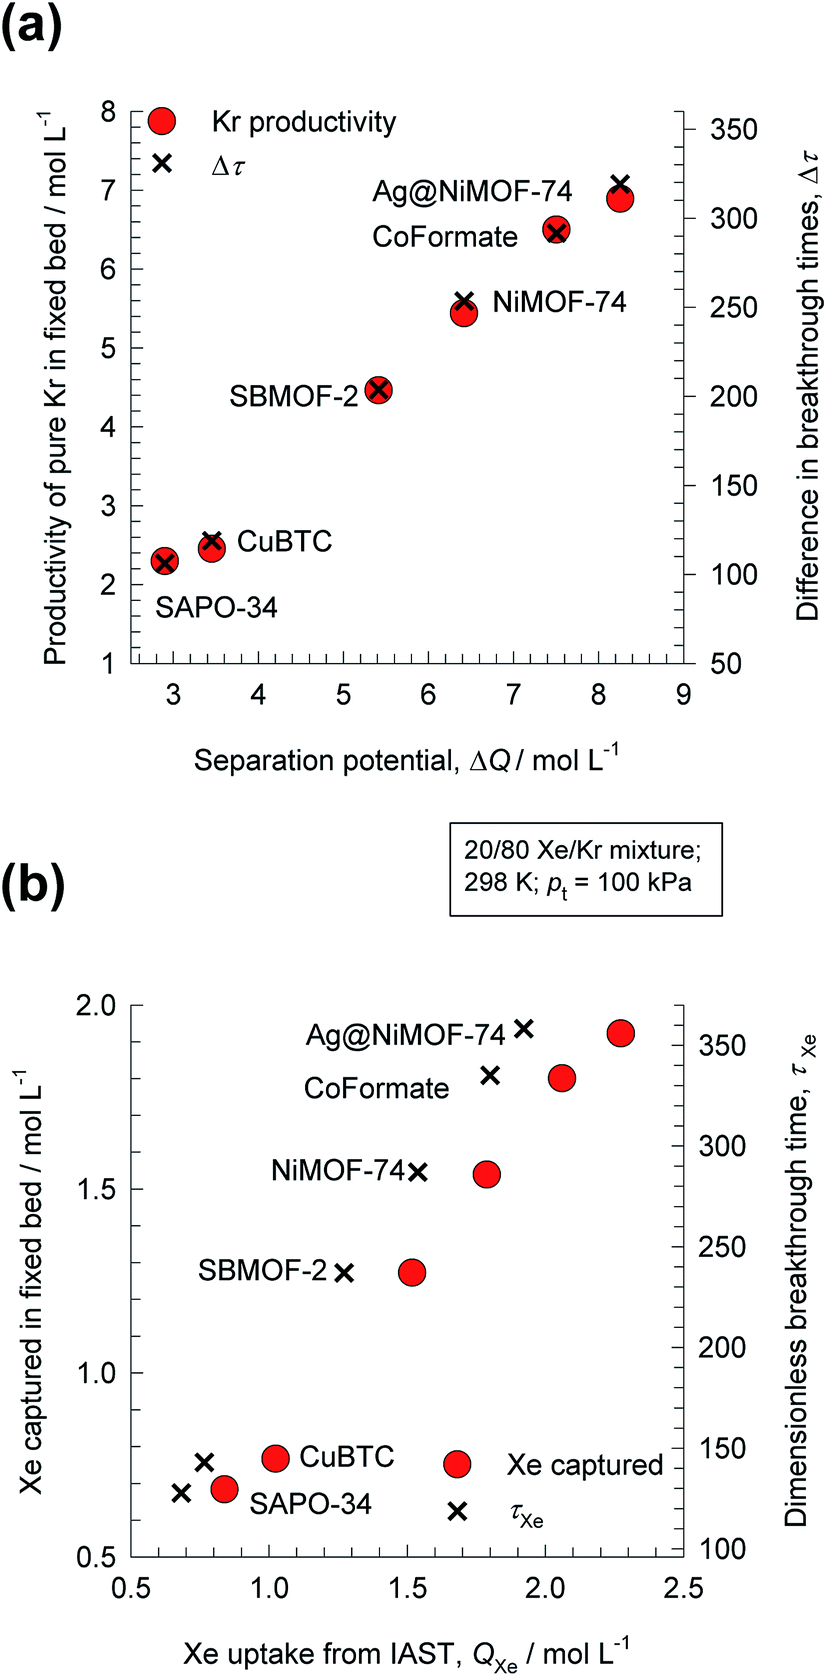 | ||
Fig. 4 (a) Plot of pure Kr (containing <1000 ppm Xe) productivity as a function of the separation potential  , calculated from IAST for six different MOFs at temperature T = 298 K, and total pressure pt = 100 kPa. (b) Plot of Xe capture capacity in fixed bed as a function of the Xe uptake QXe, calculated from IAST. Also plotted as right y-axes are (a) Δτ = τXe − τKr and (b) τXe. , calculated from IAST for six different MOFs at temperature T = 298 K, and total pressure pt = 100 kPa. (b) Plot of Xe capture capacity in fixed bed as a function of the Xe uptake QXe, calculated from IAST. Also plotted as right y-axes are (a) Δτ = τXe − τKr and (b) τXe. | ||
Also plotted as right y-axis in Fig. 4a is the time interval Δτ = τXe − τKr, that is also found to be linearly related to the Kr productivity in the fixed bed. For screening MOFs on the basis of experimental breakthroughs, the appropriate and convenient metric would be Δτ = τXe − τKr; see Fig. S25 and S26.†
Fig. 4b compares the Xe capture capacity, determined from breakthrough simulations for the six different MOFs, with the IAST calculated values of Xe uptake QXe, calculated from the IAST; the inter-dependence is precisely linear; the actual productivity values are slightly lowered below QXe. Furthermore, the Xe capture capacity is also found to be linearly related to the breakthrough time for Xe, τXe, plotted as right y-axis in Fig. 4b. It is also interesting to note that the same hierarchy of separation performance is realized for the six MOFs, whether compared on the basis of Kr productivity or Xe capture capacity.14
For CO2 capture from flue gases and natural gas streams, the appropriate metric for screening and ranking MOFs is the CO2 uptake capacity, QCO2. This is precisely equivalent to screening on the basis of the breakthrough time for CO2, τCO2, in view of the linear inter-dependence of τCO2, and QCO2. Indeed, Xiang et al.27 have used the metric τCO2 for screening MOFs and zeolites for CO2 capture applications.
The corresponding expression for the separation potential for the desorption cycle is  and represents that productivity of pure A that can be recovered in the gas phase exiting the desorption bed. Breakthrough simulations for the desorption cycle of 20/80 Xe/Kr separations show that the hierarchy of productivities of pure Xr (with <1000 ppm Kr) of the six MOFs is the same as that found in Fig. 4; see Fig. S13.† Furthermore, it is noteworthy that the hierarchy dictated by ΔQB/A does not follow that of SA/B, as can be verified by comparison of Fig. 4 with Fig. 1a.
Analogous results to those presented in Fig. 4a and b are obtained for separations of the five different binary mixtures: C2H2/CO2, n-pentane (nC5)/2-methylbutane (2MB), C2H2/C2H4, C2H4/C2H6, and C3H6/C3H8; the obtained results are summarized in Fig. 5a–f. In all cases, the productivity of the less-strongly adsorbed component in fixed beds containing identical volumes of different MOFs, is linearly related with separation potential,  , determined from IAST. This linear relationship also holds for separation of 50/50 CO2/CH4, 15/85 CO2/N2, and 20/80 CO2/H2 mixtures; see the results presented in Fig. 6. Some important conclusions to be drawn from the results in Fig. 5 and 6 are discussed below.
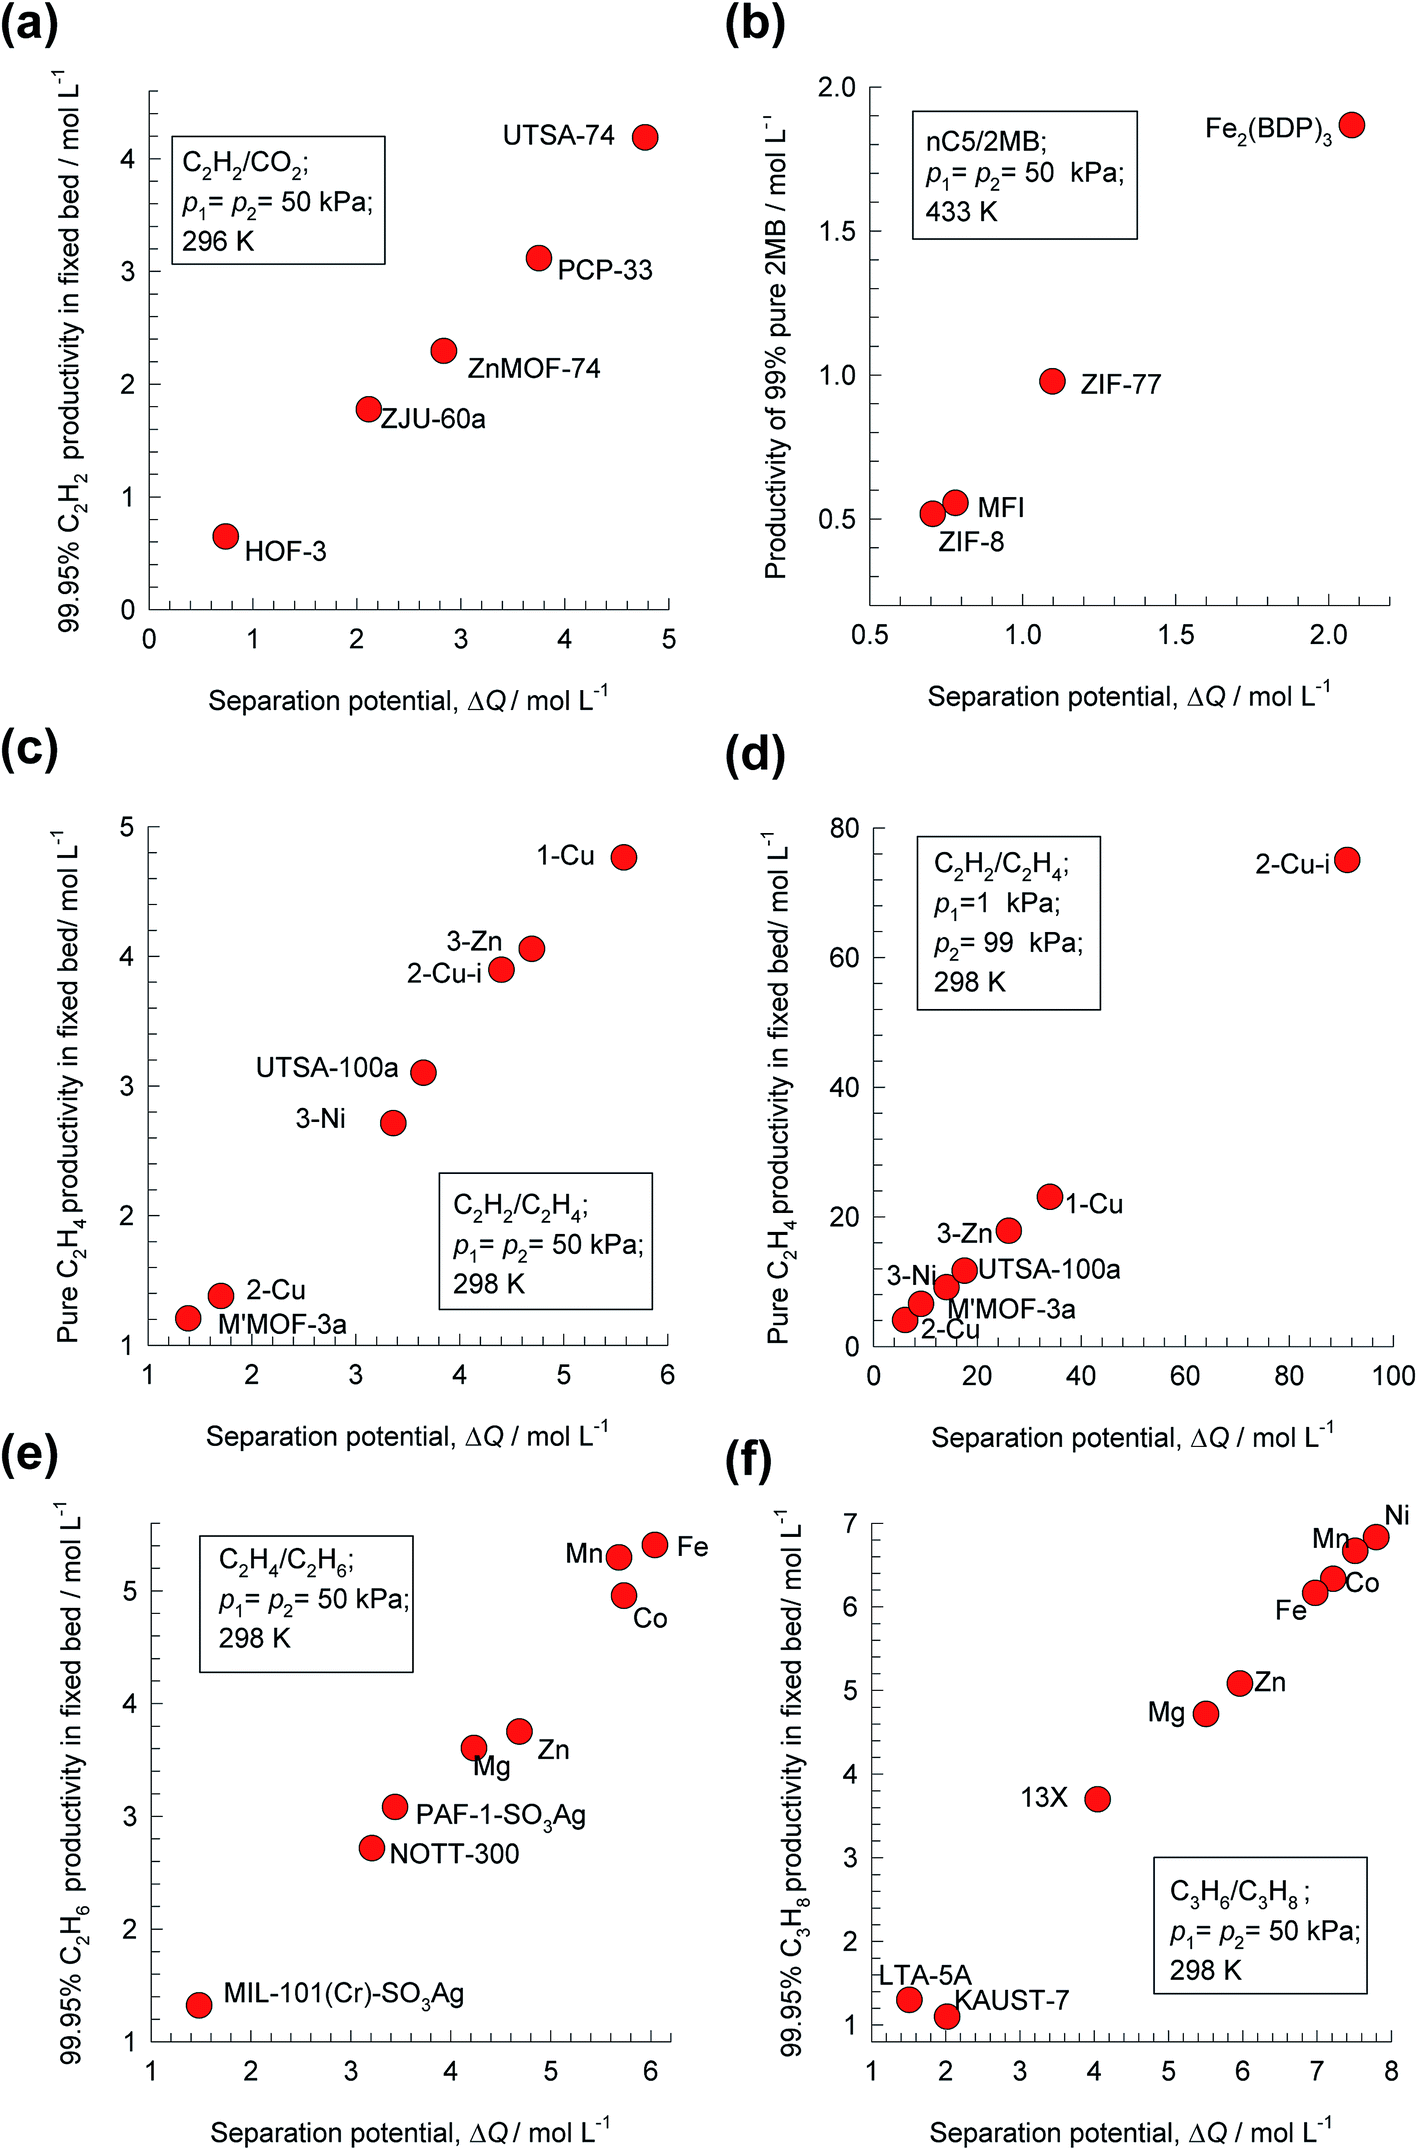 | ||
Fig. 5 Plots of the productivity of pure B, of specified purity, versus the separation potential,  , for A/B mixture separations in fixed beds. (a) 50/50 C2H2/CO2. (b) 50/50 nC5/2MB. (c) 50/50 C2H2/C2H4. (d) 1/99 C2H2/C2H4. (e) 50/50 C2H4/C2H6. (f) 50/50 C3H6/C3H8. All calculation details and structural information on the various MOFs are provided in the ESI.† , for A/B mixture separations in fixed beds. (a) 50/50 C2H2/CO2. (b) 50/50 nC5/2MB. (c) 50/50 C2H2/C2H4. (d) 1/99 C2H2/C2H4. (e) 50/50 C2H4/C2H6. (f) 50/50 C3H6/C3H8. All calculation details and structural information on the various MOFs are provided in the ESI.† | ||
 | ||
Fig. 6 Plots of the productivity of pure B, of specified purity, versus the separation potential,  , for A/B mixture separations in fixed beds. (a) 50/50 CO2/CH4 mixture at 100 kPa, (b) 50/50 CO2/CH4 mixture at 600 kPa, (c) 15/85 CO2/N2 mixture at 100 kPa, and (d) 20/80 CO2/H2 mixture at 7 MPa. All calculation details and structural information on the various MOFs are provided in the ESI.† , for A/B mixture separations in fixed beds. (a) 50/50 CO2/CH4 mixture at 100 kPa, (b) 50/50 CO2/CH4 mixture at 600 kPa, (c) 15/85 CO2/N2 mixture at 100 kPa, and (d) 20/80 CO2/H2 mixture at 7 MPa. All calculation details and structural information on the various MOFs are provided in the ESI.† | ||
For C2H2/C2H4 separations, the purity requirement of C2H4 is stringent (<40 ppm C2H2) and the MOF with the highest C2H4 productivity depends on feed mixture composition. For 50/50 mixture, the best performance is obtained with SIFSIX-1-Cu, that has the highest C2H2 uptake capacity (cf. Fig. 1b). The MOF with the highest selectivity, SIFSIX-2-Cu-i suffers from capacity limitations for 50/50 mixtures. For separation of 1/99 C2H2/C2H4 mixture separations, the best MOF is SIFSIX-2-Cu-i; in this case, capacity considerations are of significantly lesser importance. The separation potential ΔQB/A appropriately combines the separate influences of uptake, selectivity, and mixture composition.
For C2H4/C2H6 separations, the highest C2H6 productivity is realized with FeMOF-74,43 even though this MOF has a significantly lower selectivity than NOTT-300 (cf. Fig. 1c). Corresponding simulations of the desorption phase (presented in Fig. S20†) shows that FeMOF-74 also shows the highest productivity of 99.95% pure C2H4 product, that is demanded in industry as feedstock for polymerization reactors.
For 50/50 C3H6/C3H8 separations, KAUST-7, the MOF with the highest selectivity, ranks the lowest in the hierarchy of 99.95% C3H8 productivities. The highest C3H8 productivity is realized with NiMOF-74, that possesses the right balance between selectivity and uptake capacity. For 50/50 alkene/alkane separations, capacity considerations overcome any selectivity disadvantages associated with M-MOF-74 adsorbents.
One common underlying feature of all the results presented in Fig. 4–6 is that the actually productivity values are lower than the corresponding ΔQB/A values; the reasons for the diminished performance are investigated in the following section.
3. Investigation of the relative influences of selectivity and uptake capacity
To gain deeper insights into the relative importance of selectivity and capacity metrics, we investigated the separation of binary A/B mixtures using 20 different “hypothetical” HypMOFs. The unary adsorption isotherms for each HypMOF is described by the 1-site Langmuir isotherm
 | (14) |
We assume the saturation capacity of both A and B to be identical to each other; this allows the use of the mixed-gas Langmuir model to calculate mixture adsorption equilibrium
 | (15) |
Twenty different “hypothetical” HypMOFs are “constructed” by choice of the three parameters qsat, bA, bB; ten of the HypMOFs have qsat = 2.5 mol kg−1; for the other ten MOFs, qsat = 5 mol kg−1. The values of bA, bB are chosen to realize selectivities of 1.5, 2, 4, 6, 8, 10, 20, 102, 103, and 104. In all cases, the Langmuir parameters are chosen such that species A is more strongly adsorbed.
Transient breakthrough simulations for equimolar (i.e. yA = 0.5 = yB = 1 − yA) A/B mixtures in a fixed bed packed with twenty different HypMOFs were undertaken. As illustration, Fig. 7a shows transient breakthrough simulations for HypMOF-9 and HypMOF-11; HypMOF-9 has a saturation capacity qsat = 2.5 mol kg−1 and selectivity SA/B = bA/bB = 1000. HypMOF-11 has a higher saturation capacity, qsat = 5 mol kg−1, but a significantly lower selectivity SA/B = bA/bB = 1.5. For both HypMOFs, the more strongly adsorbed A is the component that elutes last; the less strongly adsorbed B breaks through earlier. For HypMOF-9, with the higher selectivity, the component B breaks through practically at the start of the breakthrough “experiment”. We demand a purity of 99.95% B in the product gas; there is a finite time interval, Δτ, during which pure 99.95% pure B can be recovered. The larger value of Δτ, the higher is the productivity of pure B.
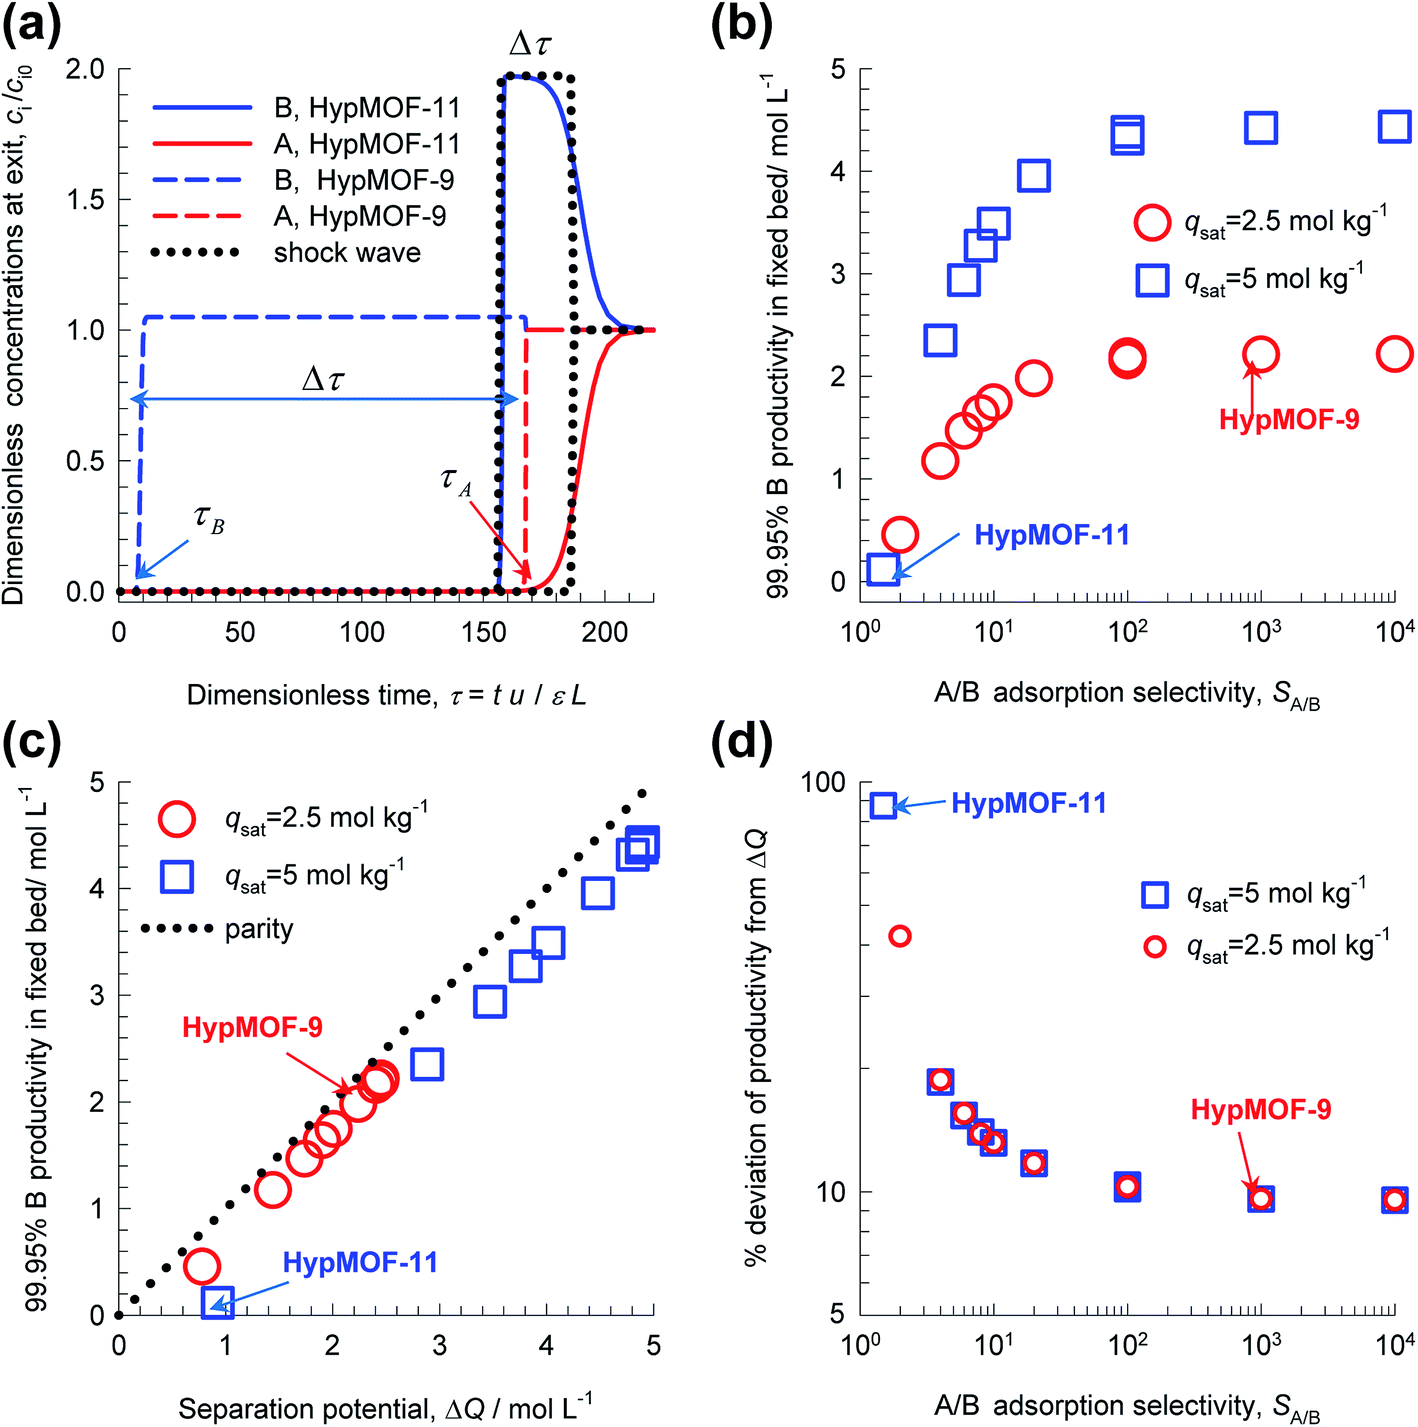 | ||
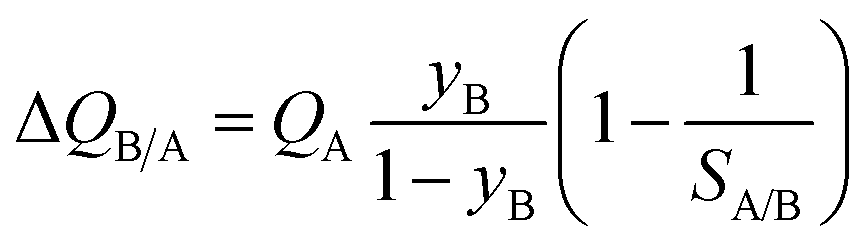
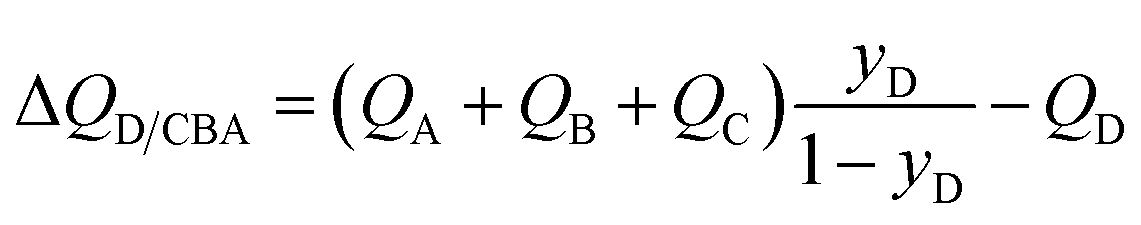
Fig. 7 (a) Transient breakthrough simulations for equimolar A/B mixtures in a fixed bed packed with HypMOF-9 and HypMOF-11, operating at 298 K, and a total pressure of 100 kPa. The plot shows the gas phase molar concentrations of A and B in the exit of the fixed bed adsorber, as a function of the dimensionless time, 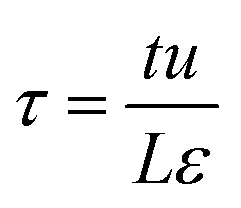 . The dotted lines represent the shock wave model for HypMOF-11. (b) Plot of the number of moles of A captured per liter of HypMOF in the fixed bed, as a function of the selectivity SA/B. (c) Plot of the number of moles of B produced per liter of HypMOF in the packed bed, as a function of the selectivity Sads. (d) Plot of the % deviation between the productivity of 99.95% pure B, determined from breakthrough simulations, with the corresponding values of the separation potential, ΔQB/A. . The dotted lines represent the shock wave model for HypMOF-11. (b) Plot of the number of moles of A captured per liter of HypMOF in the fixed bed, as a function of the selectivity SA/B. (c) Plot of the number of moles of B produced per liter of HypMOF in the packed bed, as a function of the selectivity Sads. (d) Plot of the % deviation between the productivity of 99.95% pure B, determined from breakthrough simulations, with the corresponding values of the separation potential, ΔQB/A. | ||
Fig. 7b presents a plot of the number of moles of B produced per liter of HypMOF in the packed bed, as a function of the selectivity SA/B; higher productivities are realized with MOFs having the higher saturation capacity. Increase of selectivities above 100 does not lead to a concomitant increase in the amount of pure B that can be recovered; this implies that the total exclusion of any component, i.e. “infinite” selectivities, may not be the fruitful strategy to adopt for MOF development. To appreciate the influence of selectivity of the productivities, we combine eqn (1) and (13) to obtain
 | (16) |
If SA/B ≫ 1,  , and the productivity of pure B is not influenced by selectivity but is purely dictated by the uptake capacity of the more strongly adsorbed component A. Conversely, for “difficult” separations, with values of 1 < SA/B < 10, there is a sharp increase in productivities with increased SA/B.
In consonance with the results in Fig. 4, and 5, Fig. 7c shows that the productivity of pure B is linearly correlated with the separation potential ΔQB/A. The dotted line is the parity line, underscoring the fact that the actual productivities are lower than ΔQB/A. The % deviation of the actual productivities from ΔQB/A are plotted in Fig. 7d; the higher the selectivity the smaller is the deviation from ΔQB/A. The reasoning is that higher selectivities lead to sharper concentration fronts, and closer approach to the shock wave “idealization” of breakthroughs. For a selectivity value of 104, there is only a 10% deviation from ΔQB/A. Put another way, high values of selectivity allows the separation potential to be reached more closely, but the potential itself is largely influenced by saturation capacity and component uptakes.
The foregoing discussions help us appreciate why NOTT-300 and KAUST-7 do not exhibit high productivities in alkene/alkane separations in fixed bed units (cf. Fig. 5e and f), despite possessing high selectivities: both these MOFs suffer severe capacity limitations.
4. The separation potential for multicomponent mixtures
Many industrially processes involve separations of mixtures containing more than two components, and the shock wave model can be readily extended to n-component mixtures, as detailed in the ESI.† For separation of a quaternary A/B/C/D mixture in which component D, with the lowest adsorption strength, needs to be recovered in pure form from the exiting gas stream from the fixed bed, the expression for the separation potential for D/CBA separation is
 | (17) |
For recovery of pure E from a 5-component A/B/C/D/E mixture, expression for the separation potential is an intuitive extrapolation of eqn (17):
 | (18) |
In the event the desired product exiting the fixed bed is the combination (E + D), the appropriate separation potential for the ED/CBA “cut” is
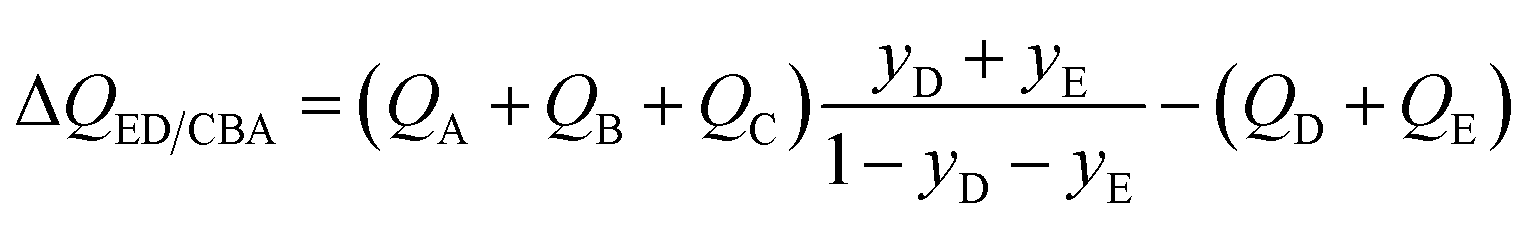 | (19) |
The use of eqn (17)–(19) will be illustrated for H2 purification and the separation of hydrocarbon isomers.
Pressure swing adsorption is the most commonly used technology for recovery of pure hydrogen from a gaseous streams containing 60–90 mol% H2.44 Steam-methane reformer off-gas, after it has been further treated in a water–gas shift reactor, is a commonly used feed gas stream, with typical compositions 70–80% H2, 15–25% CO2, 3–6% CH4, and 1–3% CO.29,44,45 The production of pure H2 from steam-methane reformer off-gas requires operation of PSA units at pressures reaching about 7 MPa. Typically, H2 is required with 99.95% + purity.44 There is no unique and unambiguous definition of adsorption selectivity that is appropriate for H2 purification processes. As illustration, Fig. 8a shows the component mole fractions in the exit gas from a fixed bed packed with CuTDPAT, fed with 40/5/5/50 CO2/CO/CH4/H2 mixtures at 298 K and 6 MPa.46 The sequence of breakthroughs is H2, CH4, CO, and CO2. The purity of H2 in the product gas exiting the adsorber is primarily dictated by the presence of CO, and CH4, rather than CO2, that is the main impurity in the feed gas mixture. The CO/H2, and CH4/H2 adsorption selectivities are far more relevant than the CO2/H2 selectivity. There is a finite time interval during which pure H2, of the required 99.95% + purity, can be recovered from the gases exiting the fixed bed.
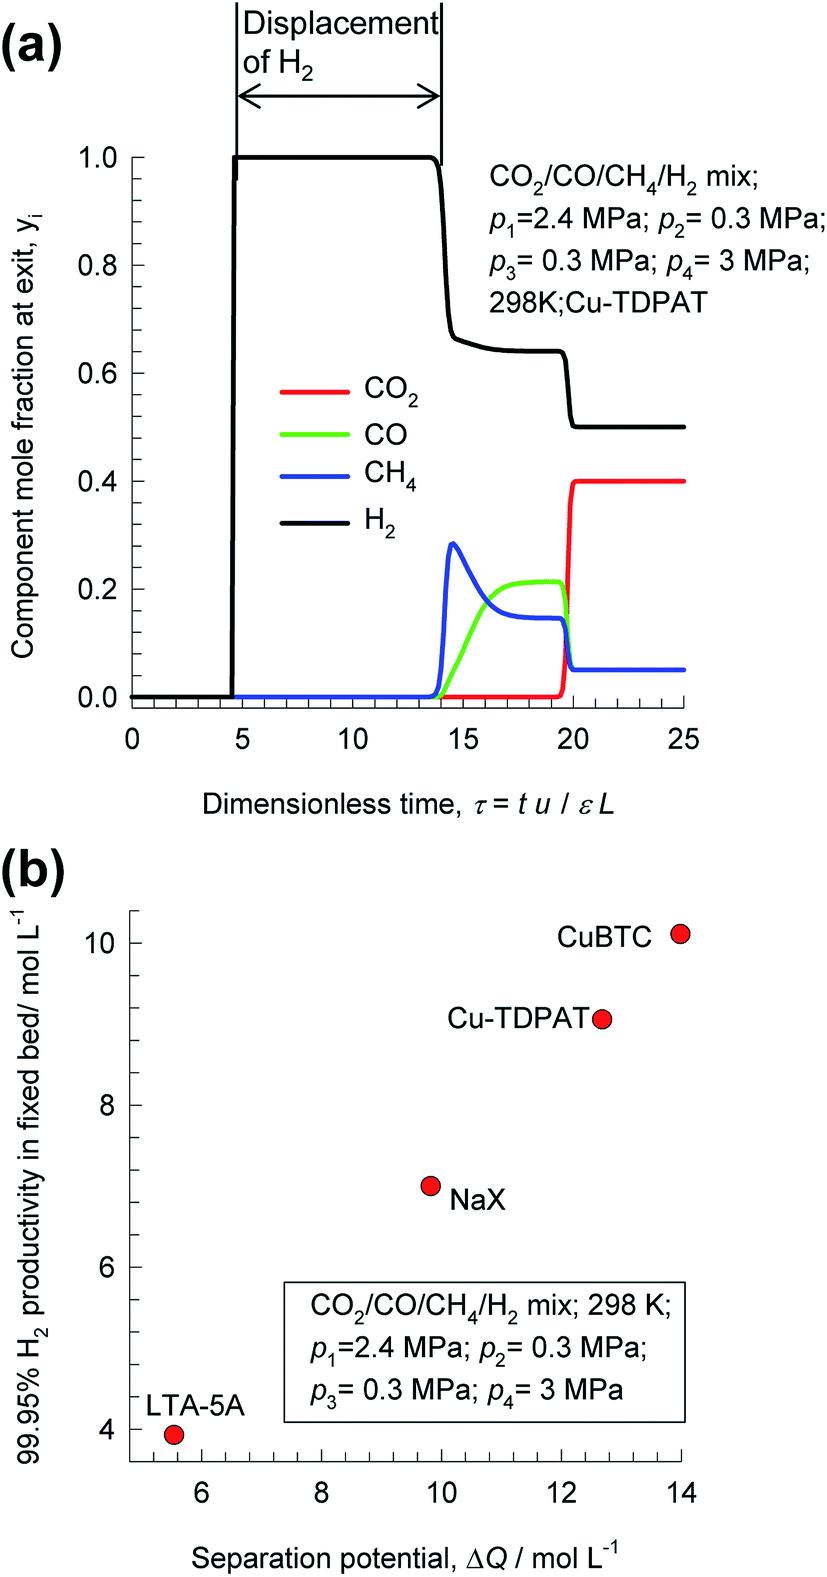 | ||
| Fig. 8 (a) Transient breakthrough simulations for separation of 40/5/5/50 CO2/CO/CH4/H2 mixtures at 298 K and 6 MPa in fixed bed adsorber packed with CuTDPAT. (a) Comparison of productivities of 99.95% pure H2 for separation of 40/10/50 CO2/CH4/H2 mixtures at 298 K and 7 MPa, plotted as a function of the separation potential, ΔQH2/(CO+CH4+CO2), calculated from eqn (17) and IAST. All calculation details and structural information on the various MOFs are provided in the ESI.† | ||
Fig. 8b presents a comparison of productivities of four different adsorbents, plotted as a function of the separation potential, ΔQH2/(CO+CH4+CO2) from IAST calculations of eqn (17); the linear inter-dependence confirms that ΔQH2/(CO+CH4+CO2) is the right combined metric for screening of MOFs. Also noteworthy is the CuBTC is the best MOF for this separation task; this is because CO2/H2 selectivity is largely irrelevant for H2 production processes even though CO2 may be the present as the largest impurity in the feed mixture.
The separation of hexane isomers, n-hexane (nC6), 2-methylpentane (2MP), 3-methylpentane (3MP), 2,2 dimethylbutane (22DMB), and 2,3 dimethylbutane (23DMB) is required for production of high-octane gasoline. The values of the Research Octane Number (RON) increases with the degree of branching; the RON values are: nC6 = 30, 2MP = 74.5, 3MP = 75.5, 22DMB = 94, 23DMB = 105. Therefore, di-branched isomers are preferred products for incorporation into the high-octane gasoline pool.21,47,48 Typically, we aim to product a product with a RON value higher than 92. As illustration, Fig. 9a shows the transient development of exit gas compositions from a bed packed with MgMOF-74 with an equimolar 5-component feed mixture. Product gas with 92+ RON can be recovered from the displacement interval in which the di-branched isomers 22DMB and 23DMB are eluted, as indicated. When the mono-branched isomers break through, there is a sharp decrease in the RON of the product gas. The desired separation is between (22DMB + 23DMB), and (nC6 + 2MP + 3MP). The appropriate expression for the separation potential is
 | (20) |
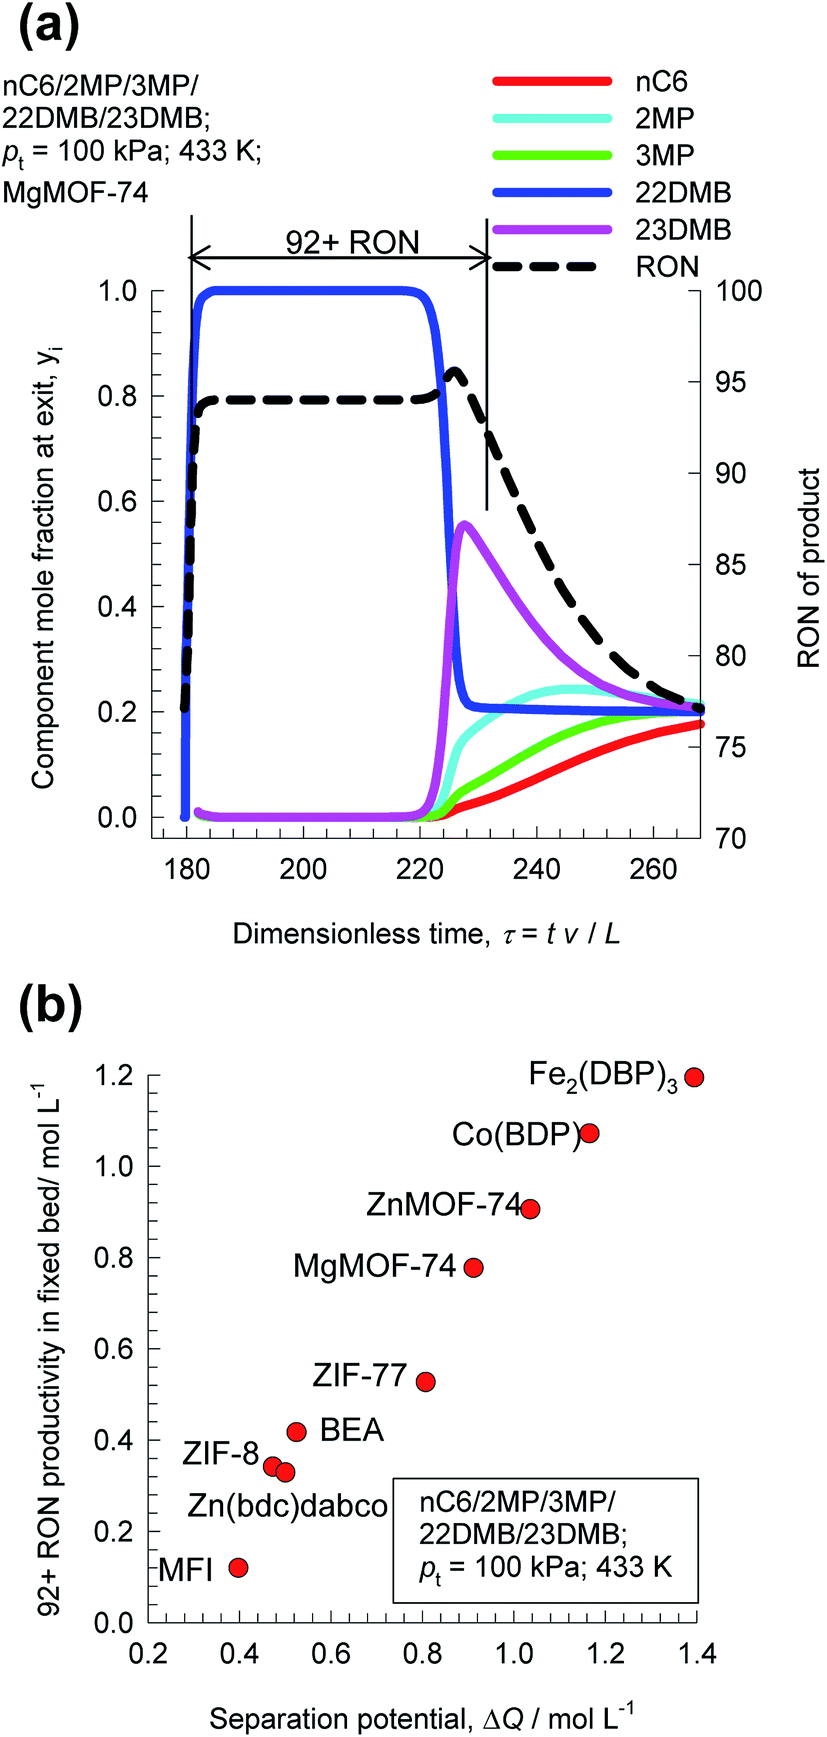 | ||
| Fig. 9 (a) Transient breakthrough simulations for separation of equimolar nC6/2MP/3MP/22DMB/23DMB mixtures at 433 K and 100 kPa in fixed bed adsorber packed with MgMOF-74. Also shown is the RON of product gas at the outlet of fixed bed. (b) Comparison of 92+ RON productivity for operation at total pressure of 100 kPa, plotted as a function of the separation potential ΔQ(22DMB+23DMB)/(nC6+2MP+3MP), calculated from eqn (19) and IAST. All calculation details and structural information on the various MOFs are provided in the ESI.† | ||
 | ||
| Fig. 10 The separation potential, ΔQ(oX+mX+EthBz)/pX for separation of 4-component o-xylene/m-xylene/p-xylene/ethylbenzene mixtures plotted against the volumetric uptake of p-xylene. All calculation details and structural information on the various MOFs are provided in the ESI.† | ||
Fig. 9b compares 92+ RON productivities for nine different adsorbent materials: ZnMOF-74, MgMOF-74, Co(BDP), Fe2(BDP)3, MFI, BEA, ZIF-8, Zn(bdc)dabco, and ZIF-77, plotted as a function of the separation potential ΔQ(22DMB+23DMB)/(nC6+2MP+3MP); the interdependence is linear and we conclude that the best performing MOF for this separation duty is Fe2(BDP)3; this conclusion is in line with the earlier work of Herm et al.49
The production of p-xylene involves the separation of 4-component equimolar o-xylene(1)/m-xylene(2)/p-xylene(3)/ethylbenzene(4) mixtures.19,50,51 The volumetric separation potential for preferential adsorption of p-xylene, and rejection of o-xylene, m-xylene, and ethylbenzene is
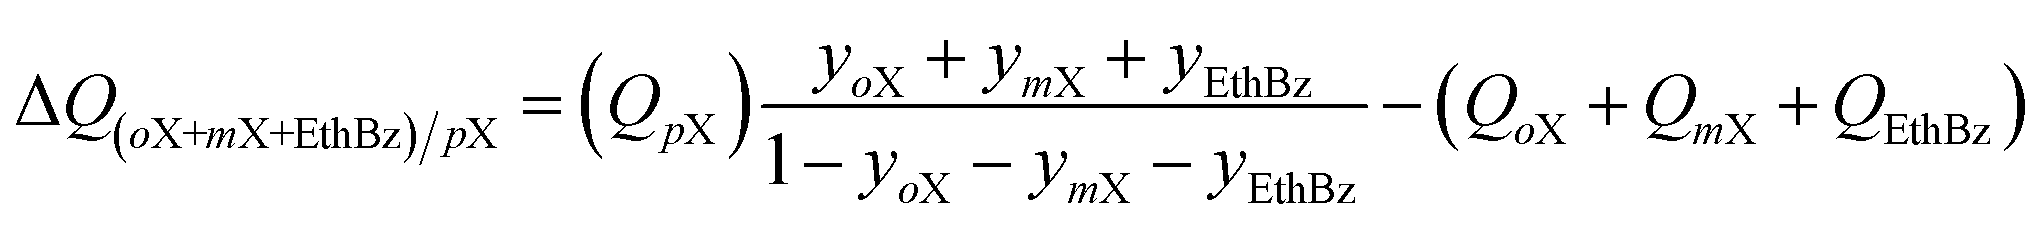 | (21) |
Screening adsorbents using the combined metric ΔQ(oX+mX+EthBz)/pX shows that the best separation performance is achieved with DynaMOF-100 that represents a Zn(II)-based dynamic coordination framework, [Zn4O(L)3] where the ligand L = 4,4′-((4-(tert-butyl)-1,2-phenylene)bis(oxy))dibenzoate, whose synthesis has been reported by Mukherjee et al.52,53 The framework of DynaMOF-100 gets transformed in such a manner as to allow optimal packing of p-xylene within the cavities. The superiority of DynaMOF-100 over the commercially used BaX zeolite needs to be established by further experimental investigations.
5. Limitations of the concept of separation potential
The expression developed for the combined metric ΔQ is applicable to fixed beds that are initially free of adsorbates; consequently, the application of this metric is restricted to screening purposes, and not to process modelling. Another key assumption in deriving the simple expression for ΔQ is that intra-crystalline gradients are absent and the entire crystallite particle can be considered to be in thermodynamic equilibrium with the surrounding bulk gas phase at that time t, and position z of the adsorber; see eqn (9). The validity of this assumption depends on the value of the parameter . For low values of diffusivities, and/or large sizes of crystals, the influence of intra-crystalline diffusion cannot be ignored. Herm et al.49 have screened MOFs for separation of hexane isomers by detailed transient breakthrough simulations including intra-crystalline diffusion effects; they demonstrate that inclusion of such effects alters the separation hierarchy.
There are instances of diffusion-selective operations in which diffusional effects over-ride the influence of mixture adsorption equilibrium and is the prime driver for separations.17,54–56 Examples of diffusion-selective separations include: (1) selective uptake of N2 from N2/CH4 mixtures using LTA-4A zeolite and Ba-ETS-4,57–59 and (2) selective uptake of O2 from O2/N2 mixtures using LTA-4A zeolite and CMS.55,60–63 The concept of separation potential cannot be directly applied to screen MOFs for diffusion-selective separations; a completely different approach is required.
Another important limitation of screening MOFs on the basis of ΔQ is that this metric does not take account of the regeneration costs, that are dictated largely by the isosteric heat of adsorption, Qst, of the more strongly adsorbed component. The extension of the expression for ΔQ to include the Qst parameter is a fruitful area for further research.
6. Conclusions
A comparative evaluation of MOFs for separating mixtures of Xe/Kr, C2H2/CO2, C2H2/C2H4, C2H4/C2H6, C3H6/C3H8, CO2/CH4, CO2/N2, CO2/H2, CO2/CO/CH4/H2, and hydrocarbon isomers in fixed beds has been carried out using a combination of transient breakthrough simulations, and the IAST for mixture adsorption equilibrium. The following major conclusions emerge from this study.(1) The separation performance in fixed bed devices is governed by a combination of adsorption selectivity, and uptake capacity. Increase of selectivity values above 100, may not lead to a corresponding increase in productivity.
(2) Low uptake capacities diminish the separation performance of MOFs with high selectivities. A good illustration is KAUST-7 that has the highest selectivity for C3H6/C3H8 separations but is severely capacity limited; consequently, the capability of this MOF to produce 99.95% pure product is the lowest amongst the investigated adsorbent materials.
(3) The separation potential ΔQ, that is calculable on the basis of IAST provides a simple and convenient metric to screen and rank the separation capability of MOFs. The value of ΔQ defines the upper limit to the achievable separations in fixed bed units. The actual separations in fixed bed adsorbers will be lower than the IAST-calculated ΔQ values because of distended breakthroughs. Use of ΔQ for screening purposes obviates the need for performing transient breakthrough calculations.
(4) The concept of ΔQ is particularly advantageous for multicomponent separations because it combines several selectivities and uptake capacities into one combined metric that quantifies the desired separation task in hand.
(5) The concept of the separation potential can be straightforwardly incorporated into large-scale computational screening of MOFs.1–3
An important limitation of the treatment presented in this work is that the combined metric ΔQ describes the productivity for conditions in which diffusional limitations are absent. When diffusional effects are of significant importance, the simple concept of separation potential is inadequate for gauging separation performance, and detailed simulations including diffusional effects are necessary.19,21
In using ΔQ for screening, trace impurities, such as water vapor, that may be present in the mixtures have been ignored; the limitations of this assumption have been detailed by Burtch et al.64 Furthermore, other aspects such as manufacturing costs for the adsorbents and regeneration costs need to be taken into consideration in the evaluation of MOFs.
Notation
| b | Langmuir constant, Pa−1 |
| ci | Molar concentration of species i in gas mixture, mol m−3 |
| ci0 | Molar concentration of species i in gas mixture at inlet to adsorber, mol m−3 |
| Ði | Maxwell–Stefan diffusivity, m2 s−1 |
| L | Length of packed bed adsorber, m |
| n | Number of species in the mixture, dimensionless |
| Ni | Molar flux of species i, mol m−2 s−1 |
| pi | Partial pressure of species i in mixture, Pa |
| pt | Total system pressure, Pa |
| qi | Molar loading of species i, mol kg−1 |
| qi,sat | Molar loading of species i at saturation, mol kg−1 |
| qt | Total molar loading in mixture, mol kg−1 |
| Q | Volumetric loading in adsorbed phase, mol m−3 |
| ΔQ | Separation potential, mol m−3 |
| Qst | Isosteric heat of adsorption, J mol−1 |
| r | Radial coordinate, m |
| rc | Radius of crystallite, m |
| SA/B | Adsorption selectivity, dimensionless |
| t | Time, s |
| T | Absolute temperature, K |
| u | Superficial gas velocity in packed bed, m s−1 |
| v | Interstitial gas velocity in packed bed, m s−1 |
| y | Gas phase mole fraction, dimensionless |
| z | Distance along the adsorber, m |
Greek letters
| ε | Voidage of packed bed, dimensionless |
| ρ | Framework density, kg m−3 |
| τ | Time, dimensionless |
Subscripts
| A | Referring to component A |
| B | Referring to component B |
| i | Referring to component i |
| t | Referring to total mixture |
References
- Y. J. Colón and R. Q. Snurr, Chem. Soc. Rev., 2014, 43, 5735–5749 RSC.
- C. E. Wilmer, M. Leaf, C. Y. Lee, O. K. Farka, B. G. Hauser, J. T. Hupp and R. Q. Snurr, Nat. Chem., 2012, 4, 83–89 CrossRef CAS PubMed.
- N. S. Bobbitt, J. Chen and R. Q. Snurr, J. Phys. Chem. C, 2016, 120, 27328–27341 CAS.
- S. Li, Y. G. Chung and R. Q. Snurr, Langmuir, 2016, 32, 10368–10376 CrossRef CAS PubMed.
- A. N. Dickey, A. Ö. Yazaydın, R. R. Willis and R. Q. Snurr, Can. J. Chem. Eng., 2012, 40, 825–832 CrossRef.
- C. E. Wilmer and R. Q. Snurr, Chem. Eng. J., 2011, 171, 775–781 CrossRef CAS.
- K. C. Kim, P. Z. Moghadam, D. Fairen-Jimenez and R. Q. Snurr, Ind. Eng. Chem. Res., 2015, 54, 3257–3267 CrossRef CAS.
- Y. G. Chung, P. Bai, M. Haranczyk, K. T. Leperi, P. Li, H. Zhang, T. C. Wang, T. Duerinck, F. You, J. T. Hupp, O. K. Farha, J. I. Siepmann and R. Q. Snurr, Chem. Mater., 2017 DOI:10.1021/acs.chemmater.7b01565.
- P. Ryan, O. K. Farha, L. J. Broadbelt and R. Q. Snurr, AIChE J., 2011, 57, 1759–1766 CrossRef CAS.
- A. L. Myers and J. M. Prausnitz, AIChE J., 1965, 11, 121–130 CrossRef CAS.
- H. Wang, K. Yao, Z. Zhang, J. Jagiello, Q. Gong, Y. Han and J. Li, Chem. Sci., 2014, 5, 620–624 RSC.
- R. Krishna, J. Phys. Chem. C, 2009, 113, 19756–19781 CAS.
- R. Krishna and J. M. van Baten, Mol. Simul., 2009, 35, 1098–1104 CrossRef CAS.
- D. Banerjee, A. J. Cairns, J. Liu, R. Krishna, P. K. Thallapally and D. M. Strachan, Acc. Chem. Res., 2015, 48, 211–219 CrossRef CAS PubMed.
- X. Cui, K. Chen, H. Xing, Q. Yang, R. Krishna, Z. Bao, H. Wu, W. Zhou, X. Dong, Y. Han, B. Li, Q. Ren, M. J. Zaworotko and B. Chen, Science, 2016, 353, 141–144 CrossRef CAS PubMed.
- A. Cadiau, K. Adil, P. M. Bhatt, Y. Belmabkhout and M. Eddaoudi, Science, 2016, 353, 137–140 CrossRef CAS PubMed.
- D. M. Ruthven, S. Farooq and K. S. Knaebel, Pressure swing adsorption, VCH Publishers, New York, 1994 Search PubMed.
- R. Krishna and J. R. Long, J. Phys. Chem. C, 2011, 115, 12941–12950 CAS.
- R. Krishna, RSC Adv., 2015, 5, 52269–52295 RSC.
- R. Kumar, Ind. Eng. Chem. Res., 1994, 33, 1600–1605 CrossRef CAS.
- R. Krishna, Microporous Mesoporous Mater., 2014, 185, 30–50 CrossRef CAS.
- L. Li, J. Yang, J. Li, Y. Chen and J. Li, Microporous Mesoporous Mater., 2014, 198, 236–246 CrossRef CAS.
- G. D. Pirngruber, L. Hamon, S. Bourelly, P. L. Llewellyn, E. Lenoir, V. Guillerm, C. Serre and T. Devic, ChemSusChem, 2012, 5, 762–776 CrossRef CAS PubMed.
- D.-L. Chen, H. Shang, W. Zhu and R. Krishna, Chem. Eng. Sci., 2014, 117, 407–415 CrossRef CAS.
- Y. He, R. Krishna and B. Chen, Energy Environ. Sci., 2012, 5, 9107–9120 CAS.
- F. Luo, C. Yan, L. Dang, R. Krishna, W. Zhou, H. Wu, X. Dong, Y. Han, T.-L. Hu, M. O'Keeffe, L. Wang, M. Luo, R.-B. Lin and B. Chen, J. Am. Chem. Soc., 2016, 138, 5678–5684 CrossRef CAS PubMed.
- S. C. Xiang, Y. He, Z. Zhang, H. Wu, W. Zhou, R. Krishna and B. Chen, Nat. Commun., 2012, 3, 954, DOI:10.1038/ncomms1956.
- T.-H. Bae, M. R. Hudson, J. A. Mason, W. L. Queen, J. J. Dutton, K. Sumida, K. J. Micklash, S. S. Kaye, C. M. Brown and J. R. Long, Energy Environ. Sci., 2013, 6, 128–138 CAS.
- A. M. Banu, D. Friedrich, S. Brandani and T. Düren, Ind. Eng. Chem. Res., 2013, 52, 9946–9957 CrossRef CAS.
- R. Krishna and R. Baur, Sep. Purif. Technol., 2003, 33, 213–254 CrossRef CAS.
- R. Krishna and J. M. van Baten, J. Membr. Sci., 2010, 360, 476–482 CrossRef CAS.
- J. J. Gutierrez-Sevillano, S. Calero and R. Krishna, J. Phys. Chem. C, 2015, 119, 3658–3666 CAS.
- J. J. Gutierrez-Sevillano, S. Calero and R. Krishna, Phys. Chem. Chem. Phys., 2015, 17, 20114–20124 RSC.
- R. Krishna and J. M. van Baten, Langmuir, 2010, 26, 10854–10867 CrossRef CAS PubMed.
- R. Krishna and J. M. van Baten, Chem. Phys. Lett., 2007, 446, 344–349 CrossRef CAS.
- R. Krishna and J. M. van Baten, Sep. Purif. Technol., 2008, 61, 414–423 CrossRef CAS.
- R. Krishna and J. M. van Baten, Chem. Eng. Sci., 2008, 63, 3120–3140 CrossRef CAS.
- R. Krishna and J. M. van Baten, Chem. Eng. J., 2008, 140, 614–620 CrossRef CAS.
- N. F. Cessford, N. A. Seaton and T. Düren, Ind. Eng. Chem. Res., 2012, 51, 4911–4921 CrossRef CAS.
- X. Chen, A. M. Plonka, D. Banerjee, R. Krishna, H. T. Schaef, D. Ghose, P. K. Thallapally and J. B. Parise, J. Am. Chem. Soc., 2015, 137, 7007–7010 CrossRef CAS PubMed.
- D. M. Ruthven, Principles of Adsorption and Adsorption Processes, John Wiley, New York, 1984 Search PubMed.
- G. Kluge, T. Franke, R. Schöllner and G. Nagel, Chem. Eng. Sci., 1991, 46, 368–371 CrossRef CAS.
- E. D. Bloch, W. L. Queen, R. Krishna, J. M. Zadrozny, C. M. Brown and J. R. Long, Science, 2012, 335, 1606–1610 CrossRef CAS PubMed.
- S. Sircar and T. C. Golden, Sep. Sci. Technol., 2000, 35, 667–687 CrossRef CAS.
- A. M. Ribeiro, C. A. Grande, F. V. S. Lopes, J. M. Loureiro and A. E. Rodrigues, Chem. Eng. Sci., 2008, 63, 5258–5273 CrossRef CAS.
- H. Wu, K. Yao, Y. Zhu, B. Li, Z. Shi, R. Krishna and J. Li, J. Phys. Chem. C, 2012, 116, 16609–16618 CAS.
- R. Krishna and J. M. van Baten, Sep. Purif. Technol., 2007, 55, 246–255 CrossRef CAS.
- D. Dubbeldam, R. Krishna, S. Calero and A. Ö. Yazaydın, Angew. Chem., Int. Ed., 2012, 51, 11867–11871 CrossRef CAS PubMed.
- Z. R. Herm, B. M. Wiers, J. M. Van Baten, M. R. Hudson, P. Zajdel, C. M. Brown, N. Maschiocchi, R. Krishna and J. R. Long, Science, 2013, 340, 960–964 CrossRef CAS PubMed.
- A. Torres-Knoop, R. Krishna and D. Dubbeldam, Angew. Chem., Int. Ed., 2014, 53, 7774–7778 CrossRef CAS PubMed.
- R. Krishna, Phys. Chem. Chem. Phys., 2015, 17, 39–59 RSC.
- S. Mukherjee, B. Joarder, B. Manna, A. V. Desai, A. K. Chaudhari and S. K. Ghosh, Sci. Rep., 2014, 4, 5761, DOI:10.1038/srep05761.
- S. Mukherjee, B. Joarder, A. V. Desai, B. Manna, R. Krishna and S. K. Ghosh, Inorg. Chem., 2015, 54, 4403–4408 CrossRef CAS PubMed.
- R. T. Yang, Gas separation by adsorption processes, Butterworth, Boston, 1987 Search PubMed.
- R. T. Yang, Adsorbents: Fundamentals and Applications, John Wiley & Sons, Inc., Hoboken, New Jersey, 2003 Search PubMed.
- J. Kärger, D. M. Ruthven and D. N. Theodorou, Diffusion in Nanoporous Materials, Wiley - VCH, Weinheim, 2012 Search PubMed.
- H. W. Habgood, Can. J. Chem., 1958, 36, 1384–1397 CrossRef CAS.
- S. J. Bhadra and S. Farooq, Ind. Eng. Chem. Res., 2011, 50, 14030–14045 CrossRef CAS.
- B. Majumdar, S. J. Bhadra, R. P. Marathe and S. Farooq, Ind. Eng. Chem. Res., 2011, 50, 3021–3034 CrossRef CAS.
- S. Farooq, M. N. Rathor and K. Hidajat, Chem. Eng. Sci., 1993, 48, 4129–4141 CrossRef CAS.
- S. Farooq, Gas Sep. Purif., 1995, 9, 205–212 CrossRef CAS.
- Y. D. Chen, R. T. Yang and P. Uawithya, AIChE J., 1994, 40, 577–585 CrossRef CAS.
- S. Sircar and A. L. Myers, in Handbook of Zeolite Science and Technology, ed. S. M. Auerbach, K. A. Carrado and P. K. Dutta, Marcel Dekker, New York, 2003, pp. 1063–1104 Search PubMed.
- N. C. Burtch, H. Jasuja and K. S. Walton, Chem. Rev., 2014, 114, 10575–10612 CrossRef CAS PubMed.
Footnote |
| † Electronic supplementary information (ESI) available: This material provides (a) methodology used for transient breakthrough simulations, (b) analytic solutions to the shock wave model for fixed bed transient operations, (c) structural information on the MOFs investigated, (d) unary isotherm data for each guest/host combination, and (e) details simulation results for each of the investigated systems. Video animations showing the spatio-temporal development of concentrations and loadings for Xe/Kr separations with SBMOF-2 are available as ESI. See DOI: 10.1039/c7ra07363a |
| This journal is © The Royal Society of Chemistry 2017 |