DOI:
10.1039/C7RA07353D
(Paper)
RSC Adv., 2017,
7, 43689-43699
Facile solvothermal synthesis of novel hetero-structured CoNi–CuO composites with excellent microwave absorption performance
Received
4th July 2017
, Accepted 4th September 2017
First published on 11th September 2017
Abstract
Hetero-structured functional materials with tailored composition that can provide excellent electromagnetic wave (EMW) absorption with minimal thickness are highly desirable, especially if they can be easily fabricated. Herein, novel hetero-structured CoNi–CuO composite microspheres were fabricated via a facile solvothermal process. The composites with adjusted mass ratios of CuO to CoNi alloy (5/1, 2.5/1 and 1.25/1) were facilely achieved by modulating the quantity of CuCl2·2H2O during the synthesis. It was demonstrated that the enhanced microwave absorption properties could be ascribed to the dielectric CuO, which can favorably increase the interface of the hetero-structure and the impedance matching with CoNi alloyed particles. It was shown that, when the molar ratio was 2.5![[thin space (1/6-em)]](https://www.rsc.org/images/entities/char_2009.gif) :
:![[thin space (1/6-em)]](https://www.rsc.org/images/entities/char_2009.gif) 1, the typical CoNi–CuO composite microspheres presented a promising microwave absorption performance, namely a maximum reflection loss (RL) of −25.1 dB at 13.2 GHz with a thickness of only 2.5 mm, while the effective microwave absorption bandwidth (RL < −10) could reach 3.4 GHz (from 10.0 to 13.4 GHz). As is demonstrated, this kind of newly fabricated CoNi–CuO composite can be regarded as a promising candidate for high-performance microwave absorption materials.
1, the typical CoNi–CuO composite microspheres presented a promising microwave absorption performance, namely a maximum reflection loss (RL) of −25.1 dB at 13.2 GHz with a thickness of only 2.5 mm, while the effective microwave absorption bandwidth (RL < −10) could reach 3.4 GHz (from 10.0 to 13.4 GHz). As is demonstrated, this kind of newly fabricated CoNi–CuO composite can be regarded as a promising candidate for high-performance microwave absorption materials.
1. Introduction
Considering the fact that modern electronic devices are getting smarter and smaller, and growing in number every day, the electromagnetic waves (EMW) resulting from the explosive usage of electromagnetic wave devices will have a detrimental impact on civil and military fields.1–6 More significantly, the increase of electromagnetic pollution can also affect the surrounding environment, as well as human health. In this regard, the exploration of high-performance microwave absorption/shielding materials is of practical significance.7
As has been reported, an efficient EMW absorbing material should simultaneously possess strong absorption intensity and broad-frequency bandwidth, and the primary function of EMW absorption is to attenuate radiation with a dielectric material that interacts directly with the electromagnetic field.1,8 Therefore, on one hand, to address this issue, the absorbing materials should be designed with favorable dielectricity. On the other hand, the secondary mechanism of EMW absorbing requires absorption of EMW due to the material's magnetic and/or electric dipoles interacting with the radiation, it thus suggests that absorbing materials need to be magnetical and/or conductive. As a result, the complex permittivity (εr = ε′ − jε′′) and permeability (μr = μ′ − jμ′′) would be crucial factors that influence the performance of the absorbing materials. According to the classical electromagnetic theory, “perfect” impedance matching could be gained if two parameters were equal.9 However, the matter of getting an impedance matching condition for unilateral dielectric loss or magnetic loss materials may not be realized.10 In combination of dielectric materials with magnetic materials together, it has been regarded as an effective method to synthesize excellent EMW absorption fillers, due to the synergistic effect on dissipation of the EMW energy.11 Accordingly, some highly effective absorbents, for instances, have been fabricated by compositing magnetic loss nanoparticles and dielectric loss components together, as like Fe3O4-nanotubes,12 Fe3O4–MnO2,13 and Fe2O3–SnO2 nanorods.14 Apparently, designing hetero-structured composites of dielectric–magnetic substances are beneficial for excellent microwave absorption capabilities.
Among many microwave absorbers, the metallic soft magnetic materials of cobalt and nickel have attracted great attention, due to their good conductivity, high saturation magnetization, high permeability at GHz frequency ranges, as well as low manufacturing cost.15–19 However, the permeability might have a rapid decrease in high frequency due to eddy current losses induced by the electromagnetic wave.20 There are two solutions to solve the problem. Firstly, using isolated metallic particles with a size less than the skin depth, such as CoNi alloy, is an effective way to solve the matter.21 For example, superfine magnetic alloy nanoparticles (CoNi) anchored in a spherical carbon monolith have been synthesized by solvothermal method and the minimum reflection loss is −50.2 dB at 7.7 GHz with a thickness of 2 mm.22 Secondly, another method is to cover the superfine magnetic CoNi alloy nanoparticles with a dielectric material coating to create a core–shell microstructure.
As an important p-type semiconductor, CuO, with narrow band gap (Eg = 1.2 eV), has attracted great attention due to its unique properties and widespread potential applications in optical switches, anode materials, field emitters, catalyst, gas sensors, photoelectrode and high-temperature microconductors.23–26 More recently, CuO has been researched as an efficient filler for the synthesis of microwave absorption materials.27,28 Liu et al. reported that the Ni nanocapsules covered with CuO–Cu2O-coating have been synthesized by the arc discharge method and the maximum reflection loss was −47.8 dB at 14.4 GHz.29 Besides, another novel hierarchical heterostructure, based on a Ni microsphere–CuO nano-rice core–shell composite, has also been synthesized by solvothermal method, and the optimal reflection loss was −62.2 dB at 13.8 GHz with the thickness of 1.7 mm.30 Evidently, taking into account of these reported results, it can be referred that CuO based composites be potential candidates with excellent microwave absorption capabilities.
Herein, in continuation of our research interest on designing efficient microwave absorption materials,7,22 a novel type of microwave absorbing composites that crystal CuO nanoflakes coated on CoNi alloy microspheres, forming core–shell CoNi–CuO hetero-structures, prepared by a facile solvothermal method is presented. The microwave absorption performance of CoNi alloy covered by varied amount of CuO was investigated in details. On the basis of structural characterization and microwave absorption testing, the relationship of composition tailoring and absorption performance was established; that is, a typical composite of CoNi/CuO-2 was demonstrated to be an optimized absorber with excellent performance among synthesized samples.
2. Experimental section
2.1 Materials
Cobalt(II) acetate tetrahydrate (C4H6CoO4·4H2O) and nickel(II) acetate tetrahydrate (NiC4H6O4·4H2O) were purchased from Aladdin. Copper(II) chloride dihydrate (CuCl2·2H2O) and ethylene glycol (CH2OH)2 was purchased from Sinopharm Chemical Reagent Co. Ltd. (Beijing, China). Sodium hydroxide (NaOH) was purchased from Kermel. Anhydrous ethanol (C2H6O) was purchased from Tian in Fuyu Fine Chemical Co. Ltd. (Tianjin, China).
2.2 Preparation of mono-disperse CoNi microspheres
The CoNi alloy microspheres were synthesized by a solvothermal method. In a typical protocol, C4H6CoO4·4H2O (0.05 g), NiC4H6O4·4H2O (0.20 g) and NaOH (0.125 g) were dissolved in ethylene glycol (40 mL). Then, resulting solution turned into a bluish green muddy suspension that indicated the formation of solid hydroxide (M(OH)n). After that, this suspension was further stirred for 10 min to acquire the homogeneity. Finally, the substance was transferred into a Teflon-lined stainless-steel autoclave which the temperature maintained at 200 °C for 12 h. After the products cooled to room temperature, the black precipitates were obtained. The black precipitates were washed with water and ethanol until to neutral and dried at 60 °C for 8 h in a vacuum.
2.3 Preparation of CuO nanoflakes-coated CoNi
Firstly, the as-prepared CoNi alloy microspheres (0.05 g) was exerted by ultrasonic to make it well disperse in distilled water (60 mL), then CuCl2·2H2O (0.18 g) was added into the suspension. Then, added the ammonia (2 mL) into the solution. After that, as-obtained solution was transferred into a Teflon-lined autoclave which temperature maintained at 150 °C for 15 h and then allowed to cool to room temperature. After being washed with water and ethanol and dried at 60 °C for 8 h in a vacuum, the product obtained was referred to as CoNi/CuO-1.
While the mass of CuCl2·2H2O are 0.36 g and 0.54 g, both products obtained can be named as CoNi/CuO-2 and CoNi/CuO-3, respectively. The manufacturing process of CoNi–CuO was illustrated in Scheme 1.
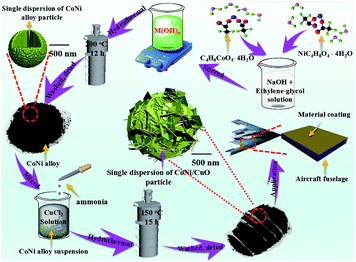 |
| | Scheme 1 Demonstration of fabrication process for CoNi–CuO composite material. | |
2.4 Characterization
The information of structure and morphology was obtained by scanning electron microscope (SEM, JEM JEOL 2100) with an energy dispersive spectroscopy (EDS) images, detailed microstructure information was revealed by high resolution transmission electron microcopy (HRTEM, Hitachi H9000NAR), respectively. The crystallographic phases of the as-synthesized composites were determined by the powder X-ray diffraction method, the XRD patterns were obtained with a Rigaku model D/max-2500 diffractometer using Cu Kα radiation (λ = 1.5406 Å) at 40 kV and 40 mA, scan rate (2θ) of 8° min−1 ranging from 10° to 70°. The composites were investigated by X-ray photoelectron spectroscopy (XPS) measurements, which were performed using the PHI 5000 Versa Probe systems. The magnetic hysteresis loop of the composites were measured by (VSM) at room temperature.
2.5 Electromagnetic measurements
The electromagnetic wave absorption properties of CoNi–CuO composites were calculated by using a vector network analyzer (Agilent N5222A) in the range of 2–18 GHz. Coaxial specimens for electromagnetic parameters were fabricated by mixing paraffin with 50 wt% and pressing them into a cylindrical-shaped (ψout of 7.0 mm, ψin of 3.04 mm). The reflection loss (RL) was calculated according to the following equations:30,34
Zin = Z0(μr/εr)1/2![[thin space (1/6-em)]](https://www.rsc.org/images/entities/char_2009.gif) tan tan![[thin space (1/6-em)]](https://www.rsc.org/images/entities/char_2009.gif) h[j(2πƒd)/c(μrεr)1/2]1 h[j(2πƒd)/c(μrεr)1/2]1 |
RL = 20![[thin space (1/6-em)]](https://www.rsc.org/images/entities/char_2009.gif) log|(Zin − Z0)/(Zin + Z0)|2 log|(Zin − Z0)/(Zin + Z0)|2 |
where Zin, Z0, d, ƒ and c stands for the input impedance of the absorber, the impedance of free space, the thickness of absorber, the frequency and the velocity of light, respectively. While μr (μr = μ′ − jμ′′) and εr (εr = ε′ − jε′′) are the relative permeability and permittivity, respectively.
3. Results and discussion
3.1 Characterization of CoNi–CuO hetero-structures
The scanning electron microscopy (SEM) images of CoNi alloy and core–shell-like CoNi–CuO composites with various magnifications are shown in Fig. 1a and b. As can be seen from Fig. 1(a1), the pure CoNi alloy monodisperse microspheres have relatively smooth surface with diameter about 1 μm. The elemental mapping of CoNi alloy is shown in Fig. 1c, it cab be observed that the CoNi alloy consist of only element Co and element Ni, it means that no detectable impurity in the pure CoNi alloy system. Meanwhile, the sample is an alloy phase rather than a random mixture of Co and Ni nanoparticles, which was confirmed by extremely homogeneous element distribution in the CoNi sample.
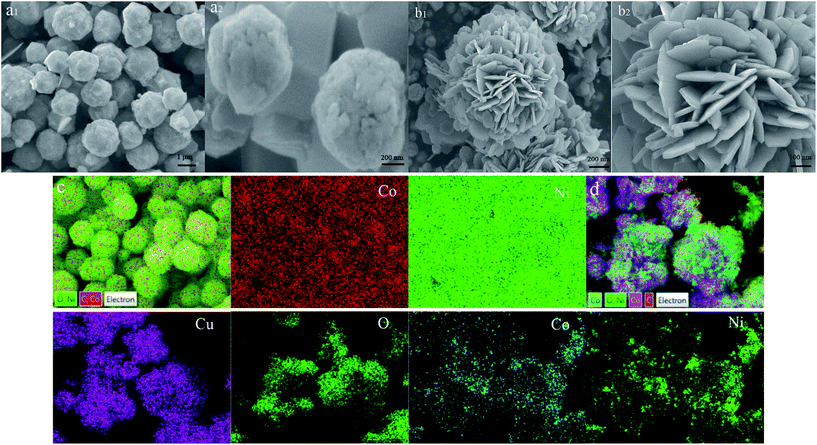 |
| | Fig. 1 SEM images of CoNi alloy (a1, a2), CoNi–CuO (b1, b2) composites, and the EDS elemental mapping images of CoNi alloy (c) and CoNi–CuO (d) composites, respectively. | |
Compared with the pristine CoNi alloy microspheres, the products of CuO coated CoNi hetero-structures are shown in Fig. 1(b1). It is clearly observable that the surface of compositions was extremely rough due to existing of CuO nanoflakes, and the hetero-structures with the average diameters of 1.2 μm. A detailed description of composites was given by the high-magnified SEM image in Fig. 1(b2). It can be seen that the shells are formed to petals-like structure by the assembly of numerous flake CuO nanostructures. The rough surface might be beneficial for microwave absorption due to the structural defects. The defect site generates an additional energy state due to the uneven and terraced fields near the Fermi level,17 possibly which can reduce the electron transition energy. The elemental mapping of CoNi–CuO hetero-structures is shown in Fig. 1d. Obviously, the core–shell-like character of CoNi–CuO is confirmed by distribution of element, namely, Co element and Ni element were scattered in the core region, while the Cu element and O element implied larger areas compared with Co and Ni.
In order to obtain more information on the microstructure of the CoNi–CuO hetero-structures, TEM and HR-TEM images of CoNi–CuO particles were acquired and shown in Fig. 2. The images in Fig. 2a clearly showed the core–shell-like CoNi–CuO structures. The globe-shaped composites existed with diameters of nearly 1.2 μm and the particle size was uniform without distinct aggregation. Furthermore, as depicted in Fig. 2b, the black core area represents CoNi alloy while semitransparent substance means CuO nanoflakes, thus confirmed the core–shell-like structure of the as prepared composite. Besides, the inset HRTEM image (c) of the CuO nanoflakes indicated that CuO substance was polycrystalline because of the lattice spacing was 0.23 nm, corresponding to the (111) lattice spacing of CuO. Single-sheet CuO flake was shown in another inset image (d). According to SEM and TEM results, it can be shown that CuO nanoflakes were distributed on the surface of CoNi alloy particle, and the core–shell-like composites of CoNi–CuO have been successfully obtained via this facile solvothermal process.
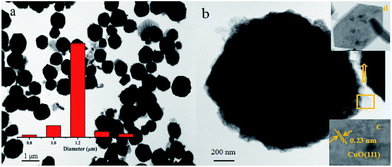 |
| | Fig. 2 TEM (a) and HRTEM (b) images of CoNi–CuO (the inset ones (c, d) for the corresponding SAED result). | |
Distinct morphologies of as-prepared products obtained in various molar ratios of the CuCl2·2H2O to CoNi alloy microspheres in the precursor solution were shown in Fig. 3. Compared with the pure CoNi particles, the surface of the CoNi–CuO got coarser, which is owing to the successful coating of the CuO nanoflakes. Furthermore, the shape and coverage density of CuO materials could be controlled by changing the amount of precursor (Cu2+). As can be seen from parts of Fig. 3(a1 and a2), numerous CuO nanoflakes were assembled on the surface of the CoNi alloy particles at the mass ratio of the CuCl2·2H2O to CoNi alloy composites in the precursor solution is 1.25![[thin space (1/6-em)]](https://www.rsc.org/images/entities/char_2009.gif) :
:![[thin space (1/6-em)]](https://www.rsc.org/images/entities/char_2009.gif) 1 (CoNi/CuO-1). In addition, both the size and thickness of the CuO shells were small and thin, because of low concentration of precursor (Cu2+). In this way, the interface space disappeared significantly, resulted from the high density accumulation of CuO sheets, which was harmful to microwave absorption. When the mass ratio was increased to 2.5
1 (CoNi/CuO-1). In addition, both the size and thickness of the CuO shells were small and thin, because of low concentration of precursor (Cu2+). In this way, the interface space disappeared significantly, resulted from the high density accumulation of CuO sheets, which was harmful to microwave absorption. When the mass ratio was increased to 2.5![[thin space (1/6-em)]](https://www.rsc.org/images/entities/char_2009.gif) :
:![[thin space (1/6-em)]](https://www.rsc.org/images/entities/char_2009.gif) 1 (CONi/CuO-2), as shown by Fig. 3(b1 and b2), it can be clearly found that larger and thicker CuO crystal tablets were coated on CoNi microspheres, leading to the formation of prominent interfaces combined with CoNi alloy particles. These interfaces were beneficial for microwave absorption because amounts of reactions occurred on them, such as microwave scattering, reflecting and interfacial polarization. In a certain range, this heterogeneous interface would be better with increasing CuO content, while the loss of electromagnetic waves would have been strengthened. However, when rising the mass ratio to 5
1 (CONi/CuO-2), as shown by Fig. 3(b1 and b2), it can be clearly found that larger and thicker CuO crystal tablets were coated on CoNi microspheres, leading to the formation of prominent interfaces combined with CoNi alloy particles. These interfaces were beneficial for microwave absorption because amounts of reactions occurred on them, such as microwave scattering, reflecting and interfacial polarization. In a certain range, this heterogeneous interface would be better with increasing CuO content, while the loss of electromagnetic waves would have been strengthened. However, when rising the mass ratio to 5![[thin space (1/6-em)]](https://www.rsc.org/images/entities/char_2009.gif) :
:![[thin space (1/6-em)]](https://www.rsc.org/images/entities/char_2009.gif) 1 (CoNi/CuO-3), coacervated CuO nanoflakes aggregated on CoNi alloy microspheres (see Fig. 3(c1 and c2)). Under this condition, the surface of core–shell-like hetero-structures became seriously densely structures, which might be unfavorable for the formation of the electromagnetic wave track, resulting in hampering the diffusion of electromagnetic waves on the heterogeneous interface and inside the electromagnetic materials.4,16
1 (CoNi/CuO-3), coacervated CuO nanoflakes aggregated on CoNi alloy microspheres (see Fig. 3(c1 and c2)). Under this condition, the surface of core–shell-like hetero-structures became seriously densely structures, which might be unfavorable for the formation of the electromagnetic wave track, resulting in hampering the diffusion of electromagnetic waves on the heterogeneous interface and inside the electromagnetic materials.4,16
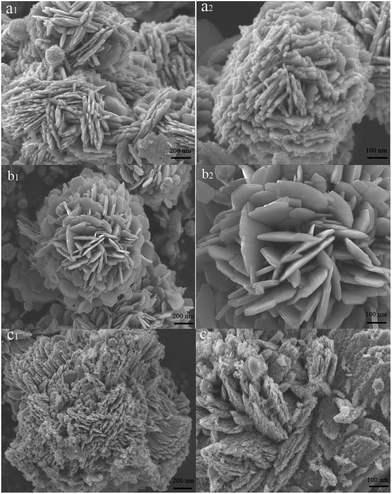 |
| | Fig. 3 SEM images of hierarchical CoNi–CuO core–shell heterostructures with different mass ratios: (a1, a2) CoNi/CuO-1; (b1, b2) CoNi/CuO-2; (c1, c2) CoNi/CuO-3. | |
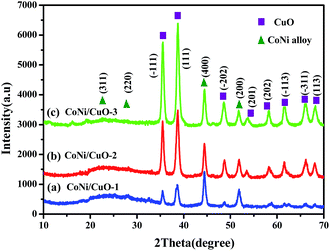
Subsequently, XRD patterns of the three samples with different amount of CuO nanoflakes-coated CoNi alloy microspheres are shown in Fig. 4. The powder was ball milled in room temperature so as to eliminate the possibility of oxide formation, if any. The phase purity analysis, material identification and XRD peak indexing was prepared, corresponding to Joint Committee on Powder Diffraction Standards (JCPDS) data files. Clearly, three samples have high crystallinity, which were revealed by SEM and TEM images. This is also supported by the appearance of XRD patterns that intense and sharp peaks are distinctly observable. All peaks could be well matched with simulated patterns, the peaks centered at 35.4°, 37.6°, 48.3°, 53.1°, 58.6°, 61.3°, 66.4° and 68.0° belong to the (−111), (111), (−202), (201), (202), (−113), (−311) and (113) planes of monoclinic CuO respectively, while the characteristic peaks at 22.3°, 27.6°, 44.4°, 51.8° can be assigned to (311), (220), (400), (200) planes of cubic CoNi alloy. Evidently, the CoNi alloy has a well crystallinity, which is supported by the peaks with identical locations and intensities, indicating that a type of core–shell-like structures with preformed CoNi alloy as cores had been successfully achieved. By contrast, however, the (−111) and (111) peaks were sharper and more intense than other peaks in CuO spectrum; it possibly indicates that CuO nano-particles growed preferentially along those directions. It should also be mentioned that the peaks of CuO were getting highly intense with increasing CuO content, meaning that higher usage of its starting precursor has led to the appearance of larger particle size. Totally speaking, these results are in line with the observation from SEM imagines (in Fig. 3), whereas the monoclinic CuO species in CONi/CuO-3 presented aggregation in a small degree.
 |
| | Fig. 4 XRD patterns of CoNi alloy with varied CuO loadings. | |
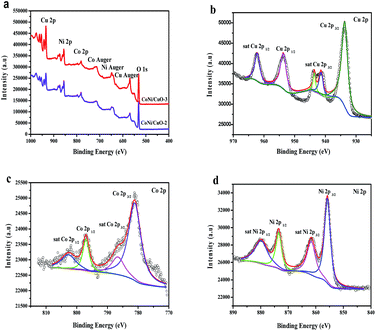
To gain more insight, the survey spectrum of as-prepared CoNi–CuO composites was further investigated by XPS, wherein the attributions of all the peaks had been marked and shown in Fig. 5a. It was clearly found that all the peaks can be ascribed to the elements of Cu, Ni, Co, Co auger, Ni auger, Cu auger and O, indicating that it was entirely in line with the composites in experiment. As shown in Fig. 5b–d, the high-resolution Cu 2p, Co 2p and Ni 2p spectra were matched by the Gaussian fitting method. For Cu 2p XPS spectrum (Fig. 5b), the phase formation could be surely confirmed to be CuO, instead of Cu2O phase in the hetero-structures, which is provided by strong satellite shake-up peaks around 963.7 eV and an overlapping series around 943.3 eV. For Co 2p XPS spectrum (Fig. 5c), the main peak locates at 781.3 eV, while the second one situates at 786.2 eV, which can be corresponded to the Co and Co2+, respectively. The results implied the possible coexistence of metallic Co and Co2+ in the composites. Similarly, metallic Ni and Ni2+ may coexist in composites because of the binding energy located at 855.7 eV and 862.4 eV (Fig. 5d).
 |
| | Fig. 5 XPS spectra: wide scan of CoNi–CuO heterostructures (a); Cu 2p spectrum (b), Co 2p spectrum (c), Ni 2p spectrum (d) of CoNi–CuO composites. | |
3.2 Magnetic properties
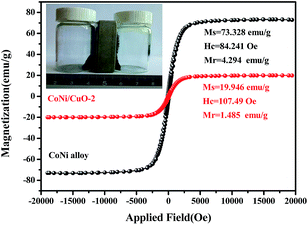
Apparently, the above characterization results revealed that the CoNi–CuO core–shell-like hetero-structures had been successfully prepared via a facile hydrothermal method. The magnetic properties of CoNi alloy and CoNi/CuO-2 was measured by the vibrating sample magnetometer (VSM) at room temperature. As shown in Fig. 6, the saturation magnetization (MS), coercivity (HC), and remnant magnetization (Mr) are 73.328 emu g−1, 84.241 Oe, and 4.293 emu g−1 for the CoNi alloy particles respectively, while 19.964 emu g−1, 107.49 Oe, and 1.485 emu g−1 for the CoNi/CuO-2 composite. By contrast, the main reason for low saturation magnetization value of CoNi–CuO is possibly due to the presence of dielectric CuO coated onto the surface of CoNi microspheres, which led to the reduction of corresponding data. Moreover, the defects in hetero-structured surface might partly play a role in decreasing the saturation magnetization. However, it should be pointed out that as-fabricated CoNi–CuO composite possesses relatively higher coercivity. It is thus proposed that the resultant CoNi–CuO composites may possess enhanced microwave absorption properties, because of a higher magneto-crystalline anisotropy energy induced by larger coercivity value.31,32
 |
| | Fig. 6 Hysteresis loops of CoNi alloy and CoNi/CuO-2. | |
3.3 Electromagnetic wave absorption properties
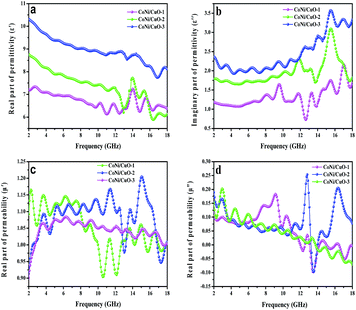
The electromagnetic properties of the CoNi/CuO-1, CoNi/CuO-2 and CoNi/CuO-3 samples were characterized in the frequency range from 2 to 18 GHz in this study. The frequency dependence complex permittivity and permeability for three composites are shown in Fig. 7. It was well known that permeability (μ′) was associated with energy dissipation and permittivity (ε′) was vitally correlated with the amount of polarization happening in the material, while the imaginary permittivity (ε′′) and imaginary permeability (μ′′) were connected with the energy dissipation and magnetic loss, respectively.33 It is worthily noting that the all samples ε′ values were higher than permeability values including real and imaginary part. According to classical electromagnetic theory, “perfect” impedance matching required that the relation between ε′ and permeability tends to be close, which could achieve zero-reflection at the surface of the materials.34 Therefore, the impedance match was not reaching the best point for microwave absorption, resulting from higher permittivity of the absorber, which would be unfavorable for the impedance match. From Fig. 1a, the ε′ of all compositions has a decreasing tendency from 2 to 13 GHz, while the CoNi/CuO-2 and CoNi/CuO-3 show fluctuation from 13 to 16 GHz. In detail, the ε′ of CoNi/CuO-2 decreased from 8.7 to 5.8, for CoNi/CuO-1 and CoNi/CuO-3, the permittivity decreased from 7.4 to 6.3 and 10.4 to 8.0, respectively. This might be due to the lag of the induced charges to follow the reversing external field and then caused a reduction in the electronic oscillations.35 The values of the real permittivity highly result from space charge polarization, which because of the heterogeneity of the material. More space charge and multi-interface accumulated at the interface due to presence of dielectric CuO coating on the surface of CoNi microspheres, the formation of more space charge and multi-interface might possibly contribute to higher microwave absorption in the composites. It could obtain the similar regular pattern that the ε′′ of all samples increased from 2–13 GHz with the increase of the CuO loading from Fig. 7b, while multi-peaks existed from 13–18 GHz on the ε′′ curve. The larger ε′′ value was induced by higher electron conductivity according to free electron theory.36 However, the accurate explanation of the special nonlinear resonant characteristics of these multi-peaks was still underway.37
 |
| | Fig. 7 Real (a) and imaginary (b) parts of complex permittivity of as-prepared CoNi–CuO composites; real (c) and imaginary (d) parts of complex permeability of as-prepared CoNi–CuO composites. | |
For CoNi/CuO-2, the resonant frequencies of ε′′ in current band range were at 3.6, 9.8 and 15.4 GHz, respectively. According to those previous reports,38–40 the dielectric resonances at 3.6 GHz should be related with CoNi particles. However, the hetero-junction capacitance generated at the interface of CuO nanoflakes and CoNi alloy microspheres could induce the other two resonant peaks (9.8 and 15.4 GHz), which were similar to previous reports by Shi,38 Liu39 and Lv.40 The relative complex permeability images are shown in Fig. 1c and d, the μ′ and μ′′ curves show fluctuation between 0.90 and 1.20, −0.1 and 0.25 from 2 to 18 GHz, respectively. This phenomenon corresponded with previous publications that might be due to the existence of Co.41 Obviously, the values of CoNi/CuO-2 were the highest among the three samples, meaning the CoNi/CuO-2 possessed the highest magnetic loss. According to the complex permittivity and permeability, it could be concluded that the enhanced microwave absorption properties was possibly associated with high dielectric loss and magnetic loss.
In general, natural resonance, hysteresis loss and the effect of eddy currents were the main reasons for magnetic loss in the microwave frequency range under a weak electromagnetic field.42 However, the hysteresis loss in the weak field was negligible. The eddy current loss could be calculated by the following equation:43
| | |
μ′′ = 2πμ0(μ′)2σd2ƒ/3
| (3) |
where
μ0 means the permeability of vacuum,
d represents the thickness, and
σ represents the electrical conductivity of the composite. If the eddy current effect dominates magnetic loss mechanisms, the values of
C0 =
μ′′(
μ′)
−2ƒ
−1 should be constant when the frequency changes. From
Fig. 8, the
C0 values of all samples drastically decrease at the lower frequency range of 2–5 GHz and it is mainly caused by the natural resonance.
44 Natural resonance could be calculated by the following equation:
45where
γ means the gyromagnetic ratio,
Ha represents the anisotropy energy, and |
K| represents the anisotropy coefficient. Commonly, the resonance frequency depends on the anisotropy field, which is closely related to the coercivity value of the materials.
46 Anisotropy would increase to optimal state with increasing CuO content, which would be greatly helpful to improve electromagnetic waves absorption properties. From 5–18 GHz, the values of
C0 =
μ′′(
μ′)
−2ƒ
−1 are nearly constant and this is called the skin-effect criterion,
47 suggesting that the eddy current loss mainly affected the dissipation of microwave energy.
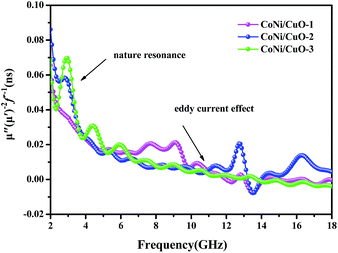 |
| | Fig. 8 The value of μ′′(μ′)−2ƒ−1 of as-made CoNi–CuO composites percentage as a function of frequency. | |
The dielectric loss and magnetic loss were two key factors to electromagnetic waves absorption.15,42 In order to explore which one contributes largely in microwave absorption, the magnetic loss tangent (tan![[thin space (1/6-em)]](https://www.rsc.org/images/entities/char_2009.gif) δm = μ′′/μ′) and dielectric loss tangent (tan
δm = μ′′/μ′) and dielectric loss tangent (tan![[thin space (1/6-em)]](https://www.rsc.org/images/entities/char_2009.gif) δe = ε′′/ε′) were calculated and the results are shown in Fig. 9. Obviously, an increased tendency of dielectric and a decreasing tendency of magnetic loss were observed as the frequency increasing, respectively. Moreover, significant dielectric loss at the high-frequency range and strong magnetic loss at the low-frequency range illustrated that the three samples possessed EMW absorption properties due to complementarities between them.28,37 In addition, the values of dielectric loss tangent were higher than magnetic loss tangent; it showed that dielectric loss had played a key role in the microwave absorption properties. In general, the space-charge polarization and the interfacial polarization were two mainly reasons for dielectric loss of the EMW energy at microwavefrequencies.48 For these particular ‘core–shell-like’ microstructured samples, the formation of more space charge and multi-interface at the interface due to presence of dielectric CuO coated on the surface of CoNi microspheres.10,36 Therefore, the dielectric loss happened owing to a large amount of space charge polarization. Besides, the well dispersion of CuO in the CoNi alloy could introduce more additional interfaces and consequently interfacial polarization, leading to the increase of the interfacial polarization and dielectric loss.49 Except the above reasons, CuO nanoflakes of the composites played the isotropic quasi-antennas role in favoring the penetration of microwave waves, which could generate continuous micro-networks and thus a large-scale vibrating micro-current would be induced into a dissipative current and consumed in discontinuous networks.12,29 Furthermore, from Fig. 9b, the dielectric loss values of CoNi/CuO-2 is highest among three samples, clearly indicating that it has excellent capability of microwave absorption in contrast to other two samples with varied CuO loadings.
δe = ε′′/ε′) were calculated and the results are shown in Fig. 9. Obviously, an increased tendency of dielectric and a decreasing tendency of magnetic loss were observed as the frequency increasing, respectively. Moreover, significant dielectric loss at the high-frequency range and strong magnetic loss at the low-frequency range illustrated that the three samples possessed EMW absorption properties due to complementarities between them.28,37 In addition, the values of dielectric loss tangent were higher than magnetic loss tangent; it showed that dielectric loss had played a key role in the microwave absorption properties. In general, the space-charge polarization and the interfacial polarization were two mainly reasons for dielectric loss of the EMW energy at microwavefrequencies.48 For these particular ‘core–shell-like’ microstructured samples, the formation of more space charge and multi-interface at the interface due to presence of dielectric CuO coated on the surface of CoNi microspheres.10,36 Therefore, the dielectric loss happened owing to a large amount of space charge polarization. Besides, the well dispersion of CuO in the CoNi alloy could introduce more additional interfaces and consequently interfacial polarization, leading to the increase of the interfacial polarization and dielectric loss.49 Except the above reasons, CuO nanoflakes of the composites played the isotropic quasi-antennas role in favoring the penetration of microwave waves, which could generate continuous micro-networks and thus a large-scale vibrating micro-current would be induced into a dissipative current and consumed in discontinuous networks.12,29 Furthermore, from Fig. 9b, the dielectric loss values of CoNi/CuO-2 is highest among three samples, clearly indicating that it has excellent capability of microwave absorption in contrast to other two samples with varied CuO loadings.
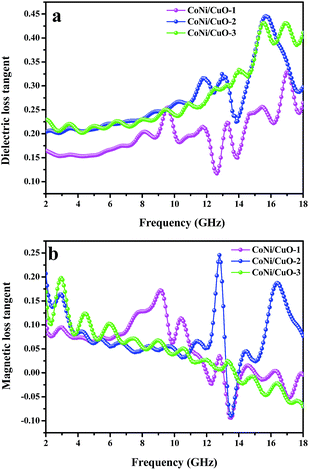 |
| | Fig. 9 The dielectric loss tangent (a) and magnetic loss tangent (b) of CoNi–CuO–paraffin wax samples versus frequency. | |
Now, it can be assured that the composite was an electromagnetic wave absorber of dielectric loss type. We had already discussed the dielectric loss of this type of material on the basis of the space charge polarization and interfacial polarization. However, considering the dipole polarization, that happens among adjacent metal interface of nanoparticles, it might lead to the increase of the dielectric loss.50 Therefore, the Debye theory was used to better understand the mechanisms of dielectric loss of the electromagnetic absorber by the following equation:51
| | |
εr = ε′ + iε′′ = ε∞ + (εs − εo)/(1 + iωτo)
| (6) |
where
ε∞ represents the relative dielectric permittivity at high-frequency limit,
εs means the static permittivity,
ω is frequency,
τ is relaxation time; respectively. According to the above
eqn (6),
ε′ and
ε′′ could be deduced as given below:
| | |
ε′ = ε∞+ (εs − εo)/[1 + (ωτo)2]
| (7) |
| | |
ε′′ = ωτo(εs − εo)/[1 + (ωτo)2]
| (8) |
According to eqn (7) and (8), the relationship between ε′ and ε′′ could be expressed as:
| | |
[ε′ − (εs + ε∞)/2]2 + (ε′′)2 = [(εs − ε∞)/2]2
| (9) |
| | |
ε′ = ε′′/(2πƒτ) + ε∞
| (10) |
Based on eqn (9), we can see that a plot of ε′ to ε′′ should be a single semicircle, which denotes a Debye relaxation process called a Cole–Cole plot.52 From Fig. 10, the relaxation process existed in three samples, which was supported by the semicircles presented in all samples, whereas the number of semicircles was remarkably different. A large semicircle and eight small semicircles were found in CoNi/CuO-2(Fig. 10), indicating that there were nine dielectric relaxation processes in this hetero-structured composite. As is known, this kind of composite was constituted by CoNi alloy and CuO, even though CoNi alloyed nanoparticles possess high electrical conductivity and another phase was of semiconductor material. When the electromagnetic wave reached the interfacial of the CoNi alloy particles and CuO, dielectric loss relaxation would happen, because of the significant skin effect induced by the enormous difference conductivity between the two compositions of hetero-structured composite. Within this context, the interfacial polarization would be the main reason for dielectric loss. At the same time, space charge polarization and a large amount of dipole polarization could devote to the dielectric loss. Furthermore, the number of semicircles also meant the capability of electromagnetic wave absorption properties; there are three semicircles for CoNi/CuO-1 and six semicircles for CoNi/CuO-3, respectively, it revealed that both samples possessed relatively lower electromagnetic wave absorption properties than that of CoNi/CuO-2. That is, the CoNi/CuO-2 has the highest electromagnetic wave absorption properties, which can be mainly associated with its optimized component and hetero-structures.
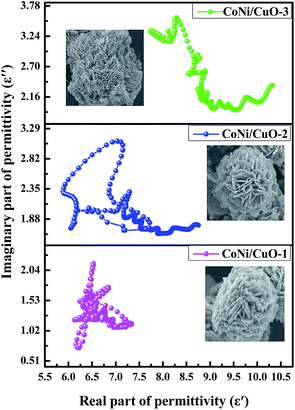 |
| | Fig. 10 Cole–Cole plots of CoNi/CuO-1, CoNi/CuO-2 and CoNi/CuO-3. | |
As is reported, microwave attenuation is an important factor to determine the microwave absorption abilities of materials in the interior of microwave absorber, which could be described by the attenuation constant (α), as defined by the following equation:22
| | |
α = (√2πƒ/c) × √[(μ′′ε′′ − μ′ε′) + √[(μ′′ε′′ − μ′ε′)2 + (μ′′ε′′ + μ′ε′)2]]
| (11) |
where
c is the velocity of electromagnetic waves in free space and ƒ represents the frequency of the electromagnetic waves. The frequency dependence of
α for the three samples is displayed in
Fig. 11a. Obviously, CoNi/CuO-2 has the highest attenuation constant among three compositions, indicating it possessed the strongest attenuation abilities. Therefore, CoNi/CuO-2 exhibited the strongest electromagnetic wave absorption properties, which is also confirmed by the impedance matching. It was generally believed that perfect impedance matching could be achieved when the value was 1. From
Fig. 11b, the value of CoNi/CuO-2 reached nearly 0.92 at frequency of 13.2 GHz, this showed that it has the best impedance match on this point.
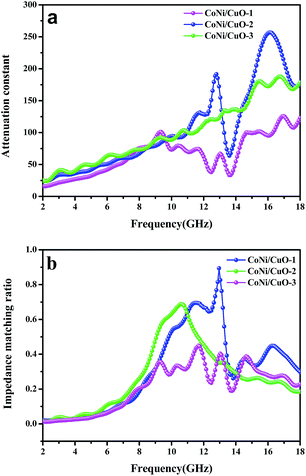 |
| | Fig. 11 Attenuation constant of as-made CoNi–CuO composites (a); the modulus of normalized input impedance of the products at a thickness of 2.5 mm (b). | |
To further investigate the electromagnetic wave absorption performance of the as-synthesized CoNi–CuO composites, the reflection loss (RL) values are calculated from the relative complex permittivity (εr) and permeability (μr) at a given frequency (2–18 GHz) and different absorber thickness, by means of the following equations:30,34
| |
Zin = Z0(μr/εr)1/2![[thin space (1/6-em)]](https://www.rsc.org/images/entities/char_2009.gif) tan tan![[thin space (1/6-em)]](https://www.rsc.org/images/entities/char_2009.gif) h[j(2πƒd)/c(μrεr)1/2] h[j(2πƒd)/c(μrεr)1/2]
| (1) |
| |
RL = 20![[thin space (1/6-em)]](https://www.rsc.org/images/entities/char_2009.gif) log|(Zin − Z0)/(Zin + Z0)| log|(Zin − Z0)/(Zin + Z0)|
| (2) |
where
Zin is the input characteristic impedance,
Z0 is the impedance of free space,
c is the velocity of light,
f is the frequency and d is the thickness of the composites.
Fig. 12 shows the reflection loss (RL) of the CoNi–CuO composites prepared with thickness varying from 1 to 5 mm in the frequency range of 2–18 GHz. It can be found that, once again, the CoNi/CuO-2 composite possessed the best microwave absorption performance among the three samples. As shown in
Fig. 12b, the minimal reflection loss is −25.1 dB at 13.2 GHz, and the effective absorption (below −10 dB) bandwidth is 3.4 GHz (10.0–13.4 GHz) with a thickness of 2.5 mm. In comparison, the minimum RL of CoNi/CuO-1 is −19.0 dB at 16.3 GHz at an absorber thickness of 2.5 mm, while the minimum RL of CoNi/CuO-3 is −18.1 dB at 17.9 GHz at an absorber thickness of 2.5 mm (see
Fig. 12a and c). For comparison,
Table 1 exhibits the microwave absorption properties of typical Ni-based composites and some reported core–shell samples in recent literatures.
53–58 It can be seen that CoNi–CuO composites possess stronger EM absorption capability and a thinner absorber thickness and broader absorption bandwidth. It means that this kind of newly fabricated CoNi–CuO composites can be regarded as promising candidates for high-performance microwave absorption materials.
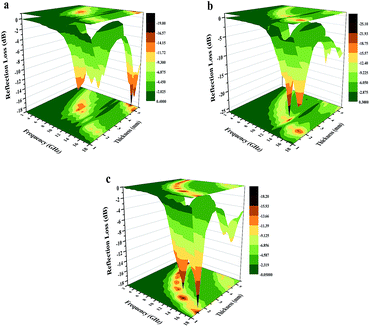 |
| | Fig. 12 Three-dimension images of calculated RL values of (a) CoNi/CuO-1, (b) CoNi/CuO-2 and (c) CoNi/CuO-3 composites. | |
Table 1 Electromagnetic absorption properties of some reported samples and CoNi–CuO composites
| Samples |
Minimum RL value (dB) |
Minimum RL ƒm (GHz) |
Bandwidth (RL < 10 dB) |
Optimum thickness (mm) |
Ref. |
| Ni nanowires |
−8.5 |
10 |
— |
3.0 |
53 |
| Flowers-like Ni |
−17 |
13 |
11.5–14 |
3.0 |
54 |
| Ni chains |
−25.29 |
9.6 |
8.3–10.4 |
2.0 |
55 |
| Ni/graphene |
−13 |
11 |
9.6–12.2 |
2.0 |
56 |
| Ni/polypyrrole |
−15.2 |
13.0 |
11–15.4 |
2.0 |
57 |
| Fe3O4/TiO2 |
−20.6 |
17.28 |
16–18 |
5.0 |
58 |
| CoNi–CuO |
−25.1 |
13.2 |
10–13.4 |
2.5 |
This work |
On the basis of the above mentioned analysis, the massive EMW of CoNi–CuO could be understood from several proposed mechanisms, which is shown in Scheme 2. The electromagnetic wave absorption properties originated from the excellent loss of CoNi–CuO and partially from the polarization of two components. A potential mechanism could be explained as follows: as electromagnetic waves striked the surface of CoNi, some EM waves were immediately reflected because of large amount free electrons on the surface of the highly conductive CoNi alloy.59,60 Subsequently, the remaining waves were dissipated in the form of heat resulting from its interaction with the high electron density of CoNi, by which could induce currents that contribute to ohmic losses. Simultaneously, the local dipoles on CuO may be created when it was subjected to an alternating electromagnetic field, considering the fact that oxygen, being highly electronegative, can induce this kind of dipole polarization. As a result, the surface of semiconductor CuO covered large amount of electronic, favorably enhanced the interfacial polarization, then constituted with CoNi alloy to be capacitor-like structure. At last, the electromagnetic waves could also be reflected back and forth between the two surfaces until completely being absorbed in the hetero-structure. However, the Debye relaxation process cannot be ignored in the process, it would have played an important part in EMW absorption, considering it can surely enhance the attenuation of electromagnetic waves.
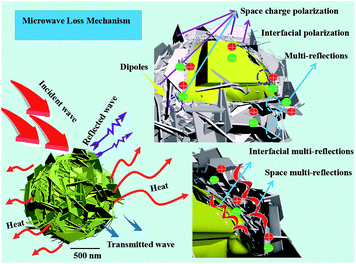 |
| | Scheme 2 Plausible mechanism for the microwave absorption over fabricated CoNi–CuO composites. | |
4. Conclusions
In summary, a novel kind of microwave absorbing material, namely CoNi–CuO hetero-structures, has been successfully prepared via a facile solvothermal method. The CoNi alloy microspheres were well coated by CuO crystalline phases. It was demonstrated that the introduced semiconductor CuO coatings played crucial role toward the enhancement of the absorbing material. In contrast to other two samples, the one of CoNi/CuO-2 possessed excellent electromagnetic wave absorption properties, for which both effective absorption bandwidth (RL < −10 dB) of 10.0–13.4 GHz and a minimum RL values of −25.1 dB at 13.2 GHz with a matching thickness of 2.5 mm were gained. As compared to previous works, this work provides an effective method to improve the electromagnetic properties of alloy and might shed new light on the design of high-performance microwave absorption composites.
Conflicts of interest
The authors declare no financial interest.
Acknowledgements
Financial support from the National Natural Science Foundation of China (21676039) and the Opening Foundation of State Key Laboratory of Inorganic Synthesis and Preparative Chemistry of Jilin University (2016-04) are kindly acknowledged.
References
- F. Shahzad, M. Alhabeb, C. B. Hatter, B. Anasori, S. M. Hong, C. M. Koo and Y. Gogotsi, Science, 2016, 353, 1137–1140 CrossRef CAS PubMed.
- W. L. Jun, J. P. Guang, B. Ji, X. H. Liang, Y. Cheng, B. Quan and Y. W. Du, Dalton Trans., 2017, 46, 3700 RSC.
- Y. Zhang, Y. Huang, T. F. Zhang, H. C. Chang, P. S. Xiao, H. H. Chen, Z. Y. Huang and Y. S. Chen, Adv. Mater., 2015, 27, 2049–2053 CrossRef CAS PubMed.
- D. X. Yan, H. Pang, B. Li, R. Vajtai, L. Xu, P. G. Ren, J. H. Wang and Z. M. Li, Adv. Funct. Mater., 2015, 25, 559–566 CrossRef CAS.
- N. Yousefi, X. Y. Sun, X. Y. Lin, X. Shen, J. J. Jia, B. Zhang, B. Z. Tang, M. S. Chan and J. K. Kim, Adv. Mater., 2014, 26, 5480–5487 CrossRef CAS PubMed.
- Z. P. Chen, C. Xu, C. Q. Ma, W. C. Ren and H. M. Cheng, Adv. Mater., 2013, 25, 1296–1300 CrossRef CAS PubMed.
- J. L. Lv, S. R. Zhai, C. Gao, N. Zhou, Q. D. An and B. Zhai, Chem. Eng. J., 2016, 289, 261 CrossRef CAS.
- Y. Zhang, Y. Huang, H. Chen, Z. Huang, Y. Yang, P. Xiao, Y. Zhou and Y. Cheng, Carbon, 2016, 105, 438 CrossRef CAS.
- A. Aijaz, J. Masa, C. Rösler, W. Xia, P. Weide, A. J. R. Botz, R. A. Fischer, W. Schuhmann and M. Muhler, Angew. Chem., Int. Ed., 2016, 55, 4087 CrossRef CAS PubMed.
- N. Li, C. W. Hu and M. H. Cao, Phys. Chem. Chem. Phys., 2013, 15, 7685 RSC.
- K. Singh, A. Ohlan, V. H. Pham, R. Balasubramaniyan, S. Varshney, J. Jang, S. H. Hur, W. M. Choi, M. Kumar, S. K. Dhawan, B. S. Kong and J. S. Chung, Nanoscale, 2013, 5, 2411–2420 RSC.
- G. Tong, Q. Hu, W. Wu, W. Li, H. Qian and Y. Liang, J. Mater. Chem., 2012, 22, 17494–17504 RSC.
- C. Gong, J. Z. X. Zhang, L. Yu, P. Zhang, Z. Wu and Z. Zhang, J. Phys. Chem. C, 2010, 114, 10101–10107 CAS.
- B. Zhao, B. Fan, G. Shao, B. Wang, X. Pian, W. Li and R. Zhang, Appl. Surf. Sci., 2014, 307, 293–300 CrossRef CAS.
- T. Liu, P. Zhou, J. Xie and L. Deng, J. Appl. Phys., 2012, 111, 093905 CrossRef.
- C. Wang, X. Han, P. Xu, J. Wang, Y. Du, X. Wang, W. Qin and T. Zhang, J. Phys. Chem. C, 2010, 114, 3196–3203 CAS.
- X. Zhang, X. Dong, H. Huang, Y. Liu, W. Wang, X. Zhu, B. Lv, J. Lei and C. Lee, Appl. Phys. Lett., 2006, 89, 053115 CrossRef.
- Q. Liu, B. Cao, C. Feng, W. Zhang, S. Zhu and D. Zhang, Compos. Sci. Technol., 2012, 72, 1632 CrossRef CAS.
- G. Li, L. Wang, W. Li, R. Ding and Y. Xu, Phys. Chem. Chem. Phys., 2014, 16, 12385 RSC.
- F. Zhang, A. Zhu, Y. Luo, Y. Tian, J. Yang and Y. Qin, J. Phys. Chem. C, 2010, 114, 19214–19219 CAS.
- X. Liu, C. Feng, S. W. Or, Y. Sun, C. Jin, W. Li and Y. Lv, RSC Adv., 2013, 3, 14590–14594 RSC.
- N. Zhou, Q. D. An, W. Zheng, Z. Y. Xiao and S. R. Zhai, RSC Adv., 2016, 6, 98128 RSC.
- X. Zhang, G. Ji, W. Liu, X. Zhang, Q. Gao, Y. Li and Y. Du, J. Mater. Chem. C, 2016, 4, 1860 RSC.
- G. Z. Wang, X. G. Peng, L. Yu, G. P. Wan, S. W. Lin and Y. Qin, J. Mater. Chem. A., 2015, 3, 2734–2740 CAS.
- Q. L. Liu, D. Zhang and T. X. Fan, Appl. Phys. Lett., 2008, 93, 3110 Search PubMed.
- Y. J. Chen, G. Xiao, T. S. Wang, Q. Y. Ouyang, L. H. Qi, Y. Ma, P. Cao, C. L. Zhu, M. S. Cao and H. B. Jin, J. Phys. Chem. C, 2011, 115, 13603–13608 CAS.
- R. F. Zhuo, L. Qiao, H. T. Feng, J. T. Chen, D. Yan, Z. G. Wu and P. X. Yan, J. Appl. Phys., 2008, 104, 094101 CrossRef.
- Y. Li, T. Wu, K. Jiang, G. Tong, K. Jin, N. Qian, L. Zhao and T. Lv, J. Mater. Chem. C, 2016, 4, 7119 RSC.
- X. Liu, G. Zhou, S. W. Or and Y. Sun, RSC Adv., 2014, 4, 51389–51394 RSC.
- B. Zhao, G. Shao, B. B. Fan, W. Y. Zhao and R. Zhang, Phys. Chem. Chem. Phys., 2015, 17, 2531 RSC.
- C. Wang, X. Han, X. Zhang, S. Hu, T. Zhang, J. Wang, Y. Du, X. Wang and P. Xu, J. Phys. Chem. C, 2010, 114, 14826–14830 CAS.
- B. Pecquenard, F. Le Cras, D. Poinot, O. Sicardy and J.-P. Manaud, ACS Appl. Mater. Interfaces, 2014, 6, 3413–3420 CAS.
- Y. Wang, D. Chen, X. Yin, P. Xu, F. Wu and M. He, ACS Appl. Mater. Interfaces, 2015, 7, 26226 CAS.
- V. Panwar and R. M. Mehra, Polym. Eng. Sci., 2008, 48, 2178 CAS.
- A. Ohlan, K. Singh, A. Chandra and S. K. Dhawan, ACS Appl. Mater. Interfaces, 2010, 2, 927–933 CAS.
- Y. Zhang, Y. Huang, T. F. Zhang, H. C. Chang, P. S. Xiao, H. H. Chen, Z. Y. Huang and Y. S. Chen, Adv. Mater., 2015, 27, 2049 CrossRef CAS PubMed.
- J. Qiu and T. Qiu, Carbon, 2015, 81, 20 CrossRef CAS.
- X. L. Shi, M. S. Cao, J. Yuan, Q. L. Zhao, Y. Q. Kang, X. Y. Fang and Y. J. Chen, Appl. Phys. Lett., 2008, 93, 183118 CrossRef.
- X. Liu, G. Zhou, S. W. Or and Y. Sun, RSC Adv., 2014, 4, 51389–51394 RSC.
- R. Lv, F. Kang, J. Gu, X. Gui, J. Wei, K. Wang and D. Wu, Appl. Phys. Lett., 2008, 93, 223105 CrossRef.
- Y. Chen, X. Liu, X. Mao, Q. Zhuang, Z. Xie and Z. Han, Nanoscale, 2014, 6, 6440–6447 RSC.
- G. Wang, Z. Gao, S. Tang, C. Chen, F. Duan, S. Zhao, S. Lin, Y. Feng, L. Zhou and Y. Qin, ACS Nano, 2012, 6, 11009 CrossRef CAS PubMed.
- C. Wang, X. Han, X. Zhang, S. Hu, T. Zhang, J. Wang, Y. Du, X. Wang and P. Xu, J. Phys. Chem. C, 2010, 114, 14826–14830 CAS.
- B. Lu, H. Huang, X. L. Dong, X. F. Zhang, J. P. Lei, J. P. Sun and C. Dong, J. Appl. Phys., 2008, 104, 114313 CrossRef.
- Z. Yang, Z. Li, L. Yu, Y. Yang and Z. Xu, J. Mater. Chem. C, 2014, 2, 7583–7588 RSC.
- L. Wang, X. Jia, Y. Li, F. Yang, L. Zhang, L. Liu, X. Ren and H. Yang, J. Mater. Chem. A, 2014, 2, 14940–14946 CAS.
- L. Jiang, Z. Wang, D. Li, D. Geng, Y. Wang, J. An, J. He, W. Liu and Z. Zhang, RSC Adv., 2015, 5, 40384–40392 RSC.
- L. Wang, Y. Huang, X. Sun, H. Huang, P. Liu, M. Zong and Y. Wang, Nanoscale, 2014, 6, 3157–3164 RSC.
- Q. Wang, Z. Lei, Y. Chen, Q. Ouyang, P. Gao, L. Qi, C. Zhu and J. Zhang, J. Mater. Chem. A, 2013, 1, 11795–11801 CAS.
- B. Wang, J. Zhang, T. Wang, L. Qiao and F. Li, J. Alloys Compd., 2013, 567, 21–25 CrossRef CAS.
- X. Zhang, X. Dong, H. Huang, B. Lv, J. Lei and C. Choi, J. Phys. D: Appl. Phys., 2007, 40, 5383 CrossRef CAS.
- S. Wen, Y. Liu, X. Zhao, J. Cheng and H. Li, J. Magn. Magn. Mater., 2014, 354, 7–11 CrossRef CAS.
- A. Kargar, Y. Jing, S. J. Kim, C. T. Riley, X. Pan and D. Wang, ACS Nano, 2013, 7, 11112–11120 CrossRef CAS PubMed.
- J. Zeng, J. Xu, P. Tao and W. Hua, J. Alloys Compd., 2009, 487, 304–308 CrossRef CAS.
- J. Zeng, P. Tao, S. Wang and J. Xu, Appl. Surf. Sci., 2009, 255, 4916–4920 CrossRef CAS.
- X. Liu, C. Feng, S. W. Or, Y. Sun, C. Jin, W. Li and Y. Lv, RSC Adv., 2013, 3, 14590–14594 RSC.
- B. Zhao, G. Shao, B. Fan, W. Li, X. Pian and R. Zhang, Mater. Lett., 2014, 121, 118–121 CrossRef CAS.
- K. Singh, A. Ohlan, V. H. Pham, R. Balasubramaniyan, S. Varshney, J. Jang, S. H. Hur, W. M. Choi, M. Kumar, S. K. Dhawan, B.-S. Kong and J. S. Chung, Nanoscale, 2013, 5, 2411–2420 RSC.
- B. Zhao, B. Fan, G. Shao, B. Wang, X. Pian, W. Li and R. Zhang, RSC Adv., 2014, 4, 61219–61225 RSC.
- B. Zhao, B. Fan, G. Shao, B. Wang, X. Pian, W. Li and R. Zhang, J. Magn. Magn. Mater., 2014, 372, 195–200 CrossRef CAS.
|
| This journal is © The Royal Society of Chemistry 2017 |
Click here to see how this site uses Cookies. View our privacy policy here.  Open Access Article
 *a,
Zuoyi Xiaoa,
Shangru Zhai
 *a and
Zhan Shi
 b
b
![[thin space (1/6-em)]](https://www.rsc.org/images/entities/char_2009.gif) :
:![[thin space (1/6-em)]](https://www.rsc.org/images/entities/char_2009.gif) 1, the typical CoNi–CuO composite microspheres presented a promising microwave absorption performance, namely a maximum reflection loss (RL) of −25.1 dB at 13.2 GHz with a thickness of only 2.5 mm, while the effective microwave absorption bandwidth (RL < −10) could reach 3.4 GHz (from 10.0 to 13.4 GHz). As is demonstrated, this kind of newly fabricated CoNi–CuO composite can be regarded as a promising candidate for high-performance microwave absorption materials.
1, the typical CoNi–CuO composite microspheres presented a promising microwave absorption performance, namely a maximum reflection loss (RL) of −25.1 dB at 13.2 GHz with a thickness of only 2.5 mm, while the effective microwave absorption bandwidth (RL < −10) could reach 3.4 GHz (from 10.0 to 13.4 GHz). As is demonstrated, this kind of newly fabricated CoNi–CuO composite can be regarded as a promising candidate for high-performance microwave absorption materials.![[thin space (1/6-em)]](https://www.rsc.org/images/entities/char_2009.gif) tan
tan![[thin space (1/6-em)]](https://www.rsc.org/images/entities/char_2009.gif) h[j(2πƒd)/c(μrεr)1/2]1
h[j(2πƒd)/c(μrεr)1/2]1![[thin space (1/6-em)]](https://www.rsc.org/images/entities/char_2009.gif) log|(Zin − Z0)/(Zin + Z0)|2
log|(Zin − Z0)/(Zin + Z0)|2

![[thin space (1/6-em)]](https://www.rsc.org/images/entities/char_2009.gif) :
:![[thin space (1/6-em)]](https://www.rsc.org/images/entities/char_2009.gif) 1 (CoNi/CuO-1). In addition, both the size and thickness of the CuO shells were small and thin, because of low concentration of precursor (Cu2+). In this way, the interface space disappeared significantly, resulted from the high density accumulation of CuO sheets, which was harmful to microwave absorption. When the mass ratio was increased to 2.5
1 (CoNi/CuO-1). In addition, both the size and thickness of the CuO shells were small and thin, because of low concentration of precursor (Cu2+). In this way, the interface space disappeared significantly, resulted from the high density accumulation of CuO sheets, which was harmful to microwave absorption. When the mass ratio was increased to 2.5![[thin space (1/6-em)]](https://www.rsc.org/images/entities/char_2009.gif) :
:![[thin space (1/6-em)]](https://www.rsc.org/images/entities/char_2009.gif) 1 (CONi/CuO-2), as shown by Fig. 3(b1 and b2), it can be clearly found that larger and thicker CuO crystal tablets were coated on CoNi microspheres, leading to the formation of prominent interfaces combined with CoNi alloy particles. These interfaces were beneficial for microwave absorption because amounts of reactions occurred on them, such as microwave scattering, reflecting and interfacial polarization. In a certain range, this heterogeneous interface would be better with increasing CuO content, while the loss of electromagnetic waves would have been strengthened. However, when rising the mass ratio to 5
1 (CONi/CuO-2), as shown by Fig. 3(b1 and b2), it can be clearly found that larger and thicker CuO crystal tablets were coated on CoNi microspheres, leading to the formation of prominent interfaces combined with CoNi alloy particles. These interfaces were beneficial for microwave absorption because amounts of reactions occurred on them, such as microwave scattering, reflecting and interfacial polarization. In a certain range, this heterogeneous interface would be better with increasing CuO content, while the loss of electromagnetic waves would have been strengthened. However, when rising the mass ratio to 5![[thin space (1/6-em)]](https://www.rsc.org/images/entities/char_2009.gif) :
:![[thin space (1/6-em)]](https://www.rsc.org/images/entities/char_2009.gif) 1 (CoNi/CuO-3), coacervated CuO nanoflakes aggregated on CoNi alloy microspheres (see Fig. 3(c1 and c2)). Under this condition, the surface of core–shell-like hetero-structures became seriously densely structures, which might be unfavorable for the formation of the electromagnetic wave track, resulting in hampering the diffusion of electromagnetic waves on the heterogeneous interface and inside the electromagnetic materials.4,16
1 (CoNi/CuO-3), coacervated CuO nanoflakes aggregated on CoNi alloy microspheres (see Fig. 3(c1 and c2)). Under this condition, the surface of core–shell-like hetero-structures became seriously densely structures, which might be unfavorable for the formation of the electromagnetic wave track, resulting in hampering the diffusion of electromagnetic waves on the heterogeneous interface and inside the electromagnetic materials.4,16


![[thin space (1/6-em)]](https://www.rsc.org/images/entities/char_2009.gif) δm = μ′′/μ′) and dielectric loss tangent (tan
δm = μ′′/μ′) and dielectric loss tangent (tan![[thin space (1/6-em)]](https://www.rsc.org/images/entities/char_2009.gif) δe = ε′′/ε′) were calculated and the results are shown in Fig. 9. Obviously, an increased tendency of dielectric and a decreasing tendency of magnetic loss were observed as the frequency increasing, respectively. Moreover, significant dielectric loss at the high-frequency range and strong magnetic loss at the low-frequency range illustrated that the three samples possessed EMW absorption properties due to complementarities between them.28,37 In addition, the values of dielectric loss tangent were higher than magnetic loss tangent; it showed that dielectric loss had played a key role in the microwave absorption properties. In general, the space-charge polarization and the interfacial polarization were two mainly reasons for dielectric loss of the EMW energy at microwavefrequencies.48 For these particular ‘core–shell-like’ microstructured samples, the formation of more space charge and multi-interface at the interface due to presence of dielectric CuO coated on the surface of CoNi microspheres.10,36 Therefore, the dielectric loss happened owing to a large amount of space charge polarization. Besides, the well dispersion of CuO in the CoNi alloy could introduce more additional interfaces and consequently interfacial polarization, leading to the increase of the interfacial polarization and dielectric loss.49 Except the above reasons, CuO nanoflakes of the composites played the isotropic quasi-antennas role in favoring the penetration of microwave waves, which could generate continuous micro-networks and thus a large-scale vibrating micro-current would be induced into a dissipative current and consumed in discontinuous networks.12,29 Furthermore, from Fig. 9b, the dielectric loss values of CoNi/CuO-2 is highest among three samples, clearly indicating that it has excellent capability of microwave absorption in contrast to other two samples with varied CuO loadings.
δe = ε′′/ε′) were calculated and the results are shown in Fig. 9. Obviously, an increased tendency of dielectric and a decreasing tendency of magnetic loss were observed as the frequency increasing, respectively. Moreover, significant dielectric loss at the high-frequency range and strong magnetic loss at the low-frequency range illustrated that the three samples possessed EMW absorption properties due to complementarities between them.28,37 In addition, the values of dielectric loss tangent were higher than magnetic loss tangent; it showed that dielectric loss had played a key role in the microwave absorption properties. In general, the space-charge polarization and the interfacial polarization were two mainly reasons for dielectric loss of the EMW energy at microwavefrequencies.48 For these particular ‘core–shell-like’ microstructured samples, the formation of more space charge and multi-interface at the interface due to presence of dielectric CuO coated on the surface of CoNi microspheres.10,36 Therefore, the dielectric loss happened owing to a large amount of space charge polarization. Besides, the well dispersion of CuO in the CoNi alloy could introduce more additional interfaces and consequently interfacial polarization, leading to the increase of the interfacial polarization and dielectric loss.49 Except the above reasons, CuO nanoflakes of the composites played the isotropic quasi-antennas role in favoring the penetration of microwave waves, which could generate continuous micro-networks and thus a large-scale vibrating micro-current would be induced into a dissipative current and consumed in discontinuous networks.12,29 Furthermore, from Fig. 9b, the dielectric loss values of CoNi/CuO-2 is highest among three samples, clearly indicating that it has excellent capability of microwave absorption in contrast to other two samples with varied CuO loadings.

![[thin space (1/6-em)]](https://www.rsc.org/images/entities/char_2009.gif) tan
tan![[thin space (1/6-em)]](https://www.rsc.org/images/entities/char_2009.gif) h[j(2πƒd)/c(μrεr)1/2]
h[j(2πƒd)/c(μrεr)1/2]
![[thin space (1/6-em)]](https://www.rsc.org/images/entities/char_2009.gif) log|(Zin − Z0)/(Zin + Z0)|
log|(Zin − Z0)/(Zin + Z0)|


