
 Open Access Article
 This Open Access Article is licensed under a Creative Commons Attribution-Non Commercial 3.0 Unported Licence
The origin of Mo promotion during H2 pretreatment on an Fe catalyst for Fischer–Tropsch synthesis†
Liping Li a,
Caixia Hub,
Wen Liua,
Peng Feia,
Xiaojing Cui*c,
Yongwang Libc and
Jian Xub
a,
Caixia Hub,
Wen Liua,
Peng Feia,
Xiaojing Cui*c,
Yongwang Libc and
Jian Xub
aCollege of Chemistry and Environmental Engineering, Shanxi Datong University, Datong, Shanxi 037009, People's Republic of China
bSynfuels China Technology Co. Ltd., Leyuan South Street II, No. 1, Yanqi Economic Development Zone C#, Huairou District, Beijing, 101407, People's Republic of China
cState Key Laboratory of Coal Conversion, Institute of Coal Chemistry, Chinese Academy of Sciences, Taiyuan, 030001, People's Republic of China. E-mail: cuixj@sxicc.ac.cn
First published on 15th September 2017
Abstract
It is of vital importance but remains a grand challenge to understand comprehensively the effect of promoter elements on the active sites. Here, we report the experimental evidence of the origin of the promotion of molybdenum (Mo) during H2 pretreatment on iron (Fe) catalysts for Fischer–Tropsch synthesis (FTS). By combing in situ laser Raman spectroscopy, Mössbauer spectroscopy, electron microscopy and in situ infrared spectroscopy, the promotion is related to the dispersion of Mo on the Fe surface during H2 pretreatment, which inhibits the agglomeration of Fe and favors the formation of small Fe nanoparticles (NPs). The Mo coverage showed a strong dependency on the pretreatment temperature and the Mo amount in the FeMo catalyst. The strong Fe–Mo interaction caused by the Mo coverage weakened the activation of CO molecules on active Fe sites, which primarily accounts for the decline in the intrinsic activity (TOFCO) of active Fe sites.
1. Introduction
The Fischer–Tropsch synthesis (FTS) process, which converts syngas into clean fuels, has been considered as an important and practical strategy to cope with the fuel shortage.1,2 Iron-based catalysts are commonly used as catalysts for the industrial Fischer–Tropsch synthesis process.3,4 Several metal elements are usually applied as promoters in iron-based catalysts, and they could tune the catalyst activity and selectivity remarkably.3,5–14 Much work has been done to understand the promotional effect of the added metal elements, which has been demonstrated to originate from the electronic modification and/or the morphological change of the catalytically active iron centers.5–14The iron-based catalysts are subjected to a pretreatment process before use. As the metal promoters exist commonly in the form of oxides in the prepared iron-based catalyst systems, they may be reduced and undergo structure reconstruction during the pretreatment process. Therefore, it is of vital importance to elucidate the dynamical evolutions of the metal promoters during the pretreatment and FTS processes in order to understand comprehensively their promotional effect. In situ characterizations provide possibilities to clearly understand the dynamic changes in the chemistry of the metal promoters in the iron-based FTS catalysts. However, this remains grand challenge for most of the in situ characterizations including in situ HRTEM and XPS that are sensitive to the structure and valence of the catalysts are commonly performed under conditions that are far from the FTS working conditions (such as vacuum condition and low temperatures).15,16 Adding to this difficulty, the amounts of the metal promoters are usually minor in the iron-based FTS catalysts, which are near or below the detection limits for most characterization methods.3,5–14
Molybdenum nitride17 and carbide17,18 were reported to show excellent hydrogenation/isomerization activity and moderate FTS activity. In addition, molybdenum is applied as a promoter in the iron-based catalysts for coal indirect liquefaction and the FTS process.19–24 Particularly for the iron-based FTS catalysts, the promotion of Mo has been demonstrated to shift the product spectrum to light hydrocarbons and reduce the catalyst deactivation caused by coke.19–24 Many efforts are being paid to comprehensively understand the origin of this Mo promotion,19–26 particularly at H2 pretreatment.19,20,26 Besides, the changes in the covalent state and morphology of Mo promoter during H2 pretreatment and their effects on the structure and chemisorption behaviors of Rh were studied on supported Rh/ZrO2 and Rh/SiO2 catalysts for CO hydrogenation.27–29 Agglomeration of Mo during pretreatment in CO and syngas (H2/CO = 0.67) has been demonstrated in our previous studies, which caused the sintering of iron carbides and a loss in the activity.25 In the present work, by combing in situ laser Raman spectroscopy, Mössbauer spectroscopy, electron microscopy and in situ infrared spectroscopy, we show the promotion of Mo during pretreatment in H2 and how it affects the Fischer–Tropsch synthesis over iron catalyst.
2. Experimental section
2.1 Catalyst preparation
Iron–molybdenum catalysts were prepared by the same co-precipitation method reported in ref. 25 with iron nitrate Fe(NO3)3·9H2O and ammonium heptamolybdate (NH4)6Mo7O24·4H2O. In brief, the iron nitrate solution was added into a solution of ammonium heptamolybdate (pH = 2). NH4OH was then added dropwisely at 80 °C into the mixed solution until a pH of 6 was reached. The resulted iron and molybdenum precipitate was aged under vigorous stirring at 90 °C for 3 h, followed by filtering and drying at 120 °C for 48 h. The catalyst samples were then calcinated at 375 °C for 10 h. The unpromoted iron catalyst was obtained by precipitated nitrate of iron according to the method described above. The prepared catalysts were designated as 100Fe for the unpromoted iron catalyst, and 100Fe2Mo, 100Fe5Mo, 100Fe8Mo and 100Fe10Mo (the molar ratio of Fe/Mo = 100![[thin space (1/6-em)]](https://www.rsc.org/images/entities/char_2009.gif) :2, 100:5, 100:8 and 100:10) respectively for the iron–molybdenum bimetallic catalyst precursors.
:2, 100:5, 100:8 and 100:10) respectively for the iron–molybdenum bimetallic catalyst precursors.
2.2 Catalyst characterization
The BET surface area, pore volume and pore size distribution of the catalyst precursors were determined via nitrogen physisorption at the normal boiling point of N2 (−196 °C) using an ASAP 2420 (Micromeritics, USA).Powder X-ray diffraction (XRD) measurements of the catalyst precursors were carried out using a D/max-RA X-ray diffratometer (Rigaku, Japan), equipped with Cu Kα radiation (λ = 1.5406 Å) at 40 kV and 150 mA. The patterns were scanned at a rate of 2° min−1 from 2θ = 10° to 80°.
HRTEM characterization was performed at a JEOL 2010 HRTEM (JEOL, Japan) using an accelerating voltage of 200 kV. The samples were dispersed in ethanol and mounted on a carbon foil supported on a copper grid. TEM images and EDS mapping of Fe and Mo in calcined 100Fe10Mo were obtained using a FEI Tecnai 20 TEM with an accelerating voltage of 200 kV.
H2 temperature programmed desorption (H2-TPD) characterization was performed in a quartz tube on an AutoChem II 2920 chemisorption analyzer. In each experiment, 100 mg of the sample was pretreated in situ in a flow of 5% H2/95% Ar at 350 °C for 12 h (30 mL min−1). After purging with a Ar flow of 30 mL min−1 for 0.5 h at 350 °C to exclude physisorbed H2, the sample was cooled down to 50 °C and 10% H2/90% Ar was purged into the quartz microreactor with a flow rate of 30 mL min−1 and kept for 0.5 h. Then, the sample was purged in Ar at 50 °C for 0.5 h, and heated from 50 °C to 850 °C at a rate of 10 °C min−1. The desorbed H2 was monitored by a thermal conductivity detector (TCD). The H2-TPD profiles of 100Fe5Mo and 100Fe10Mo were fitted using a nonlinear least-squares method with a Gaussian function.
LRS spectra of catalyst precursors and in situ Laser Raman spectra (LRS) were obtained by a Horiba-Jobin Yvon LabRam HR Raman System using a UV-sensitive liquid N2 cooled CCD detector (Horiba-Jobin Yvon CCD-3000V) and a UV laser (λ = 325 nm) as the ray source which was set to an output power of 30 mW. The laser was focused on the samples with a confocal microscope equipped with a 15× objective (OFR LMU-15X-NUV). An appropriate homemade stainless cell was designed with a double-walled quartz window at the top and an internal heating system. One set of stainless steel gas lines was connected to the cell, which allows in situ pretreatment. The catalyst samples which was pressed and sieved to 60–80 mesh was loaded in a stainless reactor and was then mounted in vertical position inside the cell. The catalyst sample was in situ pretreated in 5% H2/95% Ar (by mole basis) at a rate of 10 °C min−1 to 350 °C and held for 200 min. The Raman spectra were taken at 350 °C.
The Mössbauer spectra (MES) at 20 K were collected using a CANBERRA series 40 MCA constant-acceleration drive with a triangular reference signal. The γ-ray source was a 57Co in Pd matrix. The Mössbauer spectra were analyzed using a nonlinear least squares fitting procedure with a set of independent Lorentzian lines including singlets, quadruple doublets, and/or magnetic sextets.
In situ CO-Diffuse Reflectance Fourier Transform Infrared spectroscopy (CO-DRFTIR) spectra were recorded with a resolution of 4 cm−1 on an FT-IR spectrometer supplied with a detector and a diffuse reflectance attachment. A stainless cell was designed with two ZnSe windows at the top sphere and an internal heating system. It was connected with one set of stainless steel gas lines, allowing in situ pretreatment and CO chemisorption. About 30 mg catalyst was in situ pretreated in flowing 5% H2/95% Ar or 5% CO/95% He at 280 or 350 °C for 12 h. For H2 pretreatment, the sample was purged with Ar for 0.5 h and cooled down to 20 °C in Ar; for CO pretreatment, the sample was purged with He for 0.5 h and cooled down to 20 °C in He. A set of experiments was performed at 20 °C on the in situ pretreated samples by gradually pulsing different amounts (0.1–4 mmol) of CO and recording the spectra after each dosage. After CO adsorption on the sample reached saturation, the flowing He was passed through the sample until no adsorption of molecular CO was detected. The final spectrum at the end of He purging process was recorded.
2.3 Catalyst testing
2 g of the catalyst precursor was mixed with 20–40 mesh quartz granules up to 3 cm3. The mixture was loaded into the isothermal section of a fixed-bed reactor. The catalyst pretreatment was carried out in situ with a stream of H2 under 280 °C or 350 °C, 1 atm and 6 NL per g-cat per h for 12 h. The reactor was cooled down to 200 °C and then pressurized up to 1.5 MPa. The temperature was gradually increased to 280 °C. FTS reaction was carried out in a flow of syngas (H2/CO = 1.6) at 280 °C and 3 NL per g-cat per h. Both the purified feed gases and the tail gas were analyzed by on-line gas chromatographs (GCs, models 6890N and 4890D; Agilent) and its flow rate was measured by a wet-gas flowmeter.3. Results and discussion
As shown in Table S1 in ESI,† with the molar ratio of Mo/Fe in the catalyst increasing from 2/100 to 10/100, the BET surface area increased from 41 to 157 m2 g−1 while the average pore size decreased from 5.5 to 3.3 nm. The average crystallite sizes of α-Fe2O3 in the FeMo catalyst precursors were calculated using Scherer's equation taking diffraction peak at 2θ = 33°.30 As shown in Table S1 and Fig. S1 in ESI,† the particle size of α-Fe2O3 decreased continuously with the increase of Mo loading level. As indicated by XRD, the particle size of α-Fe2O3 in 100Fe was estimated to be 32 nm, which was decreased to 30, 17 and 14 nm in 100Fe2Mo, 100Fe5Mo and 100Fe8Mo, respectively. 100Fe10Mo, however, can't be accurately estimated by the Scherer's equation since its diffraction peaks were poorly resolved. For further evaluation of size distributions of α-Fe2O3 in the FeMo catalyst precursors, HRTEM characterization were carried out, as shown in Table S1 and Fig. S2 in ESI.† The average particle sizes of α-Fe2O3 estimated by HRTEM decreased from 23 and 6 nm as a function of Mo loading level (from 100Fe2Mo to 100Fe10Mo). Furthermore, the evolution of Mo in 100Fe10Mo during the preparation process was investigated by LRS (Fig. S3 and Table S2 in ESI†). Fe(NO3)3·9H2O and (NH4)6MoO24·4H2O were also studied for the accurate assignment of LRS peaks. No bands of Mo were detected after precipitation. A band at 947 cm−1 appeared after drying. This band can be attributed to Mo![[double bond, length as m-dash]](https://www.rsc.org/images/entities/char_e001.gif) O vibration in Mo7O246− compared with the result of (NH4)6MoO24·4H2O, in accordance with the literature.31 After calcination, the bands of polymer Mo species and MoO3 particles were observed. This result indicated the agglomeration of Mo (from highly dispersed state into polymerized/crystallite state) during the preparation. MoO3 in the FeMo catalysts were, as indicated by HRTEM, nanoparticles with an average particle size smaller than 8 nm (Fig. S4 in ESI†). The uniform distribution of Mo in the catalyst precursor was verified by EDS analysis (Fig. S5 in ESI†).
O vibration in Mo7O246− compared with the result of (NH4)6MoO24·4H2O, in accordance with the literature.31 After calcination, the bands of polymer Mo species and MoO3 particles were observed. This result indicated the agglomeration of Mo (from highly dispersed state into polymerized/crystallite state) during the preparation. MoO3 in the FeMo catalysts were, as indicated by HRTEM, nanoparticles with an average particle size smaller than 8 nm (Fig. S4 in ESI†). The uniform distribution of Mo in the catalyst precursor was verified by EDS analysis (Fig. S5 in ESI†).
The FTS performance of all the H2 pretreated catalysts was tested in a fixed bed reactor. The CO conversion is used as a measurement of FTS reactivity (Table 1 and Fig. S6 in ESI†). No activity was observed on MoO3 reduced under the same conditions with the FeMo catalysts. Therefore, the variety in the catalyst activities should result from the difference in the nature of active iron particles. The initial activity of 100Fe was nearly 50% (TOS = 24 h), which declined quickly and reached steady-state after TOS = 72 h (Fig. S6 in ESI†). For the FeMo catalysts, the induction period were about 24 to 48 h (Fig. S6 in ESI†). On the basis of this result, the activities of all the catalysts were compared at a TOS of 72 h. 100Fe2Mo catalyst showed highest activity among all the catalysts and its activity was about thrice as high as that of 100Fe. The activity declined with the further increment in the Mo loading level. Although the activity of 100Fe10Mo was lowest among all the FeMo catalysts, it was about twice as high as that of 100Fe. The enhancement effect of Mo on the activity was also obvious after reaction for 192 h. The strong interdependency can be observed between the product distribution of the FeMo catalysts and the amount of Mo. The selectivity to lighter hydrocarbons, i.e., CH4 and C2–C4, was increasingly promoted while that of C5+ hydrocarbons was depressed by the increment in the Mo amount (Table 1). Besides, the addition of Mo largely promoted the selectivity of CO2, which was two or three times of that of 100Fe catalyst. The effect of Mo on promoting the light hydrocarbons and CO2 has also been demonstrated.19–26
| Catalyst | Particle sizeb (nm) | CO conv.% | TOFe | Hydrocarbon selectivity, wt% | CO2 mol% | |||||
|---|---|---|---|---|---|---|---|---|---|---|
| XRDc | TEMd | molCO per mmolFe h | CH4 | C2 | C3 | C4 | C5+ | |||
| a Reaction condition: 280 °C, H2/CO = 1.6, GHSV = 3 NL per g-cat per h, TOS = 72 h.b The catalysts after pretreatment in H2 at 350 °C for 12 h.c The average size of α-Fe in the pretreated catalysts was calculated using Scherer's equation taking the diffraction peak at 2θ = 42.9°.d The average iron crystallite size of the pretreated catalysts was calculated from HRTEM data.e TOF = mmol converted CO/(mmolFe h), where mmolFe represents the mole of the total surface Fe atoms in each catalyst which are obtained based on XRD result, the molFe values of the catalysts are calculated and listed in Table S5 in ESI. | ||||||||||
| MoO3 | — | — | 0 | 0 | 0 | 0 | 0 | 0 | 0 | 0 |
| 100Fe | 36 | 29 | 33.6 | 1164.9 | 11.6 | 13.5 | 19.2 | 14.0 | 41.7 | 19.6 |
| 100Fe2Mo | 28 | — | 94.4 | 2306.6 | 21.3 | 15.2 | 19.2 | 11.6 | 32.7 | 44.9 |
| 100Fe5Mo | 20 | 14 | 75.8 | 852.8 | 23.3 | 17.3 | 20.3 | 13.0 | 26.1 | 36.6 |
| 100Fe8Mo | 19 | — | 80.6 | 537.6 | 24.9 | 19.6 | 21.6 | 12.4 | 21.5 | 45.0 |
| 100Fe10Mo | 13 | 10 | 68.4 | 475.6 | 31.4 | 17.5 | 19.2 | 10.9 | 21.0 | 45.0 |
To understand the origin of the catalytic reactivity over FeMo catalysts, we further investigated the dynamic changes in the structure and morphology of Fe and Mo in the catalysts during pretreatment in H2. The dynamic migration of Mo during the H2 pretreatment was detailed by in situ LRS (Fig. 1). For better comparison, the LRS characterization of all the catalyst precursors was also performed. The band at ca. 323 cm−1 in the spectra of all the catalysts was caused by the laser (325 nm). The bands characteristic of hematite was observed in the spectrum of 100Fe catalyst precursor.32 A small band at 990 cm−1 and a broad band in the 760–950 cm−1 region showed up in the spectra of the FeMo catalyst precursors, which are assigned to crystalline MoO3 and a combination of the bands of hematite (803 cm−1) with the surface molybdates (Mo–O–Mo functionalities).33 The reduction of 100Fe in H2 at 350 °C caused the gradual disappearance of some hematite bands, indicating the reduction of hematite. For FeMo catalysts, the band of MoO3 diminished, followed by the formation of a new band at 918 cm−1 that can be assigned to symmetric stretching mode of MoO bond in tetrahedral surface molybdates (isolated).34–37 This result indicated the dispersion of crystalline MoO3 in the FeMo catalysts during reduction in H2, forming isolated molybdate species. This Mo dispersion was more obvious at higher Mo loading levels, as indicated by the higher band intensity of isolated molybdate species. For 100Fe8Mo and 100Fe10Mo catalysts, a band at 864 cm−1 appeared as the reduction time prolonged, which was attributed to the asymmetric stretching of Mo–O–Mo bond in octahedral surface molybdates (polymerized).34,35,38–40 It seems that the enrichment in the surface isolated molybdates caused the formation of polymerized molybdates. Besides, the pretreatment at high temperatures accelerated the spreading of Mo in the FeMo catalysts (Fig. 1D and E).
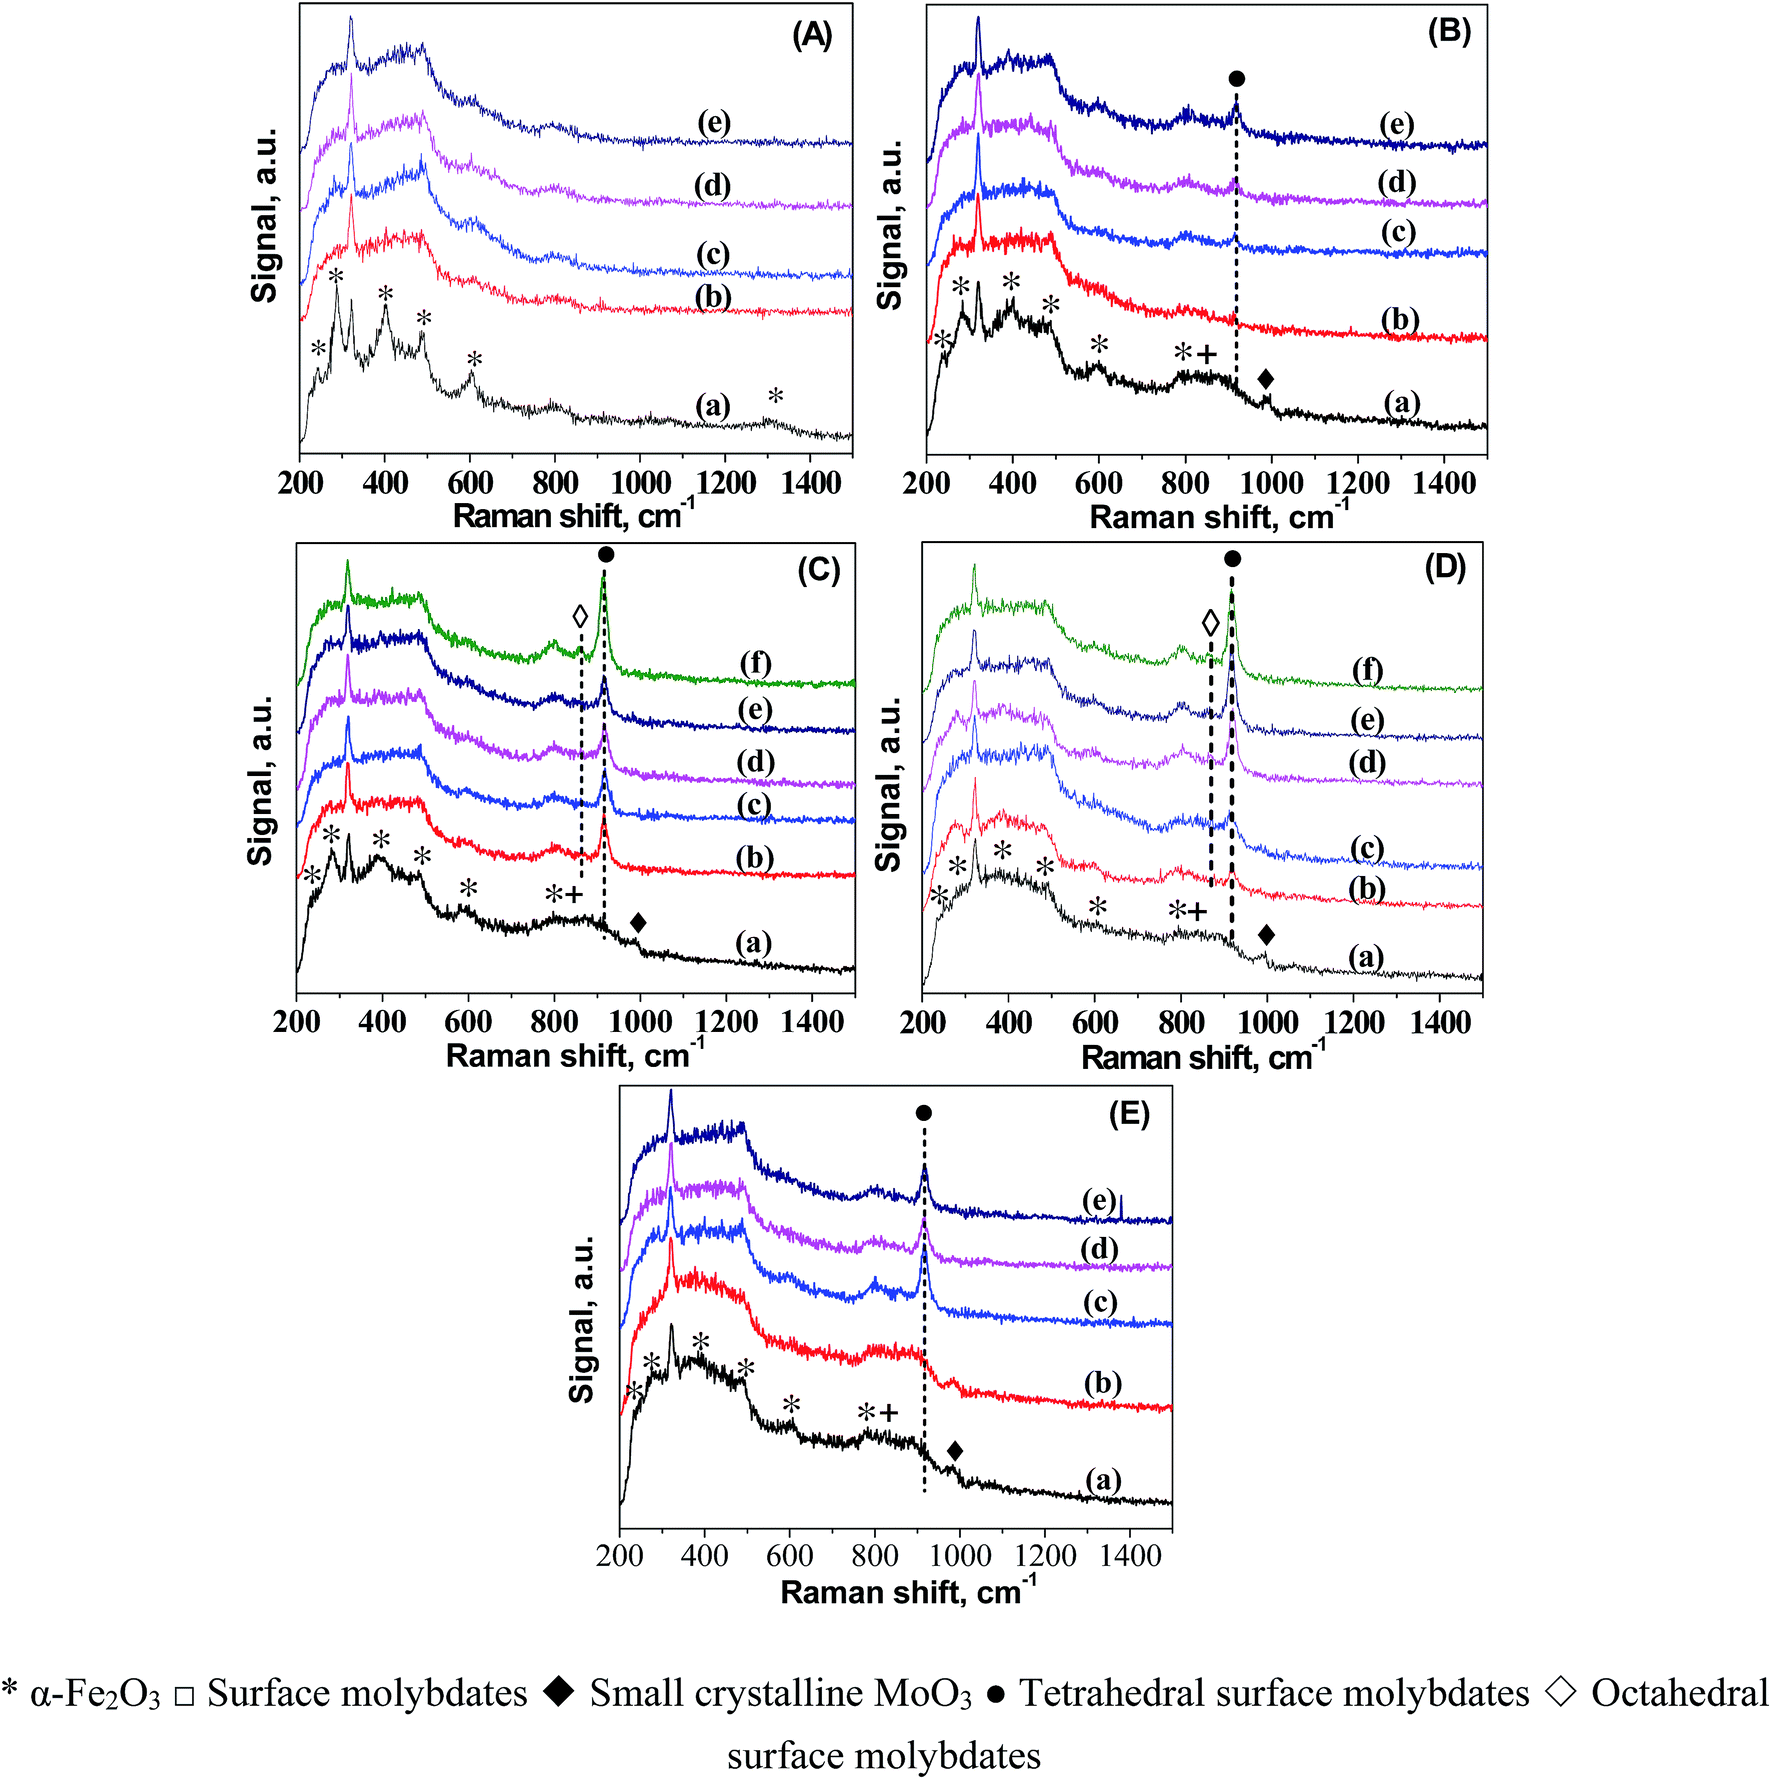 | ||
| Fig. 1 In situ LRS results of: (A) 100Fe after calcination (a), and reduced in H2 at 350 °C for (b) 120 min, (c) 175 min, (d) 180 min, (e) 200 min; (B) 100Fe5Mo after calcination (a), and reduced in H2 at 350 °C for (b) 55 min, (c) 72 min, (d) 98 min, (e) 188 min; (C) 100Fe8Mo after calcination (a), and reduced in H2 at 350 °C for (b) 102 min, (c) 182 min, (d) 193 min, (e) 204 min (f) 219 min; (D) 100Fe10Mo after calcination (a), and reduced in H2 at 350 °C for (b) 55 min, (c) 65 min, (d) 100 min, (e) 130 min, (f) 195 min; (E) 100Fe10Mo after calcination (a), and reduced in H2 at 280 °C for (b) 85 min, (c) 182 min, (d) 204 min, (e) 217 min. | ||
The spreading of MoO3 on oxide supports has been studied by in situ LRS.34 It was interpreted as a solid–solid wetting process driven by the surface free energy reduction, i.e., “carpet unrolling” mechanism, and its spreading rate was found to be accelerated by the water vapor.41 To explain this, the spreading process was suggested to following eqn (1) and (2), that is crystalline MoO3 interacted with water to form the mobile species-oxyhydroxide (MoO2(OH)2)42,43 which interacted with surface hydroxyls to form isolated surface molybdates (MoO42−).43,44 A further increase in the surface concentration of these isolated molybdates would lead to the formation of polymerized molybdates. This explanation correlated well with our in situ LRS observations. This is reasonable since a large amount of water vapor would form during reduction of the FeMo catalyst precursor in H2, particularly at high temperatures. The formed water vapor would facilitate the spreading of MoO3 on the surface of the iron species.
| MoO3 + H2O → MoO2(OH)2 | (1) |
| MoO3 + 2OH− → MoO2−4 + 2H2O | (2) |
Once the pretreatment started, the band intensities of mono- and poly-molybdates developed rapidly to high levels particularly for 100Fe8Mo and 100Fe10Mo catalysts. Note that the increment in the intensities of these two bands is much larger than the decrement in that of MoO3 in the FeMo catalysts. It is therefore possible that the enrichment of Mo species from the bulk to the surface of the catalysts occurred during the reduction, resulting in a catalyst surface richer in Mo species.
H2-TPD experiments were carried out to verify further the Mo coverage on the Fe surface during H2 pretreatment (Fig. 2). For 100Fe catalyst, the two desorption peaks appeared at about 75 and 210 °C, which can be attributed to the adsorbed hydrogen on metallic iron and reduced iron oxides respectively.45,46 The high-temperature desorption peaks (>300 °C) that was absent on the profile of 100Fe, appeared at the profiles of the FeMo catalysts. Therefore, the high-temperature desorption peaks likely attributed to the hydrogen species that adsorbed on the reduced Mo surface. To verify this assumption, the H2-TPD profile of MoO3 was also performed. As expected, all the desorption peaks for pure Mo surface (MoO3) showed up at a temperature range of 300–600 °C, in good accordance with the literature.47 The large difference in the chemisorption temperatures of hydrogen on the reduced surface Mo and Fe sites facilitates the distinction of surface Mo from surface Fe in the FeMo catalysts.
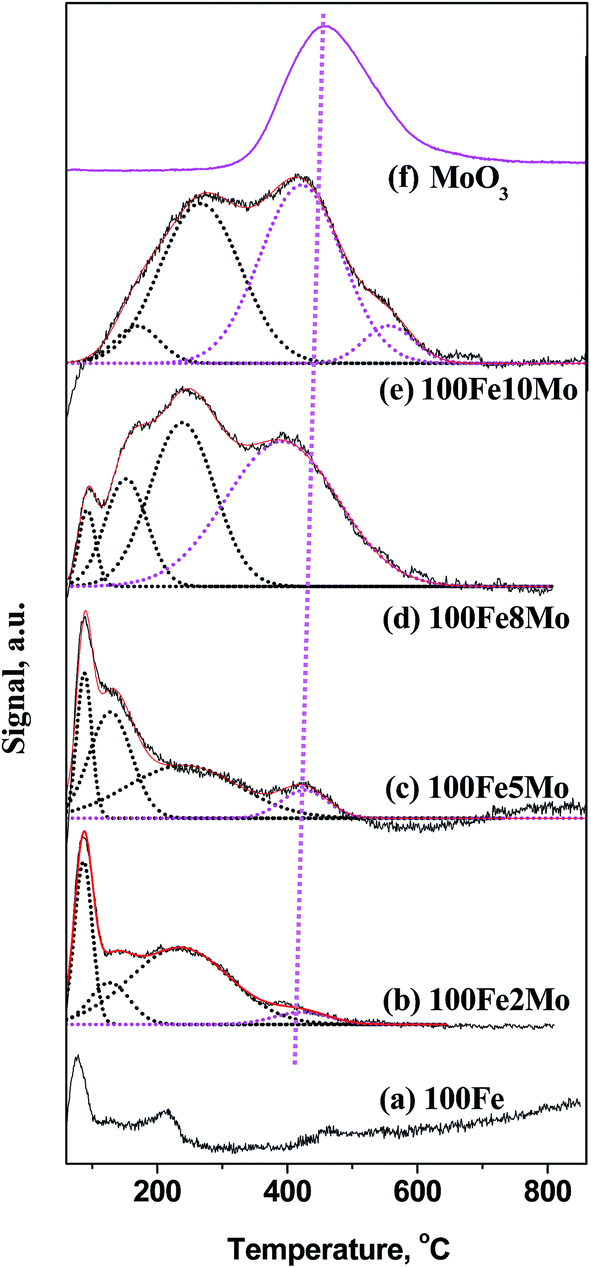 | ||
| Fig. 2 H2-TPD profiles of iron and iron–molybdenum catalysts. | ||
Based on the literature45–47 and our H2-TPD analysis, the desorption peaks below 300 °C were assigned to the hydrogen species on the surface Fe sites, while those above 300 °C were originated from the hydrogen species on the surface Mo sites. Notably, the H2 chemisorbed on the surface Mo sites appeared in 100Fe2Mo and became dominant in 100Fe10Mo. This result implied that the coverage effect of Mo was largely promoted with the increase in the Mo loading levels, consistent with the in situ LRS result. The H2-TPD profiles of the FeMo catalysts were further fitted to acquire the relative amount of surface Fe and Mo sites and the coverage ration of Mo (θMo) (Table S3 in ESI†). The θMo for 100Fe2Mo and 100Fe5Mo were below 10%, which increased to round 50% for 100Fe8Mo and 100Fe10Mo. The unexpected high coverage of Mo on the Fe surface correlated well with the in situ LRS results, i.e., the migration of Mo from the bulk to the surface of the FeMo catalysts.
The effect of Mo dispersion on the morphology and electronic properties of active iron particles were further investigated. Much smaller α-Fe particles were formed in FeMo catalysts than 100Fe catalyst, as indicated by HRTEM (Fig. S7 in ESI†) and XRD (Fig. S8 in ESI†). The average size of α-Fe estimated by XRD and HRTEM declined with the enhancement in the Mo loading level (Table 1). As indicated by in situ LRS results, the spreading of Mo during the pretreatment occurred. The Mo dispersion enhanced the segregation effect of Mo on the iron particles, which inhibited effectively the agglomeration of Fe and favored the formation of small Fe particles. MES was performed at 20 K to accurately identify the distributions of iron phases in the pretreated and used catalysts (Tables 2, S4 and Fig. S9–S12 in ESI†). Notably, after pretreatment at 350 °C in H2, the α-Fe content of 100Fe8Mo and 100Fe10Mo catalysts were lower than that of 100Fe5Mo catalyst. Although several experimental observations have shown the inhibitation effect of Mo on the reduction of iron FTS catalyst,19–26 the origin of this phenomenon are not comprehensively understood. The Mo dispersion occurred during pretreatment inevitably caused the coverage of Mo on the catalyst surface. As the Mo dispersion was boosted by the rise of the Mo loading level, the coverage effect of Mo would be more severe at high Mo loading levels. This coverage effect of Mo hindered the reduction of Fe2O3 to α-Fe. During the FTS reaction, α-Fe phase in the FeMo catalysts transformed into έ-Fe2.2C while χ-Fe5C2 was formed in 100Fe. The amount of χ-Fe5C2 in the used 100Fe was much lower than that of α-Fe in the reduced 100Fe. In contrast, the amount of έ-Fe2.2C in the used FeMo catalysts maintained. This result implied the superior stability of iron carbides in the FeMo catalysts, which is likely resulted from the coverage effect of Mo.
| Procedure | Phases | Area (%) | |||
|---|---|---|---|---|---|
| 100Fe | 100Fe5Mo | 100Fe8Mo | 100Fe10Mo | ||
| a Pretreated in H2 at 280 °C for 12 h.b Pretreated in H2 at 350 °C for 12 h.c Pretreated in H2 at 280 °C for 12 h, followed by FTS reaction for 72 h.d Pretreated in H2 at 350 °C for 12 h, followed by FTS reaction for 72 h.e The iron carbide for the used 100Fe catalyst was χ-Fe5C2. | |||||
| H2, 280 °Ca | α-Fe | 67.3 | 2.7 | 1.1 | 24.8 |
| Reduced | Fe3O4 | 32.7 | 97.3 | 98.9 | 75.2 |
| H2, 350 °Cb | α-Fe | 100.0 | 59.8 | 26.7 | 34.1 |
| Reduced | Fe3O4 | — | 40.2 | 73.3 | 65.9 |
| H2, 280 °Cc | έ-Fe2.2C | 14.3e | 22.3 | 10.5 | 37.2 |
| Used | Fe3O4 | 85.7 | 77.7 | 89.5 | 62.8 |
| H2, 350 °Cd | έ-Fe2.2C | 16.8e | 31.9 | 65.4 | 57.9 |
| Used | Fe3O4 | 83.2 | 68.1 | 34.6 | 42.1 |
As a first approximation, one can assume that the active Fe crystallites in pretreated 100Fe and FeMo catalysts possess a particle size identical to the average size estimated by XRD (Table 1 and Fig. S8 in ESI†). Furthermore, the active Fe sites in FeMo catalysts own the Mo coverage (θMo) estimated by H2-TPD (Table S3 in ESI†). Given this assumption, we estimate the total amounts of the pure surface iron species in all the catalysts (Table S5 in ESI†) and the corresponding intrinsic activity for CO (TOFCO). As listed in Table 1, TOFCO was promoted at low amount of Mo (100Fe2Mo) and largely declined with the increment in the Mo amount. Particularly for 100Fe5Mo, 100Fe8Mo and 100Fe10Mo, although the addition of Mo promoted the overall activity, it caused a loss in TOFCO. This result implied the detrimental effect of Mo on the intrinsic activity of Fe at high Mo amount.
This decline in the intrinsic activity at high Mo loading levels indicated the strong modification of Mo on the electronic properties of active Fe sites. The strong modification of Mo likely originates from pretreatment-induced coverage effect of Mo. With MoOx species/layers covering part of the Fe nanoparticles, the interaction of Fe with Mo becomes strong. To prove this assumption, in situ CO-FTIR experiments was performed to explore the chemisorption behaviors of CO on 100Fe and 100Fe10Mo catalyst (Fig. 3). This is based on the understanding that the adsorption of reactants on the active Fe sites that were strongly interacted with Mo would be different from those with weak and no Fe–Mo interactions. 100Fe10Mo catalyst was chosen as a representative of the FeMo catalysts. The Fe–Mo interaction can be tuned simply by regulating the pretreatment protocols. As indicated by the in situ LRS, for H2 pretreatment, the Fe–Mo interaction can be tuned by regulating the pretreatment temperature, and a stronger Fe–Mo interaction can be achieved at 350 °C than at 280 °C. Besides, the agglomeration of Mo and the consequent phase separation of Fe and Mo was identified during CO pretreatment.25 In such conditions the Fe–Mo interaction would be largely weakened.
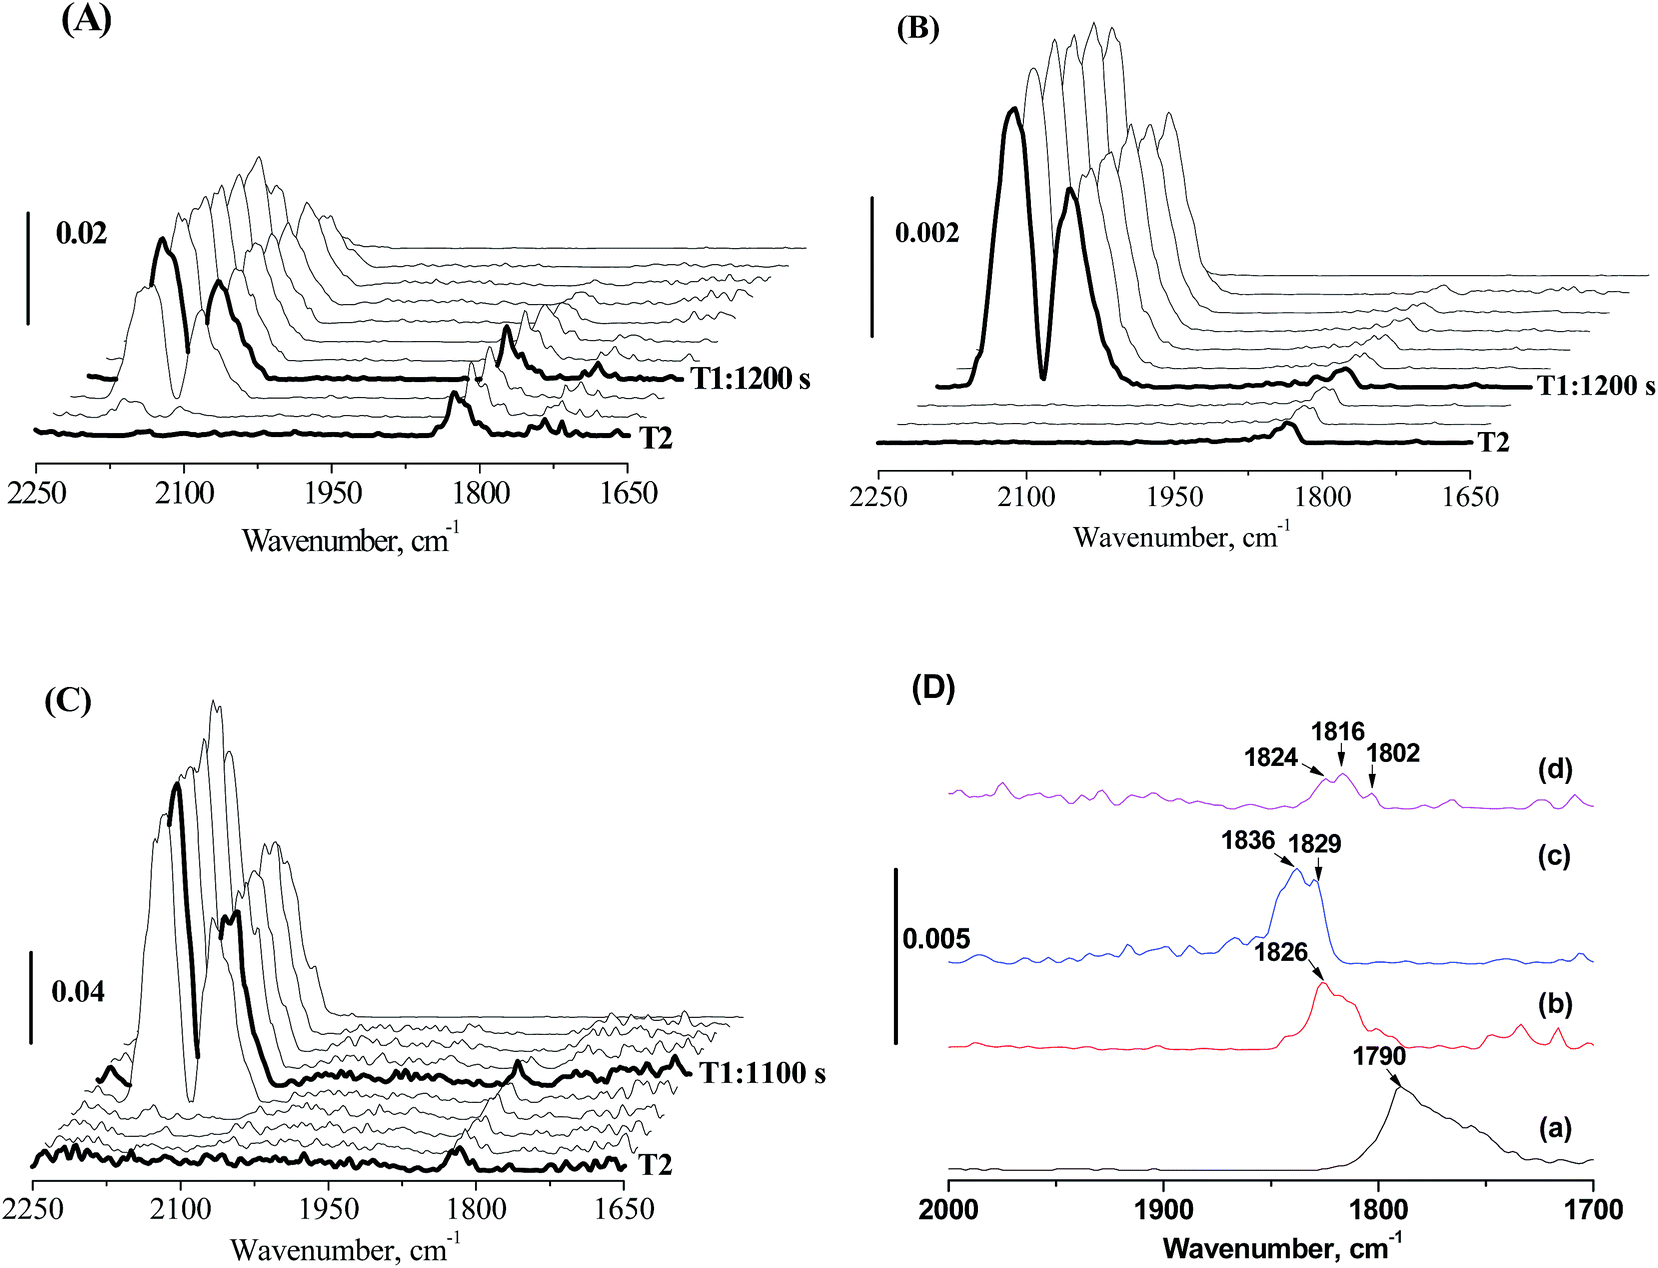 | ||
| Fig. 3 In situ CO-FTIR profiles of 100Fe10Mo pretreated in 5% H2/95% Ar for 12 h at (A) 280 °C and (B) 350 °C, (C) pretreated in 5% CO/95% He for 12 h at 350 °C and (D) the profiles at 1700–2000 cm−1 region at T2: (a) 100Fe pretreated in H2 at 350 °C, 100Fe10Mo pretreated in H2 at (b) 280 °C and (c) 350 °C, and (d) 100Fe10Mo pretreated in CO at 350 °C. T1, when CO adsorption was saturated; T2, when molecule CO adsorption was completely removed. | ||
No CO adsorption bands were observed in the in situ CO-FTIR spectra of MoO3, indicating that CO only adsorbed on the iron sites. The bands at about 1790 cm−1 on 100Fe can be attributed to the multiply bridge-bonded CO on deep hollow Fe sites,48,49 while these bands were shifted largely towards the higher wavenumber direction to 1843–1816 cm−1 for 100Fe10Mo catalysts (Fig. 3D). The frequencies of these bands located at about 1826 cm−1 when 100Fe10Mo was pretreated in H2 at 280 °C, which moved towards high wavenumber direction (1836 and 1829 cm−1) when pretreated in H2 at 350 °C (Fig. 3A, B and D). Similarly, in comparison with CO pretreatment, a blue shift was observed for the catalyst pretreated in H2 (Fig. 3B–D). According to Blyholder's model,50 the blue shift can be interpreted as a decrease in the backbonding from the iron d orbital into the CO 2π orbital. Namely, the activation of carbon–oxygen bond in CO becomes less efficient with the blue shift in wavenumber. This result indicated that the strong interaction of Fe and Mo disfavored the activation of CO on the Fe active sites, which primarily accounts for the loss in the intrinsic activity of active Fe sites at high Mo loading levels.
4. Conclusion
For the FeMo catalysts, a migration of MoOx from the bulk of the FeMo catalyst followed by dispersion along the catalyst surface into mono- and polymolybdates occurred during pretreatment in H2. The Mo coverage was promoted by the rise of pretreatment temperature and the Mo amount in the catalyst. The Mo coverage facilitated the formation of small iron particles and stabilized these nano iron particles during the FTS reaction. Meanwhile it disfavored the reduction of hematite into α-Fe during the activation step and caused a strong Fe–Mo interaction particularly at high Mo amount. The strong Fe–Mo interaction weakened the activation of CO molecule on active Fe sites, which primarily accounts for the decline in the intrinsic activity (TOFCO) of active Fe sites.Conflicts of interest
There are no conflicts to declare.Acknowledgements
We thank the National Outstanding Young Scientists Foundation of China (20625620) and the National Natural Science Foundation of China (20703054 and 20590361). This work is also supported by Synfuels China Co., Ltd.References
- G. P. Van Der Laan and A. Beenackers, Catal. Rev.: Sci. Eng., 1999, 41, 255–318 CAS.
- H. Schulz, Appl. Catal., A, 1999, 186, 3–12 CrossRef CAS.
- H. Jahangiri, J. Bennett, P. Mahjoubi, K. Wilson and S. Gu, RSC Adv., 2015, 5, 2210–2229 Search PubMed.
- O. O. James, B. Chowdhury, M. A. Mesubi and S. Maity, RSC Adv., 2012, 2, 7347–7366 RSC.
- Y. Zhang, M. Ding, L. Ma, T. Wang and X. Li, RSC Adv., 2015, 5, 58727–58733 RSC.
- Y. Zhang, L. Ma, T. Wang and X. Li, RSC Adv., 2015, 5, 45426–45430 RSC.
- Y. Yang, H. W. Xiang, Y. Y. Xu, L. Bai and Y. W. Li, Appl. Catal., A, 2004, 266, 181–194 CrossRef CAS.
- C. H. Zhang, Y. Yang, B. T. Teng, T. Z. Li, H. Y. Zheng, H. W. Xiang and Y. W. Li, J. Catal., 2006, 237, 405–415 CrossRef CAS.
- Y. Liu, J.-F. Chen and Y. Zhang, RSC Adv., 2015, 5, 29002–29007 RSC.
- J. Wu, L. Qin, C. Wang, B. Lv, L. Wang, J. Chen and Y. Xu, RSC Adv., 2016, 6, 38356–38364 RSC.
- M. Qing, Y. Yang, B. S. Wu, J. Xu, C. H. Zhang, P. Gao and Y. W. Li, J. Catal., 2011, 279, 111–122 CrossRef CAS.
- H. M. T. Galvis, A. C. J. Koeken, J. H. Bitter, T. Davidian, M. Ruitenbeek, A. Iulian Dugulan and K. P. de Jong, J. Catal., 2013, 303, 22–30 CrossRef.
- C. F. Huo, B. S. Wu, P. Gao, Y. Yang, Y. W. Li and H. Jiao, Angew. Chem., Int. Ed., 2011, 50, 7403–7406 CrossRef CAS PubMed.
- X. Chen, D. Deng, X. Pan, Y. Hu and X. Bao, Chem. Commun., 2015, 51, 217–220 RSC.
- M. D. Shroff, D. S. Kalakkad, K. E. Coulter, S. D. Kohler, M. S. Harrington, N. B. Jackson, A. G. Sault and A. K. Datye, J. Catal., 1995, 156, 185–207 CrossRef CAS.
- E. de Smita and B. M. Weckhuysen, Chem. Soc. Rev., 2008, 37, 2758–2781 RSC.
- G. S. Ranhotra, A. T. Bell and J. A. Reimer, J. Catal., 1987, 108, 40–49 CrossRef CAS.
- S. T. Liu, A. C. Gujar, P. Thomas, H. Toghiani and M. G. White, Appl. Catal., A, 2009, 357, 18–25 CrossRef CAS.
- W. P. Ma, E. L. Kugler, J. Wright and D. B. Dadyburjor, Energy Fuels, 2006, 20, 2299–2307 CrossRef CAS.
- W. P. Ma, E. L. Kugler and D. B. Dadyburjor, Stud. Surf. Sci. Catal., 2007, 163, 125–140 CrossRef CAS.
- N. Lohitharn, J. G. Goodwin Jr and E. Lotero, J. Catal., 2008, 255, 104–113 CrossRef CAS.
- S. D. Qin, C. H. Zhang, J. Xu, B. S. Wu, H. W. Xiang and Y. W. Li, J. Mol. Catal. A: Chem., 2009, 304, 128–134 CrossRef CAS.
- R. M. M. Abbaslou, J. Soltan and A. K. Dalai, Fuel, 2011, 90, 1139–1144 CrossRef.
- S. D. Qin, C. H. Zhang, J. Xu, Y. Yang, H. W. Xiang and Y. W. Li, Appl. Catal., A, 2011, 392, 118–126 CrossRef CAS.
- X. Cui, J. Xu, C. H. Zhang, Y. Yang, P. Gao, B. Wu and Y. W. Li, J. Catal., 2011, 282, 35–46 CrossRef CAS.
- W. P. Ma, E. L. Kugler and D. B. Dadyburjor, Energy Fuels, 2010, 24, 4099–4110 CrossRef CAS.
- J. Y. Shen, T. Matsuzaki, T. Hanaoka, K. Takeuchi and Y. Sugi, Catal. Lett., 1994, 28, 329–336 CrossRef CAS.
- E. Guglielminotti, E. Giamello, F. Pinna, G. Strukul, S. Martinengo and L. Zanderighi, J. Catal., 1994, 146, 422–436 CrossRef CAS.
- P. Reyes, J. Fernández, I. Concha and G. Pecchi, Catal. Lett., 1995, 34, 331–341 CrossRef CAS.
- J. Y. Park, Y. J. Lee, P. K. Khanna, K. W. Jun, J. W. Bae and Y. H. Kim, J. Mol. Catal. A: Chem., 2010, 323, 84–90 CrossRef CAS.
- O. F. Oyerinde, C. L. Weeks, A. D. Anbar and T. G. Spiro, Inorg. Chim. Acta, 2008, 361, 1000–1007 CrossRef CAS.
- D. L. A. de Faria, S. V. Silva and M. T. de Oliveira, J. Raman Spectrosc., 1997, 28, 873–878 CrossRef CAS.
- C. G. Hill Jr and J. H. Wilson III, J. Mol. Catal., 1990, 63, 65–94 CrossRef.
- G. Mestl and T. K. K. Srinivasan, Catal. Rev.: Sci. Eng., 1998, 40, 451–570 CAS.
- C. Li, J. Catal., 2003, 216, 203–212 CrossRef CAS.
- H. J. Tian, C. A. Roberts and I. E. Wachs, J. Phys. Chem. C, 2010, 114, 14110–14120 CAS.
- K. V. R. Chary, K. R. Reddy, G. Kishan, J. W. Niemantsverdriet and G. Mestl, J. Catal., 2004, 226, 283–291 CrossRef CAS.
- A. Christodoulakis, E. Heracleous, A. A. Lemonidou and S. Boghosian, J. Catal., 2006, 242, 16–25 CrossRef CAS.
- Z. Li, Y. Fu, M. Jiang, T. Hu, T. Liu and Y. Xie, J. Catal., 2001, 199, 155–161 CrossRef CAS.
- D. S. Kim, K. Segawa, T. Soeya and I. E. Wachs, J. Catal., 1992, 136, 539–553 CrossRef CAS.
- J. Leyrer, Surf. Sci., 1988, 201, 603–623 CrossRef CAS.
- H. G. Wendlandt and O. Glemser, Angew. Chem., 1963, 75, 949–957 CrossRef CAS.
- O. Glemser and R. V. Haeseler, Z. Anorg. Allg. Chem., 1962, 316, 168–181 CrossRef CAS.
- J. Leyrer, M. I. Zaki and H. Knözinger, J. Phys. Chem., 1986, 90, 4775–4780 CrossRef CAS.
- K. V. R. Chary, K. R. Reddy, G. Kishan, J. W. Niemantsverdriet and G. Mestl, J. Catal., 2004, 226, 283–291 CrossRef CAS.
- A. Christodoulakis, E. Heracleous, A. A. Lemonidou and S. Boghosian, J. Catal., 2006, 242, 16–25 CrossRef CAS.
- J. Wang, W. Li, C. Yu, Y. Chen and Y. Zhang, React. Kinet. Catal. Lett., 1997, 62, 217–224 CrossRef CAS.
- M. Jiang, N. Koizumi and M. Yamada, J. Phys. Chem. B, 2000, 104, 7636–7643 CrossRef CAS.
- E. Boellaard, A. M. van de Kraan and J. W. Geus, Appl. Catal., A, 1996, 147, 207–227 CrossRef CAS.
- G. Blyholder, J. Phys. Chem., 1964, 68, 2772–2777 CrossRef CAS.
Footnote |
| † Electronic supplementary information (ESI) available. See DOI: 10.1039/c7ra07338k |
| This journal is © The Royal Society of Chemistry 2017 |