 Open Access Article
Pore-scale simulation of wettability and interfacial tension effects on flooding process for enhanced oil recovery
Jin Zhao a and
Dongsheng Wen*ba
aSchool of Chemical and Process Engineering, University of Leeds, Leeds, LS2 9JT, UK. E-mail: d.wen@leeds.ac.uk
bSchool of Aeronautic Science and Engineering, Beihang University, 100191, Beijing, P. R. China. E-mail: d.wen@buaa.edu.cn
First published on 24th August 2017
Abstract
For enhanced oil recovery (EOR) applications, the oil/water flow characteristics during the flooding process was numerically investigated with the volume-of-fluid method at the pore scale. A two-dimensional pore throat-body connecting structure was established, and four scenarios were simulated in this paper. For oil-saturated pores, the wettability effect on the flooding process was studied; for oil-unsaturated pores, three effects were modelled to investigate the oil/water phase flow behaviors, namely the wettability effect, the interfacial tension (IFT) effect, and the combined wettability/IFT effect. The results show that oil saturated pores with the water-wet state can lead to 25–40% more oil recovery than with the oil-wet state, and the remaining oil mainly stays in the near wall region of the pore bodies for oil-wet saturated pores. For oil-unsaturated pores, the wettability effects on the flooding process can help oil to detach from the pore walls. By decreasing the oil/water interfacial tension and altering the wettability from oil-wet to water-wet state, the remaining oil recovery rate can be enhanced successfully. The wettability-IFT combined effect shows better EOR potential compared with decreasing the interfacial tension alone under the oil-wet condition. The simulation results in this work are consistent with previous experimental and molecular dynamics simulation conclusions. The combination effect of the IFT reducation and wettability alteration can become an important recovery mechanism in future studies for nanoparticles, surfactant, and nanoparticle–surfactant hybrid flooding process.
1. Introduction
Current global demand for fuel such as oil is still high, which encourages oil and gas industries to improve their efforts in finding new sources, developing new techniques and maximizing the recovery of their current resources. Enhanced oil recovery (EOR) is a tertiary technique to enhance oil recovery, which has been continuously developed and improved in the last few decades. The importance of improving oil production efficiency by EOR is highly acknowledged because in many of the world's reservoirs, about two thirds of the original oil in place cannot be recovered by conventional methods.1 As a new and advanced technology, nanotechnology has the potential to increase oil recovery rate. However, the mechanisms of nano-EOR method are still unclear. Understanding the wettability and interfacial tension effects on the water/oil phase flow interaction in microscopic reservoir pores is essential.Nanofluid technology, as a part of nanotechnology, is a new interdisciplinary area of great importance where nanoscience, nanotechnology, and thermal engineering come across. It has developed largely over the past decade and revealed its potential applications in oil and gas industries. Previous observation from lab-scale experiments and molecular scale simulation reported that nanoparticles may alter the reservoir fluid composition and rock-fluid properties to assist in mobilizing trapped oil, which suggests a new mechanism and a new application prospect of nanoparticles for enhanced oil recovery. Wasan and Nikolov2 have experimentally investigated the wetting behaviour of nanofluids and proved that the wetting behaviour changes if the liquid contained nanoparticles. This investigation has been further reported by Kondiparty3 that the disjoining pressure gradient helped the spreading of the wetting film and the separation of oil droplets from the solid surface. Because the spreading of liquids on solid substrates is of interest to many practical applications and industrial processes, the dynamic motion of three-phase triple lines in the presence of nanoparticles was studied both in experimental investigations and theoretical work.4 Actually, the dynamics of contact line is decided by the driven force due to the out of balance surface tension force, the adhesion force between solid and liquid phase and the resistant force due to viscosity.5 Recently, Wang et al.6 found that the local volume concentration plays a significant role on the shape of the nanofluids/oil interface. Large nanoparticle concentration may enhance the effect of the disjoining pressure on the spreading of the nanofluid film. Wang et al.7,8 further observed a significant enhancement in the oil removal efficiency using nanofluids. Moreover, when the charge on each particle exceeds a threshold value, the oil droplet could detach from the solid surface spontaneously and completely. However, the above mechanism has been always debated by some researchers. Contradictory experimental results have been reported regarding the effect of nanoparticles on EOR, for instance, Hendraningrat et al.9 showed that the maximum oil recovery was increased by 14.29% of OOIP by using nanofluid; Hu et al.10 reported that the best total cumulative recovery occurred with a total oil recovery of 41.8% of OOIP; whereas Bayat et al.11 observed only a 2% increase over OOIP for tertiary oil recovery using the same nanofluid.
Three methods have been used previously for studying the flooding process for enhanced oil recovery, which is experimental, molecular dynamics simulation and computational fluid dynamics simulation. For the experimental method, previous experiments mainly focus on the core-scale (or lab-scale) flooding process. Different nanoparticles and surfactants were added into a displacing fluid to investigate their transport breakthrough curve, pressure drop and oil recovery rate.12–15 The disadvantage of core-scale experiments lies on the limited in situ observation of multiphase flow in the core. Nano-scale multiphase modelling has also been conducted by molecular dynamic methods.16 It mainly brings some significant results for the mechanism insights. However, the high cost of molecular dynamics simulation method leads to the difficulty of simulating the multiphase flow characteristics in realistic level due to both the length scale and time scale limitation. For the numerical simulation method, previous computational fluid dynamics simulations mostly focus on study of multiphase flow in the connecting micro-channels of core plugs or microfluidic systems.17–19 The interaction of fluid flows from the crossing channel systems brings huge obstacles to focus on the insight description of the immiscible multiphase flow interaction mechanism.
In this paper, the pore-scale flooding processes for both oil-saturated and oil-unsaturated pores were investigated with the volume of fluid method for enhanced oil recovery. A single pore body/throat connecting channel was established to investigate the wettability and interfacial tension effects on the water/oil flow interaction in pore scale. The results can provide some insights into the basic understanding of the nanoparticles, surfactant, and nanoparticles–surfactant hybrid flooding process for enhanced oil recovery.
2. Numerical methods
2.1 Governing equations
The oil/water two phase flow of oil and water in this simulation is described by the incompressible Navier–Stokes equations:
 | (1) |
2.2 Volume-of-fluid method
The volume of fluid (VOF) method is adopted to describe oil/water two phase flow. The volume fraction equation is used for tracking the interface between multiple phases:
 | (2) |
 | (3) |
The fluid properties at the interface are given by:  , which are averaged volume fraction for an n-phase system.
The continuum surface force (CSF) model20 is used to calculate the curvature of the interface and volume surface tension. In the CSF model, the volume surface force has the following form: Fvol = σκ∇αi, where σ is the interfacial tension, and κ is the curvature which is defined as: κ = ∇·n, where n is the unit normal vector of the interface,  , where nw is the unit vector normal to the walls, τw is the unit vector tangential to the walls, and θw is the static contact angle at the wall where the contact angle in the angle at which a primary liquid interface meets a solid surface. If it is small, the liquid drop will spread on the wall surface; if it is large, a liquid drop will bead up. The finite-volume based the CFD code FLUENT is used to solve the Navier–Stokes equations numerically.
3. Physical model
3.1 Pore geometry
Based on the previous experimental measurement,21,22 a two-dimensional pore body-throat connecting channel is proposed with the aspect ratio of 7![[thin space (1/6-em)]](https://www.rsc.org/images/entities/char_2009.gif) :
:![[thin space (1/6-em)]](https://www.rsc.org/images/entities/char_2009.gif) 1 as a standard case, as shown in Fig. 1. The radius of the connecting pore throats rthroat is 2.5 μm, and the radius of the circular pore rbody is 17.5 μm. The connections between pore bodies and throats are optimised with a curve of radius do = 2.5 μm. The side length L of the pore-throat connecting channel is 175 μm. The shadow region refers to the solid reservoir rock. The flooding fluid flows from the left inlet to displace the oil phase outside from the pore geometry, until flushing out from the right outlet. Due to the scale of the pore channels, the gravity effect is neglected in this work.
1 as a standard case, as shown in Fig. 1. The radius of the connecting pore throats rthroat is 2.5 μm, and the radius of the circular pore rbody is 17.5 μm. The connections between pore bodies and throats are optimised with a curve of radius do = 2.5 μm. The side length L of the pore-throat connecting channel is 175 μm. The shadow region refers to the solid reservoir rock. The flooding fluid flows from the left inlet to displace the oil phase outside from the pore geometry, until flushing out from the right outlet. Due to the scale of the pore channels, the gravity effect is neglected in this work.
3.2 Fluid properties
Constant fluid properties are assumed in our pore-scale simulation work, and no heat transfer occurs between the two phase flows and pore walls. According to the typical oil-recovery applications, assuming the invading fluid (e.g., water) viscosity of 0.001 Pa s and a typical oil viscosity of 0.01 Pa s,23 the ratio of μw/μo for the standard case is set to ten. Both the density of the core fluid and displacing fluid are set as 1000 kg m−3.24 The standard oil/water interfacial tension with a value of 52 mN m−1 is taken from the ref. 19. To investigate the interfacial effect on the flooding process for oil unsaturated pore, an ultralow oil/water IFT value of 52 μm m−1 was used, which can be obtained by the surfactant assistant practically.3.3 Initial and boundary conditions
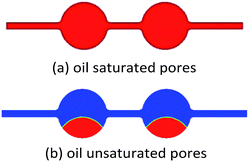
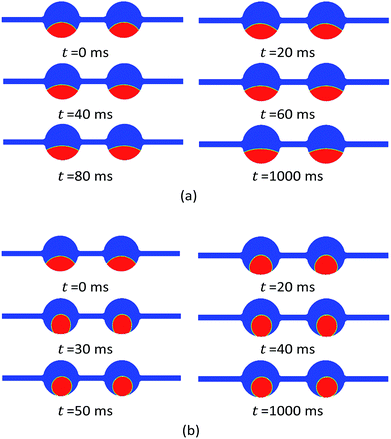
Four scenarios were simulated in this paper: For oil-saturated pores, the wettability effect on the flooding process was studied; For oil-unsaturated pores, three effects were modelled to investigate the oil/water phase flow behaviors for enhanced oil recovery, which were respectively the wettability effect, the IFT effect, and the combined wettability/IFT effect. The initial oil/water phase distribution for both the oil saturated and unsaturated pores is shown in Fig. 2. The red part represents the oil phase, while the blue part represents the water phase.For oil saturated pores, one-hundred percentage of the initial oil volume fraction was established; the water contact angle varied from 0° to 180° was simulated to present different wettability states of the pore rocks. For oil unsaturated pores, an initial wettability state was set with an initial oil volume fraction of 19.298%. Different ultimate constant water contact angle varied from 0° to 150° was set to simulate the flooding process when the wettability alters. It is notable that, this initial oil volume fraction of 19.298% can be reasonably considered as a proper value for this single-pore channel investigation, whose value is different to the average remaining oil volume fraction in the overall oil field before EOR, but can lead to an easier visualization of the contact angle when studying the wettability effect as an oil droplet size. Besides, to focus on the wettability and interfacial effects on the flooding process for enhanced oil recovery, the injecting velocity of the invading fluid was kept the same at 0.005 m s−1.
4. Results and discussion
4.1 Grid independency and numerical verification
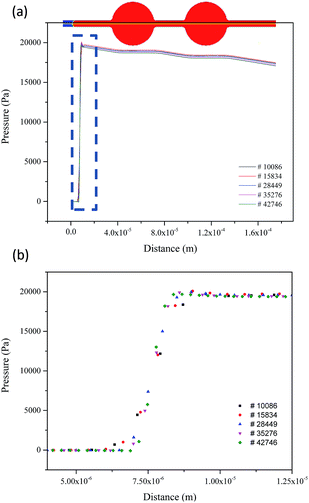
Grid-refinement studies are performed to ensure that the computed profiles and the time evolution of the fluid–fluid interface are grid independent. The rectangular grid is used for simulation in this study, generated by the meshing code ICEM CFD. Initially, a grid independence study is performed in a water-wet system originally saturated with oil. To keep the Courant number at a small value for a stable velocity field calculation, a time-step evolution of 1 ns was used in this work. Fig. 3 shows the water/oil distributions at the time of 1.0 ms in the displacement process at different mesh resolutions. The oil/water distributions are nearly the same, and the difference is mainly at the water/oil interface. The higher the resolution, the sharper the interface is. Based on the grid sensitivity test results, the differences of the predicted pressure drop among the five grid systems are separately 9.74%, 6.04%, 3.68%, 0.46%, and 0.28%. Therefore, considering both computational accuracy and efficiency, grid independent solution is revealed to be the fourth mesh system with 35![[thin space (1/6-em)]](https://www.rsc.org/images/entities/char_2009.gif) 276 computational grids. From the comparison, it could be seen that the capillary pressure from the simulation satisfies the Laplace theory quite well.
276 computational grids. From the comparison, it could be seen that the capillary pressure from the simulation satisfies the Laplace theory quite well.
4.2 Grid independency and numerical verification
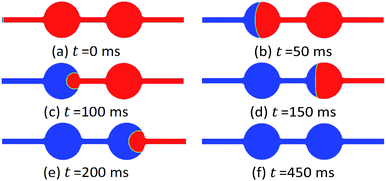
Different reservoir rocks have widely different wetting characteristics. The degree of wettability can vary even within a single reservoir.25 In this section, the water flooding process for an initial oil-saturated pore was simulated under the different wettability conditions. Seven cases were studied to simulate the flow characteristic and oil recovery factor, which water contact angle was 0°, 30°, 60°, 90°, 120°, 150°, 180°, respectively.Fig. 4 shows the oil/water phase distribution evolution with time under the completely oil-wet state (water contact angle θ = 180°) with water flooding. It can be observed that water firstly flows from the inlet to the pore throat, pushing the initial saturated oil out from the outlet. Most oil in the pore throat part is flushed out before water flows into the pore body, though small amounts of oil sticking onto the rock walls due to the strongly oil-wet condition. After the water flow flooding from the first pore body to the second pore throat, partial oil phase is remaining near the walls with the concave meniscus shape corresponding to the water flow streamline. The multiphase flow transport characteristics repeat in the next following pore throat and body structures until water breakthrough occurs.
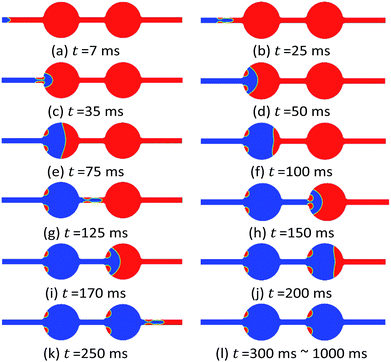
The intermediate state (water contact angle θ = 90°) between water-wet and oil-wet was illustrated for the water flooding process in Fig. 5. Differing from the flow characteristics under the completely water-wet state above, two convex meniscus of oil form in the pore throat when water flows through the pore throat due to the contact angle, which has also been observed previously with experiments by Zhang et al.26 While the water continues flowing from the first pore throat into the first pore body, the two convex oil meniscus is growing big, flowing forward, and finally settling at the pore-body wall close to the connecting site. Besides these two oil meniscus remaining in the first pore body, the initial oil inside the first pore body is completely recovered as the invading fluid flooding by. The same flow characteristics repeat in the following pore throat/body structures. As the fifth and sixth oil meniscus is flooded away from the pore outlet, only four symmetrical oil meniscus remains inside the pore after a long-term flooding.
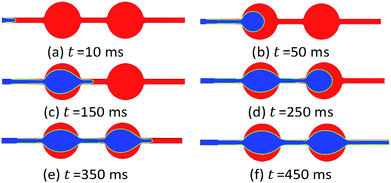
For an initial oil-saturated pore with completely water-wet state, the water flooding process can be observed from Fig. 6. An ideal and stable flow situation occurs during the flooding process, with a one-hundred percent of oil recovery factor after the invading fluid flowing out from the outlet.
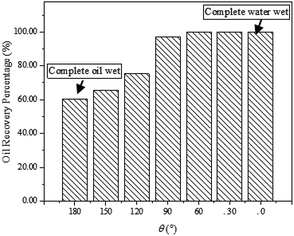
The detail oil recovery factor results after the water flooding of the seven wettability scenario (water contact angle is 0°, 30°, 60°, 90°, 120°, 150°, 180°) are concluded in Fig. 7. It can be seen that the oil recovery factor turns out to be between 60% and 75% under the oil-wet state (water contact angle larger than 90°). As the pore wettability convert from the oil-wet state to the intermediate state, the oil recovery factor increases as high as 96%. As long as under the water-wet condition (water contact angle smaller than 90°), a one-hundred percent of oil recovery factor can be obtained, with no oil phase remaining in the pore structure after the flooding process.
Three main ideas can be concluded from the above numerical results: (i) after the primary oil recovery, the remaining oil mostly stays in the near-wall region of the pore body; (ii) the water-wet state is beneficial for obtaining an ideal oil recovery results; (iii) for enhanced oil recovery, if the wettability can be altered from the original oil-wet state to the water-wet state, a higher EOR factor may be obtained. As mentioned in the introduction section, nanoparticle colloids have been proved to possess the capability of altering the wettability between the oil/water phases and pore walls.2 Based on this idea, six cases with different initial and final wettability were simulated in the next section to symbolize the wettability effects on the flooding process for enhanced oil recovery.
4.3 The wettability effect on the flooding process in oil unsaturated pores
The wettability effects on the flooding process have been modelled in the initial oil-unsaturated model for enhanced oil recovery. With different initial and final wettability of the pore system, the flow characteristic of the flooding process with wettability alterations can be simulated. Practically, the wettability alteration can be realized by the assistant of nanoparticles, which has been proved by previous molecular simulation for its capacity of altering the wettability between the two-phase flow and the rock walls.6 Different nanoparticle materials, concentration, and other factors can lead to different ultimate wettability.7,8A random wettability was used as an initial state, as shown in Fig. 2(b). Six ultimate wettability was set to symbolize the nanoparticle effects on the wettability changing, which ultimate water contact angle is 0°, 30°, 60°, 90°, 120°, 150°, respectively. Hereinto, it is notable that the wettability is the only variable, which means the viscosity of the invading fluid and the interfacial tension between water and oil keep at the same value.
Taking two cases as examples, with an ultimate wettability of 90° and 0°, the flooding process of the oil/water phase distribution evolution via time is shown in Fig. 8. It can be observed that the settling shape of the oil phase changes along with time for both cases. However, the oil settling position is keeping still during the displacement. After a long-term flooding, no oil phase comes out from the pore outlet. Even for the completely water-wet ultimate state, though the completely water-wet state leads to the oil detachment from the pore walls, the oil recovery factor still remains at a zero percent after a long-term flooding process.
The final oil/water phase distribution of the six cases is compared in Fig. 9, where ultimate water contact angle is 0°, 30°, 60°, 90°, 120°, 150°, respectively. The similar wettability effect on the oil detaching from pore walls have been also found by Wang et al.7,8 with molecular dynamics simulation method, as shown in Fig. 9. However, according to our numerical simulation results, the oil recovery factor still remains at a zero percent after a long-term flooding process for all cases. The final EOR factor turns out to be zero percent though the wettability alteration.
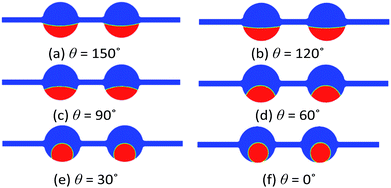 | ||
| Fig. 9 Final phase distribution at different wettability alteration state (contact angle from 150° to 0°). | ||
For having an insight of the detailed flow characteristics, the streamline of the invading fluid for the wettability alteration from initial random state to the completely water-wet state with 0° ultimate contact angle is shown in Fig. 10. It can be seen that after a long-term displacement, the invading fluid mainly forms two flow regimes: one is the stable laminar-like flow flowing bypass the oil droplet from the inlet to the outlet; the other is the vortex-like flow occurring at both the left and right side of the oil droplet.
 | ||
| Fig. 10 The streamline of the invading fluid for the wettability alteration to the completely water-wet state. | ||
Above analysis on the numerical results can contribute to a conclusion that, altering the wettability from oil-wet to water-wet state can contribute to the oil detachment from pore walls, but cannot lead to an ideal EOR condition due to the capillary effect. This finding is not only consistent with the molecular dynamics simulation results of Wang et al.,6 who claimed that the wettability effect on the oil detachment; but also consistent with the experimental results of Bayat et al.,11 who demonstrated that no obvious EOR factor increasing had been observed with nanofluid flooding, with only a 2% increase. The trapped oil droplet can be explained by the capillary effect theory. The concept of capillary number Ca has been used as a dimensionless value to characterize the ratio of viscous forces to surface or interfacial tension forces between two immiscible liquids with an equation of Ca = uin·μ/σ, where uin is the fluid velocity, μ is fluid viscosity and σ is the interfacial tension between oil and water. The average capillary number Ca of these six cases is calculated to be 1.78 × 10⁻⁵, similar to the case where capillary effects play a dominant role on the trapped oil with Ca at a level of 10−5.27 To investigate the capillary effects on this flooding process, the wettability/IFT combined effect was studied in the next section.
4.4 The wettability/IFT combined effect on the flooding process in unsaturated pores
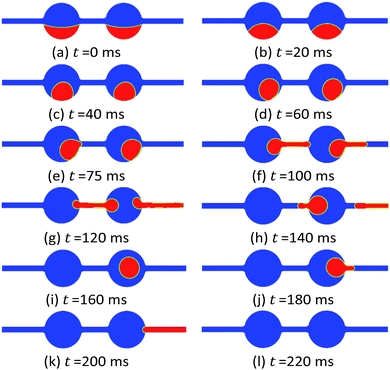
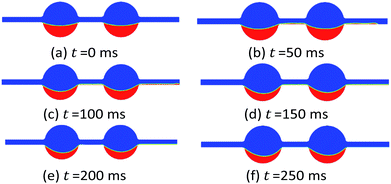
Besides the wettability alteration from completely oil-wet to water-wet state, the interfacial tension between water and oil phase was also decreased from 52 mN m−1 to 52 μN m−1 in this scenario. Practically, this IFT decreasing can be realized by adding surfactants into the invading fluid to obtain an ultralow IFT state. Therefore, this scenario can reflect the wettability/IFT combined effect on the flooding process for EOR.For the initial completely oil-wet case, with the same injecting velocity of the invading fluid, the oil/water phase distribution along the time evolution is shown in Fig. 11. At the early stage of flooding, the remaining oil settling state gradually changes from the completely oil-wet of sticking-wall state to the water-wet of droplet-like state. Differing from the case in the last section, both of the oil droplets move forward from the pore body to the next pore throat with the invading fluid together, instead of staying still inside of the pore body. Due to the converted water-wet state, oil would not stick onto the pore walls during the flooding process. After a long-term flooding, all oil phase is displaced outside of the pore geometry. The enhanced oil recovery factor reaches to one hundred percent.
The only difference between this scenario and the one in the last section, is the interfacial tension decreasing between water and oil. The average capillary number Ca of this cases is calculated to be 1.78 × 10⁻², which is much higher than the capillary-effect dominant range. The remaining oil turns out to be not trapped inside the pore bodies any more, but be stably displaced outside of pores. The streamline of the invading fluid during the displacing period is shown in Fig. 12. It can be observed that two vortexes appear at the left upper and lower area of each pore body. The left lower vortexes can also be observed in the “wettability-effect only” flooding case. But the appearance of the other two vortexes are focused on the left upper stream side, which lead to the imbalance drive to push the oil droplet moving forward.
Since the wettability-alone effect and the wettability/IFT combined effect had been investigated, the IFT-alone effect on the flooding process was simulated in the next section.
4.5 The interfacial tension (IFT) effect on the flooding process in unsaturated pores
For comparison, the IFT-alone effect on the flooding process was simulated in this section, which IFT was decreased from 52 mN m−1 to 52 μN m−1. The whole displacement was conducted under the completely oil-wet state, which water contact angle is 180°.The phase distributions along the time evolution is shown in Fig. 13. It can be observed that, the settling position of the convex oil meniscus remains still during the displacement due to the oil-wet condition. However, due to the low oil/water IFT, a thin surface region of oil phase is gradually moving forward with the invading fluid and adjoining to the pore walls all the time, until flowing out from the pore outlet. After a long-term displacement, the interface between oil and water is too low to go through into the next pore throat. Finally, partial oil phase is trapped inside of the pore structure.
To have an insight flow characteristic during the flooding process, Fig. 14 shows the streamline of the invading fluid at the time of 100 ms. It can be seen that the vortex flow appears at the upper region inside of each pore body. Due to the completely oil-wet condition, the displacing fluid cannot invade between the oil phases and pore walls, which was previously explained as the disjoining pressure effect. Though the IFT is low enough to resist the capillary effects, an ideal oil recovery factor still cannot be obtained due to the oil attachment, which is caused by the wettability effects.
4.6 Comprehensive comparison of the EOR factor for the wettability and IFT effects on flooding process in unsaturated pores
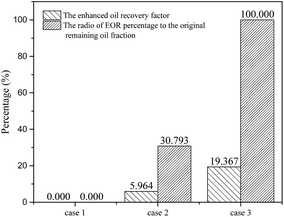
Fig. 15 is shown in this section to compare the wettability and interfacial tension effects on the EOR factor for the flooding process in initial oil-wet unsaturated pores. For all the three cases, the initial oil volume faction is all 19.367%. It can be seen that: (i) for wettability-alone effects (case 1), the oil recovery factor turns out to be zero percent; (ii) for IFT-alone effects (case 2), the enhanced oil accounts for 30.793% of the initial oil saturation; (iii) for the wettability/capillary combination effects (case 3), all the oil is displaced out of the pore structure with no remaining, which contribute to a factor of one hundred percentage.This results can give an idea to the following conclusions: (i) altering the wettability from oil-wet to water-wet state can contribute to the oil detachment from pore walls; (ii) the oil detachment from pore walls may not lead to the oil recovery enhancement due to the capillary effect; the lower capillary number can result in the oil phase trapping inside of pores; (iii) decreasing the interfacial tension between oil and water alone, can enhance partial oil phase out of pore structures, but still lead to the oil remaining due to the oil-wet state; (iv) both the wettability and capillary effect are significant for enhanced oil recovery. Only with both water-wettability alteration and low capillary effects, an ideal EOR result can be obtained.
5. Conclusions
The effects of wettability and capillary effects were simulated numerically at single pore scale in this paper. The results can be concluded as followed:(1) Water-wet state has significantly positive effects on oil recovery at pore scale in oil saturated pores;
(2) For enhanced oil recovery, the water-wet wettability can contribute to the detachment of the oil phase from pore walls, which however may not lead to oil recovery enhancement due to the capillary effect;
(3) Decreasing the interfacial tension between oil and water alone can enhance partial oil phase out of pore structures, but make few effects on the oil detachment from pore walls;
(4) Both the wettability and capillary effect are significant for enhanced oil recovery. A good combination of both water-wettability alteration and a low capillary effect can lead to an ideal EOR result.
The simulation results in this work are consistent with previous experimental and MD simulation conclusions, and can present an explanation of the nanofluid, surfactant, and nanofluid–surfactant hybrid flooding flow mechanism regarding to wettability and interfacial tension effects for enhanced oil recovery. Generally, only with both water-wet state and low capillary effects, can an ideal EOR result be obtained.
Conflicts of interest
There are no conflicts of interest to declare.Acknowledgements
This work was supported by European Research Council Consolidator Grant (Grant Number: 648375).References
- C. Matteo, P. Candido, R. Vera and V. Francesca, Am. J. Appl. Sci., 2012, 9(6), 784–793 CrossRef CAS.
- D. Wasan and A. Nikolov, Nature, 2003, 423, 156–159 CrossRef CAS PubMed.
- K. Kondiparty, A. Nikolov, S. Wu and D. Wasan, Langmuir, 2011, 27(7), 3324–3335 CrossRef CAS PubMed.
- K. Sefiane, J. Skilling and J. MacGillivray, Adv. Colloid Interface Sci., 2008, 138(2), 101–120 CrossRef CAS PubMed.
- S. Vafaei and D. Wen, Microfluid. Nanofluid., 2010, 8(6), 843–848 CrossRef CAS.
- F. Wang and H. Wu, Theor. Appl. Mech. Lett., 2013, 3(5), 054006 CrossRef.
- F. Wang and H. Wu, Soft Matter, 2013, 9(33), 7974–7980 RSC.
- F. Wang and Y. Zhao, Colloid Polym. Sci., 2013, 291(2), 307–315 CAS.
- L. Hendraningrat, S. Li and O. Torsaeter, J. Pet. Sci. Eng., 2013, 111, 128–138 CrossRef CAS.
- Z. Hu, S. Azmi, G. Raza, P. Glover and D. Wen, Energy Fuels, 2016, 30(4), 2791–2804 CrossRef CAS.
- A. Bayat, R. Junin, A. Samsuri, A. Piroozian and M. Hokmabadi, Energy Fuels, 2014, 28, 6255–6266 CrossRef.
- L. Yan, T. Yin, W. Yu, L. Shen, M. Lv and Z. Ye, RSC Adv., 2015, 5, 42843–42847 RSC.
- B. Peng, L. Zhang, J. Luo, P. Wang, B. Ding, M. Zeng and Z. Cheng, RSC Adv., 2017, 7, 32246–32254 RSC.
- S. Gou, S. Luo, T. Liu, H. Xia, D. Jing, Q. Zhang, S. Li, Z. Li and Q. Guo, RSC Adv., 2015, 5, 85165–85173 RSC.
- Z. Hu, J. Zhao, H. Gao, E. Nourafkan and D. Wen, Energies, 2017, 10(8), 1151 CrossRef.
- M. Kunieda, Y. Liang, Y. Fukunaka, T. Matsuoka and K. Takamura, Energy Fuels, 2012, 26(5), 2736–2741 CrossRef CAS.
- A. Afsharpoor, M. Balhoff, R. Bonnecaze and C. Huh, J. Pet. Sci. Eng., 2012, 94–95, 79–88 CrossRef CAS.
- T. Clemens, K. Tsikouris, M. Buchgraber, L. Castanier and A. Kovscek, SPE Reserviour Evaluation & Engineering, 2013, 2, 144–154 Search PubMed.
- M. Lv and S. Wang, RSC Adv., 2015, 5, 85373–85382 RSC.
- J. Brackbill, D. Kothe and C. Zemach, J. Comput. Phys., 1992, 100(2), 335–354 CrossRef CAS.
- W. Camp, AAPG Bull., 2011, 95(8), 1443–1447 CrossRef.
- E. Coalson, S. Goolsby and M. Franklin, Subtle Seals and Fluid-flow Barriers in Carbonate Rocks, Rocky Mountain Association of Geologists, 1994, vol. 1, pp. 45–49 Search PubMed.
- F. White and I. Corfield, Viscous Fluid Flow, 2006, vol. 3 Search PubMed.
- W. Deng, PhD thesis, Iowa State University, 2010.
- A. Skauge, K. Spildo, L. Hoiland and B. Vik, J. Pet. Sci. Eng., 2007, 57(3), 321–333 CrossRef CAS.
- H. Zhang, A. Nikolov and D. Wasan, Langmuir, 2014, 30(31), 9430 CrossRef CAS PubMed.
- J. Sheng, Asia-Pac. J. Chem. Eng., 2015, 10(3), 400–410 CrossRef CAS.
| This journal is © The Royal Society of Chemistry 2017 |


