DOI:
10.1039/C7RA07315A
(Paper)
RSC Adv., 2017,
7, 49361-49367
Green aqueous biphasic systems containing deep eutectic solvents and sodium salts for the extraction of protein†
Received
3rd July 2017
, Accepted 16th September 2017
First published on 23rd October 2017
Abstract
Deep eutectic solvents (DESs), a new type of green solvents, were applied for the extraction of proteins with aqueous biphasic systems (ABSs) in this study. The structures of the prepared DES were confirmed by FT-IR and 1H NMR. The DES–salt (NaH2PO4/Na2CO3/Na3C6H5O7)-based ABSs were established and applied to extract the bovine serum albumin and papain. DES–Na2CO3 ABS was selected as the suitable extraction system. Single-factor experiments were investigated to achieve complete extraction by properly tailoring the concentration of different compositions (e.g. proteins, Na2CO3, DES), the temperature and pH values. The experimental results indicated that the extraction efficiency could reach up to 95.16% for bovine serum albumin and 90.95% for papain under the optimum conditions. UV-vis spectra, fluorescence spectra and CD spectra were investigated to confirm that the conformation of bovine serum albumin did not change after extraction. The transmission electron microscopy (TEM) was used to explore the mechanism of the extraction. All of these results indicated that DES-based ABSs may provide a new possibility for the separation of proteins.
Introduction
Aqueous biphasic systems (ABSs), pioneered by Albertson,1 are formed by two immiscible water-rich phases based on polymer–polymer interaction under a critical concentration and temperature. It can be proposed as a possible alternative for protein extraction due to their advantages such as operational cost, tunable composition, technological simplicity and mild conditions.2 Owing to their water-rich environment, ABSs process fulfill the requisites regarding green chemistry principles and gain potential for the research of industrial applications.3–5 Therefore, ABSs have been proved to be a versatile and significant technique for the purification and separation of diverse targets, namely carbon nanotubes,6–8 alkaloids,9,10 antibiotics,11–13 amino acids14–16 and proteins.17–19 Proteins are essential units of organisms, and they play important roles in cell metabolism. Therefore, the study of extraction and separation of proteins is of great significance.
The most commonly used ABSs for the extraction of proteins are composed of two polymers, particularly ionic liquids (IL). In 2003, the so-called green solvents have been reported to displace organic compounds from organic phase and have attracted much attention in the formation of ABS due to their negligible volatility, non-flammability, excellent thermal and chemical stabilities, large liquid range and wide structural diversity.20 However, the synthesis process of common IL are complex and expensive; also they are difficult to purify. In addition, several of these IL (e.g. imidazolium- and pyridinium-based IL) are highly toxic and poorly biodegradable.21–23 These disadvantages limit their development and large-scale industrial applications. Thus, the research for a cheaper and greener substitute while taking advantage of their benefits is still an imperative issue.
Deep eutectic solvents (DESs) are classified as a new type of IL or IL analog because of their similarity in physical properties with IL.24,25 It is a eutectic mixture synthesized by mixing hydrogen bond acceptors (e.g. quaternary ammonium, phosphonium salts, etc.) and hydrogen bond donors (e.g. amides, alcohols, acids, etc.).26,27 Choline chloride (ChCl), one of the most widespread quaternary ammonium salts, is often utilized to synthesize DESs.26 Indeed, ChCl-based DESs not only share the common advantages such as negligible volatility, non-flammability, excellent thermal and chemical stabilities but also show excellent biodegradability and low toxicity. Owing to the outstanding properties, scientific interest for ChCl-based DESs have increased in the past few years,28,29 with applications in many fields such as desulfurization,30–32 biomass,33,34 extraction35–37 and electrochemistry.38,39 Based on these advantages, ChCl-based DESs have emerged as promising solvents to be used in ABSs. Xu et al. synthesized four types of ChCl–polyol-based DESs and applied them to extract bovine serum albumin with ABSs.40 Li et al. explored ChCl-based DESs (ChCl–urea, ChCl–methylurea, etc.) and investigated the extraction efficiency of bovine serum albumin.18 Some researchers have already focused on the DES-based ABSs; yet there is plenty of room for development.
In this study, ChCl-based DESs were prepared and characterized and converted to ABSs using salt solutions (e.g. NaH2PO4, Na2CO3 and Na3C6H5O7). Among them, DES–Na2CO3 was selected to investigate the extraction of protein (bovine serum albumin and papain) and identify the optimal conditions. UV-vis spectra, fluorescence spectra, CD spectra and TEM were used to study the mechanisms during the extraction process.
Experimental
Reagents and apparatus
Polyethylene glycol 2000 (PEG), choline chloride (ChCl, purity 98.0–101.0%), NaH2PO4 (purity ≥ 99.0%), Na2CO3 (purity ≥ 99.8%), Na3C6H5O7 (purity ≥ 99.0%), bovine serum albumin and papain were all purchased from Sinopharm Chemical Reagent Co., Ltd. PEG and ChCl were dried under vacuum before use.
Materials were dried in the DZF-6051 vacuum drying oven (Shanghai, China). Deep eutectic solvents were heated in the IKA RET basic safety control-type magnetic stirrer. The H1650 Cence high-speed centrifuge was utilized to speed up the phase separation. Ultraviolet spectrum of the protein solution was measured using the UV2450 UV-vis spectrophotometer (Shimadzu, Japan). Infrared spectrum of DESs was recorded on the Spectrum One FT-IR spectrometer (Nicolet Nexus 470). The secondary structure of protein was determined using the Mos-500 circular dichroism (CD) spectrometer. The microstructure of the sample was examined using the JEM-3010 transmission electron microscope (TEM, Hitachi H-700, Japan).
Preparation and characterization of DES
In this study, ChCl-based DES was prepared by stirring two compounds, ChCl and PEG (molar ratio of 20![[thin space (1/6-em)]](https://www.rsc.org/images/entities/char_2009.gif) :1, according to the freezing point), at 110 °C until a homogeneous colourless liquid was formed. Detailed data are summarized in Tables S1 and S2.† This ChCl–PEG was abbreviated as DES. The structures were confirmed by FT-IR and 1H NMR.
:1, according to the freezing point), at 110 °C until a homogeneous colourless liquid was formed. Detailed data are summarized in Tables S1 and S2.† This ChCl–PEG was abbreviated as DES. The structures were confirmed by FT-IR and 1H NMR.
Phase diagrams
Binodal curves, which illustrate the binding between the homogeneous and biphasic regions, were determined at atmospheric pressure and 298 K by the cloud point method.41 First, a certain amount of DES was weighed in a colorimetric tube. Following this, the saturated salt solutions were added dropwise until detecting a cloudy solution. Then ultrapure water was added dropwise until a clear, limpid solution corresponding to the monophasic regime was formed. The mass was recorded after each addition and the above process was repeated until sufficient data were obtained to determine the phase diagram. The entire procedure was carried out under constant stirring and the curves were determined gravimetrically within ±10−4 g.
Extraction of proteins: bovine serum albumin and papain
The extraction of proteins using DES-based ABSs was carried out in graduated glass centrifuge tubes containing appropriate amounts of each salt, DES and an aqueous solution containing protein. After completely mixing all the components to a given mixture composition, each system was centrifuged at 2000 rpm for 10 min and then, each tube was placed in a thermostatic bath at 298 K for at least 30 min. Then the two phases became clear and transparent, the volume of each phase was measured, and the concentration of the protein in both phases was detected using a UV-vis spectrophotometer. The linear calibration curves for bovine serum albumin and papain obtained in the range of 0–1 mg mL−1 were A = 0.6318C + 0.0022 (R2 = 1, λ = 278 nm) and A = 0.2877C − 0.0012 (R2 = 0.9998, λ = 278 nm), respectively, where C is the concentration of proteins (g L−1) and A is the UV absorbance.
The extraction efficiency (E) was calculated using the following eqn (1):
| |
 | (1) |
where
Ct and
Cb are the concentrations of the proteins in the DES-rich top phase and salt-rich bottom phase, respectively.
Vt and
Vb represent the volume of the top phase and the bottom phase, respectively.
Results and discussion
Characterization of DES
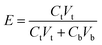
FT-IR spectra of the ChCl, PEG and DES are shown in Fig. 1(a). The band at 3016 cm−1 corresponds to the –CH3 stretching modes, which were clearly found in both ChCl and DES; the absorption bands at 960 cm−1 and 950 cm−1 can be attributed to the C–O stretching vibration of PEG and DES. Red-shift of the peaks in DES indicated that a more stable H-bond was formed.30 The main characteristic peaks of ChCl and PEG could be observed in the FT-IR spectrum of DES, which identified that functional groups of the reactant were stable when the reaction was proceeding. To further confirm the interactions between ChCl and PEG, 1H NMR of ChCl, PEG and DES were obtained as shown in Fig. 1(b). The H peak (8.24 ppm) of the PEG and DES exhibited the same shift, which indicated that the charge density of the proton remained unchanged while the reaction was proceeding. Moreover, the H peak (5.594 ppm) of ChCl shifted to a lower value (5.53 ppm). This phenomenon suggested that the hydrogen bond of the DES was formed between ChCl and PEG.30
 |
| | Fig. 1 (a) FT-IR spectra of DES, PEG and ChCl. (b) 1H NMR of ChCl, PEG and DES (DMSO-d6 as solvent). | |
Phase behaviour
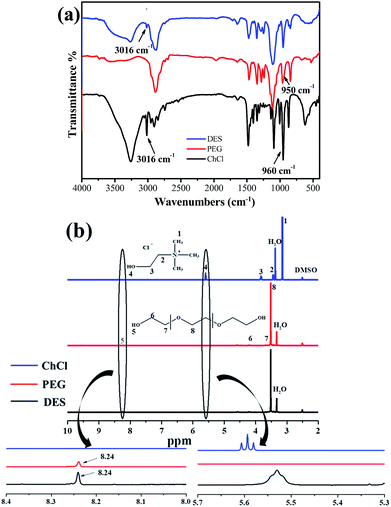
The binodal curves determined at 298 K for the ABS composed of DES–salt (NaH2PO4, Na2CO3 and Na3C6H5O7) are plotted in Fig. 2. The binodal data of the ABSs are summarized in detail in Table S3.† It is well known that closer the binodal curve of DES–salt to the origin of the coordinate axis, the stronger is the phase forming ability of the salts. The salts promoted the formation of ABS in the order: Na2CO3 > Na3C6H5O7 > NaH2PO4. Therefore, DES–Na2CO3 ABS was chosen for the subsequent study.
 |
| | Fig. 2 Binodal curves for the DES + salt (NaH2PO4, Na2CO3, Na3C6H5O7) + H2O systems at 298 K. (w1: mass fraction of DES in the total system; w2: mass fraction of salt in the total system). | |
Selection of extraction system
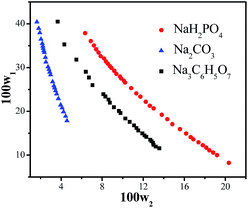
The extraction efficiencies of the proteins for the three systems were investigated under the same conditions and the results are shown in Fig. 3. The results clearly indicated that 72.36–87.97% of the proteins could be extracted in the DES-rich phase by a single-step extraction procedure, and the extraction efficiency of the systems decreased in the order: Na2CO3 > Na3C6H5O7 > NaH2PO4, which was similar to the order of phase-forming ability. Therefore, DES–Na2CO3 ABS was evaluated for the study of the extraction process. Moreover, the pH values of ABS were also measured and the results obtained are as follows: DES–Na2CO3 ABS (pH = 12.83), DES–Na3C6H5O7 ABS (pH = 8.74) and DES–NaH2PO4 ABS (pH = 3.44). Therefore, the pH also played a significant role in the extraction procedure.
 |
| | Fig. 3 Extraction efficiency of bovine serum albumin (BSA) and papain (PAP) in ABSs composed of: C(DES) = 0.64 g mL−1, C(salt) = 0.12 g mL−1, C(protein) = 0.03 g L−1, T = 298 K, unadjusted pH values. | |
For convenient and rapid screening of the extraction ability of DES–Na2CO3 ABS, bovine serum albumin and papain were chosen as representative examples for carrying out the ABS extraction method. The concentration of proteins, DES and Na2CO3 as well as the temperature and pH values related to extraction efficiency were considered. All extraction efficiencies were calculated in the same manner as described in the UV-vis method.
Effect of the concentration of protein
To investigate the concentration of protein on the influence of extraction efficiency, DES (0.64 g mL−1)–Na2CO3 (0.12 g mL−1) ABS was adopted and the results are illustrated in Fig. 4a. It was clear that the extraction efficiency increased with the increasing concentration of bovine serum albumin solution between 0.012 g L−1 and 0.03 g L−1; when the concentration of papain was higher than 0.03 g L−1, the extraction efficiency decreased gradually. In addition, the experimental results of papain extraction showed a similar tendency. The explanation for this phenomenon is that, when the concentration of protein was more than 0.03 g mL−1, the DES-rich top phase reached the saturated state and there was no more space for protein, which led to an increase in the amount of protein in the bottom phase. Therefore, the optimum concentration of both proteins was 0.03 g L−1.
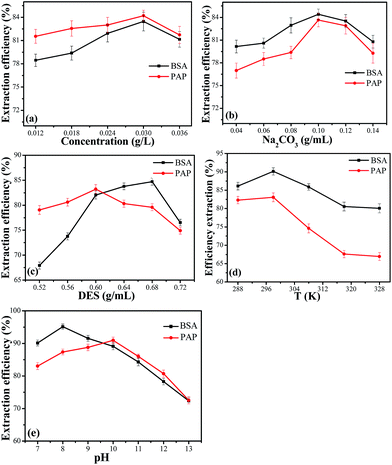 |
| | Fig. 4 Effect of the concentration of bovine serum albumin (BSA) and papain (PAP) (a), concentration of Na2CO3 (b), concentration of DES (c), temperature (d) and pH values (e) on the extraction efficiency in DES–Na2CO3 ABS. | |
Effect of the concentration of Na2CO3
In order to discuss the effect of the concentration of Na2CO3 on the extraction efficiency, DES (0.64 g mL−1)–Na2CO3 ABS was employed. As indicated in Fig. 4b, the extraction efficiency was affected as the salt concentration ranged from 0.04 g mL−1 to 0.14 g mL−1. With the increase in salt concentration, the hydrophobicity of the bottom phase increased. Therefore, the proteins were salted out from the bottom phase and transferred into the top phase. However, the extraction efficiency was decreased when the salt concentration reached 0.1 g mL−1. A further increase in salt concentration resulted in a decrease in the water content of the top phase and the proteins were inclined to enter the bottom phase. Therefore, a salt concentration of 0.1 g mL−1 was selected to continue the next experiment.
Effect of the concentration of DES
As an example, the effect of the concentration of DES on protein extraction was studied. In addition, the results are illustrated in Fig. 4c. The extraction efficiency of bovine serum albumin increased when the concentration of DES varied from 0.52 g mL−1 to 0.68 g mL−1, and with a further increase in the concentration of DES, the extraction efficiency decreased. The explanation for the increase was that the DES and protein could form aggregates in the top phase, and hence, more bovine serum albumin molecules would be aggregated by more DES micelles.40 When the DES concentration was further increased, there would be no more space in the top phase, which led to a decrease in the extraction efficiency. The extraction efficiency of papain also had the same tendency. Therefore, a DES concentration of 0.68 g mL−1 for bovine serum albumin and 0.6 g mL−1 for papain were selected in the subsequent experiments.
Effect of the temperature
The influence of temperature on the extraction efficiency of bovine serum albumin and papain was also investigated. The line graph (Fig. 4d) shows that the extraction efficiency of bovine serum albumin and papain both increased clearly when the temperature was below 298 K. However, the efficiency of both decreased gradually after reaching the peak value at 298 K. The possible reason for this phenomenon was that the viscosity of DES decreased with the increase in temperature, which enhanced the diffusion ability of proteins. However, a continuous increase in temperature could inhibit the interaction between the amino acid residue and the surface water of protein, which was unfavourable for protein extraction.41 Furthermore, as the temperature increased, the ABS tended to be homogeneous.
Effect of pH
The electrostatic interaction played an important role in the separation and purification of proteins. DES–Na2CO3 ABS could not form two phases at a pH below 6.0. Therefore, the pH range of 7.0–13.0 was chosen in this study. As can be seen from Fig. 4e, the extraction efficiency of bovine serum albumin and papain increased with the increase in pH value and then decreased gradually. The charged state of proteins was influenced by the pH values. Therefore, it was suggested that electrostatic interactions between the charged groups in the protein and the DES was a significant factor for the extraction of proteins. The obtained maximum extraction efficiency of bovine serum albumin was 95.16%, which was higher than other ABSs; the comparative results are listed in Table 1.
Table 1 Comparison of the BSA extraction performance of ABSs with that of other reported systemsa
| ABSs |
Target |
E (%) |
Reference |
| ABSs: aqueous biphasic systems; E: extraction efficiency; IL: ionic liquid; DES: deep eutectic solution; BSA: bovine serum albumin. |
| [Omim][Br]–K2HPO4 |
BSA |
90.5 |
42 |
| [DMEA][Pr]–K2HPO4 |
BSA |
99.5 |
43 |
| Choline-like IL–K2HPO4 |
BSA |
92.03–100.03% |
44 |
| Guanidinium IL–K2CO3 |
BSA |
97.05 |
45 |
| DES–K2HPO4 |
BSA |
98.16 |
40 |
| DES–Na2CO3 |
BSA |
95.16 |
This study |
After the single factor experiments were completed, the optimum extraction conditions were as follows: DES (0.68 g mL−1)/Na2CO3 (0.1 g mL−1)/bovine serum albumin (0.03 g L−1)/298 K/pH = 8 and DES (0.6 g mL−1)/Na2CO3 (0.1 g mL−1)/papain (0.03 g L−1)/298 K/pH = 10.
Back-extraction of protein
It is well known that back-extraction is of great importance for the application of the prepared ABSs. Taking into account the optimal condition, the ABS consisted of DES (0.68 g mL−1)/Na2CO3 (0.1 g mL−1), which was favorable for back-extraction. DES phase (1 mL), after extraction, was added into new centrifuge tubes. Then, different concentrations of (NH4)2SO4 and 0.45 mL ethanol were added to form new ABSs. The results for back-extraction efficiency using the new ABSs are listed in Table 2. The back-extraction efficiency increased at first and decreased later with the increase in (NH4)2SO4 concentration. Bovine serum albumin weighing 34.35% could be re-extracted into the salt-rich phase when the concentration of (NH4)2SO4 was 0.16 g mL−1.
Table 2 Back-extraction efficiency of ABSs with different salt concentrations
| C/g mL |
0.12 |
0.14 |
0.16 |
0.18 |
0.2 |
| Vt/mL |
1.3 |
1.2 |
1.1 |
1 |
1 |
| E% |
20.70 |
26.85 |
34.35 |
27.60 |
21.30 |
UV-vis spectroscopy and fluorescence spectra
In order to examine the confirmation of protein before and after extraction, UV-vis and fluorescence spectra were investigated. Fig. 5a illustrates the UV-vis spectra of bovine serum albumin in pure water and in DES-rich phase after extraction. It is clear that the curves appeared similar in shape and the maximum absorption peak after extraction still appeared at 278 nm. Fig. 5b shows the fluorescence emission spectra for bovine serum albumin in the presence of DES at λex = 287 nm; the characteristic peaks of bovine serum albumin in water and in DES-rich solution both appeared at 344 nm. In addition, the excitation spectra at λem = 344 nm followed the similar trend. This indicated that there were no chemical interactions between the bovine serum albumin and DES in the extraction process. Hence, we tentatively concluded that the DES-based ABSs provided a gentle environment for bovine serum albumin.
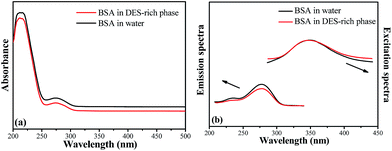 |
| | Fig. 5 UV-vis spectra (a) and fluorescence spectra (b) of bovine serum albumin (BSA) before and after extraction. | |
Circular dichroism (CD) spectra
Circular dichroism (CD) is a valuable technique for defining the secondary structure of proteins because many conformational motifs of protein exhibit characteristic far-ultraviolet CD spectra. Bovine serum albumin solution of 0.3 mg mL−1 has been selected to perform the experiment and the scanned range of CD spectra was 195–250 nm. The response time was 1 s and the optical path was 10 mm. The α-helix structure of the protein showed a positive ellipticity at 192 nm and a double-negative ellipticity at 208 and 222 nm. Fig. 6 shows that the CD spectra of bovine serum albumin in DES phase were similar to that in aqueous solution. In general, the results indicated that the secondary structures of bovine serum albumin in our study did not change after extraction.
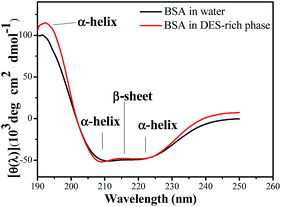 |
| | Fig. 6 CD spectra of bovine serum albumin (BSA) before and after extraction. | |
Transmission electron microscope
Transmission electron microscope (TEM) was a significant tool to detect the microstructure of the sample. In this study, TEM was used to characterize the morphology of BSA before and after extraction. Fig. 7a and b show the morphology of BSA particles before and after extraction. The images displayed that the DES aggregate–protein complex had a size of almost 200 nm when the BSA was extracted in the top phase. It was clear that protein–DES aggregates were formed after extraction. That is to say, the protein and DES-aggregates were attracted to each other. It can be inferred that the aggregation was the driving force in the process of protein extraction by the DES-based ABS.
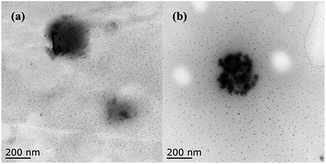 |
| | Fig. 7 TEM images of the aggregates for BSA (5.0 mg mL−1) and DES (0.5 g mL−1) + BSA (5.0 mg mL−1). (a) BSA and (b) DES + BSA. | |
Conclusions
Choline chloride–polyethylene glycol, defined as DES, was prepared, characterized and established as aqueous biphasic systems (ABSs) using three different salts (NaH2PO4, Na2CO3 and Na3C6H5O7, respectively). DES–Na2CO3 ABS was used to extract bovine serum albumin and papain through single-factor experiments and the back-extraction experiment was carried out using a certain amount of ethanol. Mechanism study suggested that no degeneration of protein was observed during the extracted process and the aggregation phenomenon played a significant role in the separation process. The advantage of DES such as being green, biodegradable and having no reaction with protein combined with the high extraction efficiency of bovine serum albumin (95.16%) and papain (90.95%) collectively highlighted the advantages of the designed method of DES-based ABSs for the extraction of protein. Moreover, the systems would have potential applications in bio-separation.
Conflicts of interest
There are no conflicts to declare.
Acknowledgements
This study was financially supported by the National Nature Science Foundation of China (No. 21506083, 21376111, 21576122), Scientific Research Foundation of Jiangsu University for the Senior Personnel (No. 15JDG176), Doctoral Innovation Fund of Jiangsu Province (KYLX16_0915).
Notes and references
- P. A. Albertsson, Partition of cell particles and macromolecules, J. Wiley, 1960 Search PubMed.
- E. V. Capela, M. V. Quental, P. Domingues, J. A. P. Coutinho and M. G. Freire, Green Chem., 2017, 19, 1850 RSC.
- C. E. de Araujo Padilha, P. V. Fortunato Dantas, F. C. Sousa Junior, S. D. Oliveira Junior, C. d. C. Nogueira, D. F. de Santana Souza, J. A. de Oliveira, G. R. de Macedo and E. S. dos Santos, Sep. Purif. Technol., 2017, 176, 306 CrossRef.
- S. Noshadi and R. Sadeghi, J. Phys. Chem. B, 2017, 121, 2650 CrossRef CAS PubMed.
- M. H. Hadzir, S. Abbasiliasi, A. B. Ariff, S. B. Yusoff, H. S. Ng and J. S. Tan, RSC Adv., 2016, 6, 82571 RSC.
- N. K. Subbaiyan, S. Cambre, A. N. G. Parra-Vasquez, E. H. Haroz, S. K. Doorn and J. G. Duque, ACS Nano, 2014, 8, 1619 CrossRef CAS PubMed.
- J. A. Fagan, C. Y. Khripin, C. A. S. Batista, J. R. Simpson, E. H. Haroz, A. R. H. Walker and M. Zheng, Adv. Mater., 2014, 26, 2800 CrossRef CAS PubMed.
- G. Ao, C. Y. Khripin and M. Zheng, J. Am. Chem. Soc., 2014, 136, 10383 CrossRef CAS PubMed.
- J. Flieger and A. Czajkowska-Zelazko, Food Chem., 2015, 166, 150 CrossRef CAS PubMed.
- J. F. B. Pereira, A. Magri, M. V. Quental, M. Gonzalez-Miquel, M. G. Freire and J. A. P. Coutinho, ACS Sustainable Chem. Eng., 2016, 4, 1512 CrossRef CAS.
- Y. Lu, H. Yao, C. Li, J. Han, Z. Tan and Y. Yan, Food Chem., 2016, 192, 163 CrossRef CAS PubMed.
- S. Shahriari, L. C. Tome, J. M. M. Araujo, L. P. N. Rebelo, J. A. P. Coutinho, I. M. Marrucho and M. G. Freire, RSC Adv., 2013, 3, 1835 RSC.
- T. Yao and S. Yao, J. Chromatogr. A, 2017, 1481, 12 CrossRef CAS PubMed.
- Y. B. Xie, H. B. Xing, Q. W. Yang, Z. B. Bao, B. G. Su and Q. L. Ren, ACS Sustainable Chem. Eng., 2015, 3, 3365 CrossRef CAS.
- Z. J. Tan, F. F. Li, C. C. Zhao, Y. B. Teng and Y. F. Liu, Sep. Purif. Technol., 2017, 172, 382 CrossRef CAS.
- C. P. Li, Z. Li, A. L. Wang, J. M. Yin, J. Wang, H. X. Li and Q. S. Liu, RSC Adv., 2013, 3, 6356 RSC.
- H. M. Zhang, Y. Z. Wang, Y. G. Zhou, K. J. Xu, N. Li, Q. Wen and Q. Yang, Talanta, 2017, 170, 266 CrossRef CAS PubMed.
- Q. Zeng, Y. Wang, Y. H. Huang, X. Q. Ding, J. Chen and K. J. Xu, Analyst, 2014, 139, 2565 RSC.
- H. M. Zhang, Y. Z. Wang, K. J. Xu, N. Li, Q. Wen, Q. Yang and Y. G. Zhou, Anal. Methods, 2016, 8, 8196 RSC.
- K. E. Gutowski, G. A. Broker, H. D. Willauer, J. G. Huddleston, R. P. Swatloski, J. D. Holbrey and R. D. Rogers, J. Am. Chem. Soc., 2003, 125, 6632 CrossRef CAS PubMed.
- N. Gathergood, M. T. Garcia and P. J. Scammells, Green Chem., 2004, 6, 166 RSC.
- J. R. Harjani, R. D. Singer, M. T. Garciac and P. J. Scammells, Green Chem., 2009, 11, 83 RSC.
- J. R. Harjani, J. Farrell, M. T. Garcia, R. D. Singer and P. J. Scammells, Green Chem., 2009, 11, 821 RSC.
- M. Zhang, W. S. Zhu, H. M. Li, S. H. Xun, W. J. Ding, J. J. Liu, Z. Zhao and Q. Wang, Chem. Eng. J., 2014, 243, 386 CrossRef CAS.
- W. H. Yao, H. Y. Wang, G. K. Cui, Z. Y. Li, A. L. Zhu, S. J. Zhang and J. J. Wang, Angew. Chem., Int. Ed., 2016, 55, 7934 CrossRef CAS PubMed.
- A. P. Abbott, G. Capper, D. L. Davies, R. K. Rasheed and V. Tambyrajah, Chem. Commun., 2003, 9, 70 RSC.
- A. P. Abbott, D. Boothby, G. Capper, D. L. Davies and R. K. Rasheed, J. Am. Chem. Soc., 2004, 126, 9142 CrossRef CAS PubMed.
- N. Lopez-Salas, D. Carriazo, M. C. Gutierrez, M. L. Ferrer, C. O. Ania, F. Rubio, A. Tamayo, J. L. G. Fierro and F. del Monte, J. Mater. Chem. A, 2016, 4, 9146 CAS.
- T. J. Trivedi, J. H. Lee, H. J. Lee, Y. K. Jeong and J. W. Choi, Green Chem., 2016, 18, 2834 RSC.
- W. S. Zhu, C. Wang, H. P. Li, P. W. Wu, S. H. Xun, W. Jiang, Z. G. Chen, Z. Zhao and H. M. Li, Green Chem., 2015, 17, 2464 RSC.
- W. Jiang, H. P. Li, C. Wang, W. Liu, T. Guo, H. Liu, W. S. Zhu and H. M. Li, Energy Fuels, 2016, 30, 8164 CrossRef CAS.
- H. P. Li, Y. H. Chang, W. S. Zhu, C. W. Wang, C. Wang, S. Yin, M. Zhang and H. M. Li, Phys. Chem. Chem. Phys., 2015, 17, 28729 RSC.
- K. D. Vigier, G. Chatel and F. Jerome, Chemcatchem, 2015, 7, 1250 CrossRef CAS.
- L. Gu, W. Huang, S. K. Tang, S. J. Tian and X. W. Zhang, Chem. Eng. J., 2015, 259, 647 CrossRef CAS.
- M. C. Ali, Q. W. Yang, A. A. Fine, W. B. Jin, Z. G. Zhang, H. B. Xing and Q. L. Ren, Green Chem., 2016, 18, 157 RSC.
- Y. Zhang, Z. Y. Li, H. Y. Wang, X. P. Xuan and J. J. Wang, Sep. Purif. Technol., 2016, 163, 310 CrossRef CAS.
- K. J. Xu, Y. Z. Wang, Y. Li, Y. Lin, H. M. Zhang and Y. G. Zhou, Anal. Chim. Acta, 2016, 946, 64 CrossRef CAS PubMed.
- H. Chen, Q. Y. Ye, X. L. He, J. J. Ding, Y. Z. Zhang, J. F. Han, J. Liu, C. Liao, J. Mei and W. M. Lau, Green Chem., 2014, 16, 3841 RSC.
- M. H. Chakrabarti, N. S. A. Manan, N. P. Brandon, R. C. Maher, F. S. Mjalli, I. M. AlNashef, S. A. Hajimolana, M. A. Hashim, M. A. Hussain and D. Nir, Chem. Eng. J., 2015, 274, 213 CrossRef CAS.
- K. J. Xu, Y. Z. Wang, Y. H. Huang, N. Li and Q. Wen, Anal. Chim. Acta, 2015, 864, 9 CrossRef CAS PubMed.
- A. Chakraborty and K. Sen, J. Chromatogr. A, 2016, 1433, 41 CrossRef CAS PubMed.
- X. Lin, Y. Z. Wang, Q. Zeng, X. Q. Ding and J. Chen, Analyst, 2013, 138, 6445 RSC.
- J. Chen, Y. Z. Wang, Q. Zeng, X. Q. Ding and Y. Z. Huang, Anal. Methods, 2014, 6, 4067 RSC.
- S. Y. Huang, Y. Z. Wang, Y. G. Zhou, L. Li, Q. Zeng and X. Q. Ding, Anal. Methods, 2013, 5, 3395 RSC.
- X. Q. Ding, Y. Wang, Q. Zeng, J. Chen, Y. H. Huang and K. J. Xu, Anal. Chim. Acta, 2014, 815, 22 CrossRef CAS PubMed.
Footnote |
| † Electronic supplementary information (ESI) available. See DOI: 10.1039/c7ra07315a |
|
| This journal is © The Royal Society of Chemistry 2017 |
Click here to see how this site uses Cookies. View our privacy policy here. 
 Open Access Article
 This Open Access Article is licensed under a Creative Commons Attribution-Non Commercial 3.0 Unported Licence
 *b,
Guangying Chenc,
Changri Hanc,
Wenshuai Zhu
*b,
Guangying Chenc,
Changri Hanc,
Wenshuai Zhu


