 Open Access Article
Creative Commons Attribution 3.0 Unported Licence
Numerical study of the effect of wall temperature profiles on the premixed methane–air flame dynamics in a narrow channel
Xin
Kang
 *ab,
Rowan J.
Gollan
b,
Peter A.
Jacobs
b and
Ananthanarayanan
Veeraragavan
 b
b
aSchool of Energy and Power Engineering, Wuhan University of Technology, Wuhan, People’s Republic of China. E-mail: flyingmercury@hotmail.com; Tel: +86 27 8658 1992
bSchool of Mechanical & Mining Engineering, The University of Queensland, Brisbane, Australia
First published on 16th August 2017
Abstract
Time-accurate simulations of premixed CH4/air flame in a narrow, heated channel are performed using the DRM-19 reaction mechanism. The effect of different wall temperature profiles on the flame dynamics is investigated for three different inflow velocity conditions. At a low inflow velocity of 0.2 m s−1, the flame shows instabilities in the form of spatial oscillations and even flame extinction. With the increase of the inflow velocity, flames are prone to showing more stability at a medium inflow velocity of 0.4 m s−1, and eventually show flame stabilisation at a high inflow velocity condition of 0.8 m s−1 for all the wall temperature profiles examined. The total chemical heat release rate and total gas–solid heat exchange rate are found to have a combined effect on the flame propagation speed that determines flame behaviours. Since the flame behaviours in terms of the oscillation frequency and amplitude for spatially oscillating flames, or the stream-wise stabilisation location for steady-state flames, are very sensitive to the chosen wall temperature profile, a “real” conjugate heat transfer model is recommended in order to capture all of the relevant combustion physics accurately.
1. Introduction
Combustion in narrow channels where the characteristic dimensions are of the order of the flame thickness is termed microscale (dimension < 1 mm) or mesoscale (dimension close to the flame thickness) combustion.1 This technology is considered as a promising replacement of traditional electrochemical batteries, owing to its considerably higher energy density (45 vs. 0.6 MJ kg−1) and instant rechargeability.2 On the other hand, combustion at such small scales has also encountered challenging issues such as large combustor surface heat losses and short flow residence times, which can potentially lead to flame instabilities and flame extinction.1 In the past two decades, a strong research impetus has been placed in this field in order to comprehensively understand the fundamental aspects and tackle the challenges identified, which can be found in comprehensive review articles.1,3Past work on experimental micro/mesoscale combustion revealed a range of interesting flame features such as flame repetitive extinction and ignition (FREI)4 and various unstable flame patterns,5 demonstrated the enhancement of flame stability limits6–9 and combustion efficiency,10,11 as well as developed prototype devices for micro-power generation.12,13 However, experimental works have inherent difficulties in obtaining spatially resolved measurements at small scales. Similarly, the results of analytical models which are used to understand the underlying micro-combustor physics regarding heat recirculation14,15 can only be interpreted in a qualitative sense since the models use several simplifications and assumptions in order to develop a closed-form solution.
On the other hand, numerical models which do not make analytical-like assumptions are capable of making quantitatively accurate predictions of experimental observations. Therefore, they could serve as a reliable design tool for micro-combustors. Some past numerical simulations using a steady-state model have been conducted, with a focus on the flame stability.16,17 These simulations, that utilised a steady-state solver, were not capable of capturing transient flame dynamics, which is also important and should be understood for a practical system. Other studies used time-accurate models, e.g. the studies by Pizza et al.,18 Alipoor et al.,19 Nair et al.,20 and Jiménez et al.21 for H2/air, and Nakamura et al.,22 Miyata et al.,23 and Kang et al.24 for CH4/air, to capture the flame dynamics involving various modes of flame stability and instability.
Most of the transient numerical studies in the literature used a simplified set-up that only simulated the gas-phase combustion (they did not take into account the heat conduction in solid walls). Some studies21 were carried out with adiabatic walls that removed the gas–solid heat transfer. However, the heat losses from the micro-combustor surface do play an important role in flame behaviours as mentioned earlier.25,26 Singh et al.27,28 and Aravind et al.29 recently studied the effect of wall thermal boundary conditions on flame dynamics. A change of flame shapes was observed for the various wall boundary conditions applied (adiabatic, different values of the convective heat transfer coefficient, and isothermal). A more commonly used approach is to fix the wall temperature to mimic the heat loss and heat recirculation via wall conduction, although the particular wall temperature profile can be different.18–20,22,23,30–32 In this paper, the authors are interested in investigating the influence of the selection of wall temperature profiles on the micro-flame behaviours. A deeper insight into the underlying physics of the flame propagation is provided. Importantly, we want check the appropriateness of using such a simplified treatment of the wall boundary conditions to mimic the “real” conjugate heat transfer problem.
2. Numerical approach
The premixed CH4/air flame propagation in the planar two-dimensional micro-channel is numerically studied using our in-house code Eilmer33 for transient, compressible flows. Validation work of the model for simulating the flame structure in a 12 mm wide channel was reported in our previous article.24Fig. 1 shows the computational domain for the numerical model in this paper. The channel length (L) is 6 mm and the channel height (H) is 0.6 mm, which forms a length-to-height aspect ratio of L/H = 10.
A cell-centred, finite volume method is employed for the discretisation of the governing compressible Navier–Stokes equations, which are given in our previous articles.24,33 The solver uses operator splitting to sequentially update the flow properties due to fluid dynamics (inviscid and viscous fluxes) and changes due to chemistry (combustion reactions). For the fluid dynamics computation, the cell-centred variables of pressure, temperature, velocity components, and species mass fractions are reconstructed using the piece-wise parabolic method (PPM) at cell interfaces. Other flow quantities such as density and internal energy are then calculated from the thermochemical model. Based on the reconstructed values, the AUSM+-up flux calculator,34 which has specifically been formulated to maintain accuracy at all speed regimes for compressible flow, is used to compute the inviscid fluxes. The reconstructed values of velocity and temperature at the cell interfaces are also used to compute the spatial derivatives at the centre of secondary cells (defined as the volume surrounding a primary cell vertex) using Gauss’s divergence theorem. Next, the vertex-computed derivatives are averaged to obtain a mid-face viscous flux (stress and heat flux). Finally, a quasi-steady-state ODE solver is used for the finite rate chemistry implementation to determine the chemical production/loss rate. Time-accurate and numerically stable solutions are obtained by using the explicit three-stage Runge–Kutta time-marching scheme and setting the Courant–Friedrichs–Lewy (CFL) number to 0.45 to choose the simulation time step (on the order of 10−9 s). The details of these solver numerics can be found in ref. 33.
The evaluation of thermodynamic and transport properties for the component species used curve fits collated by McBride and Gordon35 for their NASA CEA program. The state for the gas mixture was then calculated based on a mass fraction weighted sum of individual species for thermodynamic properties using Wilke’s mixing rule36 for transport properties. Fick’s law, using mixture-averaged diffusion coefficients calculated based on kinetic theory,37 was implemented to evaluate the species mass diffusion. A correction for calculated fluxes was performed to numerically guarantee total mass conservation (i.e. to meet the requirement of the diffusion mass fluxes summing to zero).38 The mixture-averaged diffusion model has been demonstrated to be sufficiently accurate to predict the laminar burning velocity of premixed methane/air flame compared to the full multicomponent diffusion model.39 The Soret effect was not taken into account, since the error in burning velocities by neglecting this effect was only around 2% for CH4/air flame as reported by Bongers et al.39
The simulations used 19-species and 84-reaction methane/air chemical kinetics (DRM-19).40 As a subset of full GRI-Mech chemistry,41 this truncated mechanism DRM-19 is able to save computational costs and has also been proven to provide accurate modelling of heat release and ignition delay against experimental data.42 Moreover, the atmospheric laminar flame speeds calculated using this mechanism were in very good agreement with both those using the full GRI-Mech scheme and with experimental results.43 Therefore, DRM-19 is considered to be able to closely reproduce the main physical features of transient flames.
The boundary conditions (BCs) were set as follows: the inlet of the combustor was modelled using a mass flux boundary condition in which the gas total temperature (T0 = 300 K), the mass fractions of the incoming species, and a uniform mass flux (ṁ′′) across the boundary were specified. At the outlet, the pressure was set to atmospheric pressure while zero Neumann boundary conditions were imposed for the rest of the variables. Past studies have found that the use of a domain extension joining the combustor outlet does not affect the flame behaviours including the flame stabilisation and flame oscillations.44 Therefore, the outflow boundary truncation (specifying the pressure) in this study can be regarded as a reasonable simplification for simulating a micro-flame propagation problem.
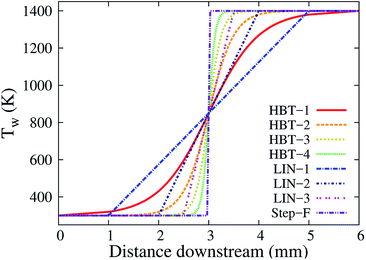
For transient micro-flame simulations, the most common method for setting the wall BCs in the literature is to use the no-slip boundary condition with prescribed wall temperatures. This type of BC can be viewed as a decoupled heat transfer mechanism between the gas and the solid wall. Maruta et al.4 first experimentally used a hyperbolic tangent temperature profile to study flame dynamics. This profile was then widely employed in numerical simulations.18,22,23 Alternative wall temperature profiles such as linear20,32 or step function45 were also used to mimic the heat recirculation via wall conduction in the literature. In this work, these three types of profile (hyperbolic tangent, linear, and step function) were applied to describe the temperature transition from the left to right end of the domain. The left-end and right-end wall temperatures were fixed at Tinw = 300 K and Toutw = 1400 K, respectively. The mathematical expressions are written in the form of piece-wise functions for the three types of profile.
The hyperbolic tangent wall temperature profile is expressed as:
 | (1) |
The linear wall temperature ramp is written as
 | (2) |
As k becomes infinity, the temperature profile Tw(x) becomes a step function:
 | (3) |
Table 1 and Fig. 2 summarise the wall temperature profiles used in this work.
| Case | Types of profile | Ramp function locations | Key parameters |
|---|---|---|---|
| HBT-1 | Hyperbolic tangent | x 1 = 1 mm, x2 = 5 mm | γ = 1.0 mm−1 |
| HBT-2 | Hyperbolic tangent | x 1 = 1 mm, x2 = 5 mm | γ = 2.0 mm−1 |
| HBT-3 | Hyperbolic tangent | x 1 = 1 mm, x2 = 5 mm | γ = 4.0 mm−1 |
| HBT-4 | Hyperbolic tangent | x 1 = 1 mm, x2 = 5 mm | γ = 8.0 mm−1 |
| LIN-1 | Linear | x 3 = 1 mm, x4 = 5 mm | k = 275 K mm−1 |
| LIN-2 | Linear | x 3 = 2 mm, x4 = 4 mm | k = 550 K mm−1 |
| LIN-3 | Linear | x 3 = 2.5 mm, x4 = 3.5 mm | k = 1100 K mm−1 |
| Step-F | Step function | Middle point, 3 mm | k = ∞ |
The global equivalence ratio (ϕ) in all simulations was kept at 1.0. Low, medium, and high inflow velocities (Uin) of 0.2, 0.4, and 0.8 m s−1 (with an inflow velocity-to-laminar flame speed ratio of 1/2, 1, and 2, respectively) were studied in order to provide a relatively comprehensive view of the effects of the wall BCs on the micro-flame dynamics within the combustor’s operational range.
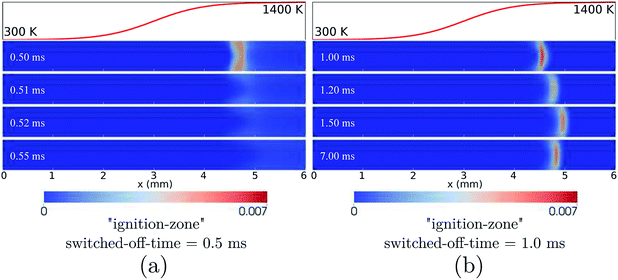
In order to initiate the flame, an artificial rate-controlling temperature (set at 1800 K) was used in the “ignition zone” (located between 0.75L and 0.8L) to inflate the Arrhenius chemical reaction rate while keeping the thermodynamic temperature as per the flow conditions. This zone was in effect for the first 0.5 ms of the simulation time to initiate the flame and then “switched off” subsequently. Quantitative discussions on this ignition method are given in our previous paper.46 This study mainly focuses on the flame dynamics after the “flame initiation event” (simulation time > 0.5 ms).
A uniform mesh consisting of 354 × 36 cells with a cell size of ∼17.0 μm was employed to preserve the same spatial accuracy throughout the domain as the flames simulated were expected to move through the domain. The grid refinement study in our previous studies46 identified this mesh resolution as being sufficient as the flame was invariant to further gird refinement. As mentioned earlier, the Courant–Friedrichs–Lewy (CFL) number was set to 0.45 for the time-marching. A series of CFL numbers (0.30, 0.35, 0.40, and 0.45) was tested in previous studies46 and it was found that the value of 0.45 was small enough for obtaining time step independent solutions.
The simulations were performed in parallel using MPI with each simulation using 64 cores on the Australian national supercomputing cluster. For a typical simulation with a simulation time up to 30 ms, ∼400 hours of wall clock time were needed on these 2.6 GHz Intel Xeon processors.
3. Results and discussion
In this section, the effects of wall temperature profiles on flame dynamics under different inflow velocity conditions are discussed.Low inflow velocity condition (Uin = 0.2 m s−1)
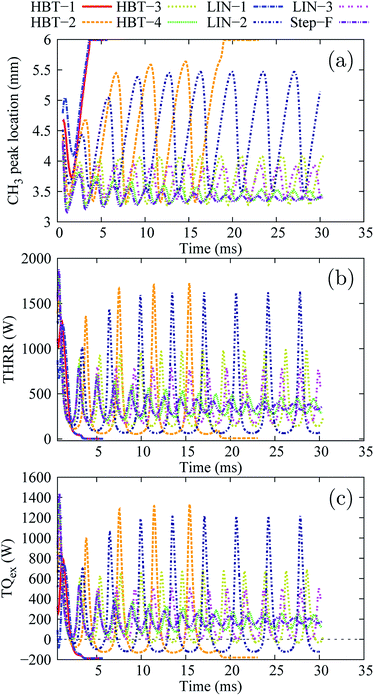
Fig. 3 shows the overview of the temporal evolution of the stream-wise flame front location, the total heat release rate (THRR), and the total heat exchange rate (TQex) for the various wall temperature profiles applied.The position of the peak concentration of the methyl radical (CH3) is chosen to represent the flame front location as CH3 was found to be the key radical that controls the flame initiation and propagation via hydrogen abstraction reactions in the linear progression of CH4 to CO2.47
The THRR is an important quantity to characterise the combustion intensity, which is calculated by integrating the volumetric heat release rate (HRR) over the whole computational domain:
 | (4) |
![[small omega, Greek, dot above]](https://www.rsc.org/images/entities/char_e15a.gif) s and hs are the production/loss rate and the standard enthalpy of formation of species s, respectively.
s and hs are the production/loss rate and the standard enthalpy of formation of species s, respectively.
The total heat exchange rate TQex is calculated by integrating the gas wall interface heat transfer rate along the entire “wall interface” (for both the upper and lower channel wall):
 | (5) |
At the low inflow velocity condition, flame behaviours can be mainly classified into four categories among all the wall temperature profiles simulated:
• flame extinction after the “flame initiation event” (HBT-1 and LIN-1),
• flame extinction and re-ignition for a few cycles, eventually ending up with long-term extinction (HBT-2),
• flames with repetitive oscillations (LIN-2, HBT-3, and LIN-3),
• flame oscillations damped with time, eventually ending up with only limited fluctuations (HBT-4 and Step-F).
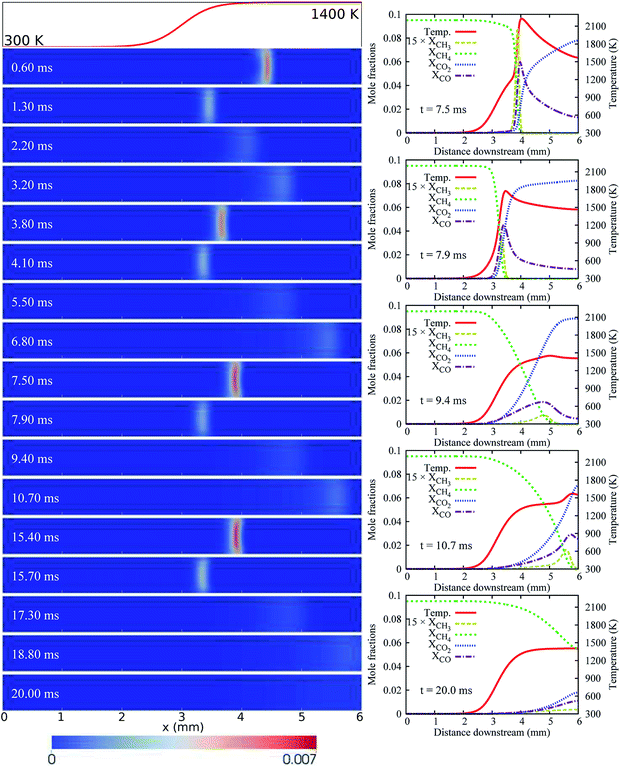
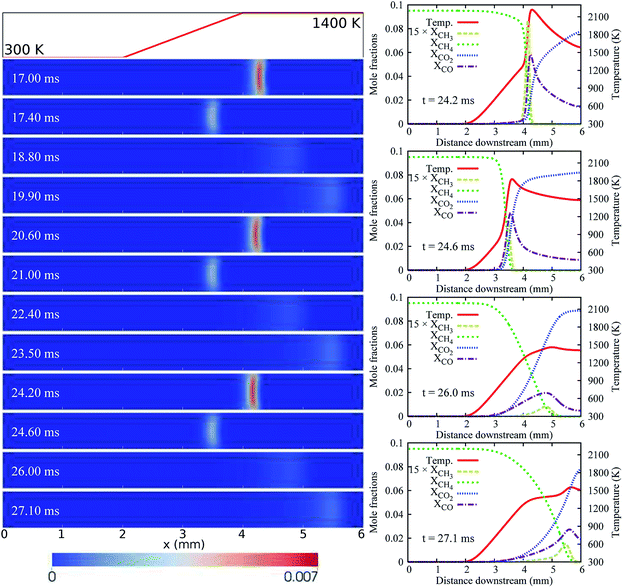
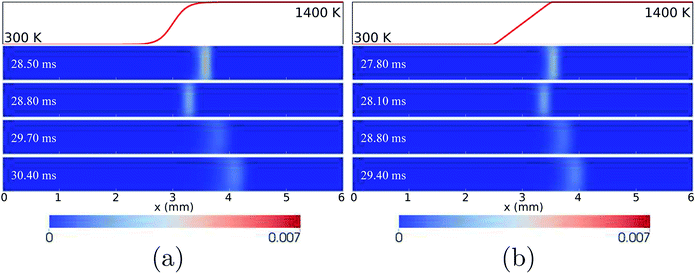
As shown in Fig. 3(b) and (c), after the “flame initiation event”, the THRR and TQex for the wall temperature profiles of HBT-1 and LIN-1 rapidly decrease and reach significantly low levels (∼2 W and −200 W, respectively). A negative TQex (heat is transferred from the walls to the flow) indicates that the flame is extinguished with the “hot walls” simply providing heat to the gas phase with no combustion-related heat release occurring in the channel. The CH3 peak is found to be located at the outlet of the channel after the flame extinction (Fig. 3(a)). Fig. 4 shows the temporal evolution of the CH3 mole fractions for both cases. It is found that the established flame (after the “flame initiation event”) first propagates upstream, then rapidly gets weakened when reaching the upstream location owing to the “cold walls”. At a significantly reduced reaction rate, the flame is convected downstream by the flow and is finally extinguished during its downstream-moving period.
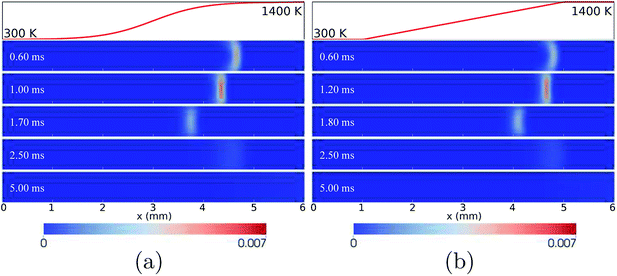 | ||
| Fig. 4 Temporal evolution of CH3 mole fractions for the wall temperature profiles of HBT-1 (a) and LIN-1 (b), at an inflow velocity of Uin = 0.2 m s−1. | ||
For the wall temperature profile of HBT-2, the flame is found to be able to be re-ignited after its extinction (owing to the high temperature at the downstream side of the walls) and then to propagate upstream again. However, this flame extinction and re-ignition phenomenon only lasts for a few cycles, and eventually there is a long-term inactive phase. As shown in Fig. 3(a) and 5, within those limited cycles, a longer and longer preheating length is required for the mixture to be re-ignited. Consequently, the amplitude of the flame front spatial variation increases with time. Eventually, the channel cannot provide a sufficient preheating length for the flame to be re-ignited. A small pool of radicals is retained near the channel outlet (shown in the last slice plot of Fig. 5) without further accumulation, which marks the long-term extinction phase.
For the case of LIN-2, HBT-3, and LIN-3, the flames are found to repetitively oscillate within the channel, up to a simulation time of over 30 ms. Temporal evolutions of the flame front of these cases are shown in Fig. 6 and 7. Among the three wall temperature profiles, the case of LIN-2 is found to have the largest oscillation amplitude and is chosen as an example to comprehensively understand the underlying physical mechanisms for this repetitive flame oscillation.
Similar to the case of HBT-2, the flame spatial variation for LIN-2 increases for the first few oscillation cycles at the initial stage (Fig. 3(a)). However, unlike HBT-2, which eventually ends up with long-term extinction, the oscillation for LIN-2 is found to be able to be maintained at a stable periodic level after 10 ms. As shown in Fig. 6, the flame repetitively experiences the strongest and weakest burning rate during its propagation between the most upstream and downstream location. Within one cycle period of ∼3.5 ms, flame extinction occurs for ∼2.1 ms when the TQex < 0 (Fig. 3(c)), and then the flame is re-ignited as the TQex rebounds to positive values. This flame repetitive extinction and ignition (FREI) phenomenon is analysed from the aspect of the relationship between the flame propagation and the heat generation/transfer as follows.
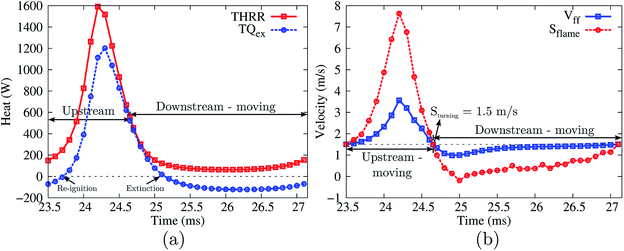
Fig. 8 shows the variation of the THRR, the TQex, the local stream-wise flow velocity at the flame front, and the flame propagation speed within one cycle (23.5–27.1 ms) of the flame’s stable periodic oscillations.
The flame propagation speed (S) is the flame front moving speed with respect to the local stream-wise flow velocity at the flame front Vff:
 | (6) |
Most of the data points are plotted with a time interval of 0.1 ms (the interval for data-saving in the simulation). Two downstream-to-upstream turning points are at 23.5 and 27.1 ms (the starting points of this and next cycle), respectively. In order to capture the upstream-to-downstream turning point, data at the time instant of 24.65 ms (within the time interval between 24.6 and 24.7 ms) are also saved and added in Fig. 8.
As shown in Fig. 8(b), from 23.5 to 24.65 ms, the flame propagation speed is larger than the local flow speed; the flame is therefore propagating upstream. During the upstream propagation period, the flame after ignition first accelerates in the channel. The significant rise in the flame propagation speed indicates that the flame is experiencing its most intensive stage at a very high reaction rate, consuming the fuel rapidly. The flame propagation speed peaks at 24.2 ms and starts to decrease subsequently owing to the larger heat losses from the cold section of the walls. After the turning point at 24.65 ms, the flame propagation speed decreases significantly to quite a low level and becomes smaller than the local flow speed. As a result, the flame is moving downstream with a very weak reaction rate until it reaches the next turning point at 27.1 ms. There are two important findings for these two speeds. Firstly, the flame propagation speed and local flow speed exhibit the same variation in trend, i.e. when one increases the other also increases, and vice versa. However, the flame propagation speed changes more drastically. Secondly, at both the upstream-to-downstream and downstream-to-upstream turning points, the flame propagation speed (equal to the local flow velocity) has an identical value of 1.5 m s−1.
It should be also mentioned that the flame extinction/re-ignition does not occur simultaneously at the turning points. In fact, there are delays between the extinction (the TQex falls below zero) and the upstream-to-downstream turning point, and between the re-ignition (the TQex rebounds to positive values) and the downstream-to-upstream point, as shown in Fig. 8(a).
The flame propagation speed has a strong correlation with the heat release rate (THRR) and gas–solid heat exchange rate (TQex). An enhancement of the reaction rate (a higher THRR) directly leads to a higher flame propagation speed. The combustor structure and flow heat exchange can either aid or retard the flame, depending on whether the heat is recirculated to preheat the reactants (TQex < 0) or lost to the environment (TQex > 0). Therefore, the THRR and TQex have a combined effect on the flame propagation speed. As shown in Fig. 8(a), the TQex varies with the same trend as the THRR. It means that, for example, the increase of the THRR makes positive contributions to the flame propagation speed, while the increase of the TQex (larger heat losses or smaller heat recirculation), at the same time, makes negative contributions to the flame propagation speed. Moreover, it is found that the predominant role (THRR or TQex) in determining the flame propagation speed differs at different flame propagation stages. For most of the time within one cycle of the flame oscillation (the whole flame upstream propagation phase and a part of the downstream propagation phase), the flame propagation speed S is predominantly determined by the THRR. Therefore, the S increases as the THRR increases and the S decreases as the THRR decreases. Nevertheless, there is a weak reaction period within the flame downstream propagation phase (25.0 to 26.2 ms), in which the THRR gently decreases while the flame propagation speed S starts to increase. This indicates that, instead of the flame heat release, the heat recirculation (the TQex is below zero and decreases) makes a larger impact on the S (superior to the THRR) within this period.
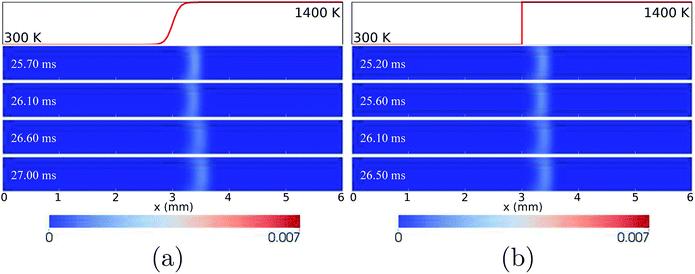
For the wall temperature profiles of HBT-4 and Step-F, flame oscillations are found to be damped after the “flame initiation event”, eventually ending up with only limited fluctuations (Fig. 3). Fig. 9 shows the CH3 mole fraction contours within one cycle of this limited oscillation. The flame front spatial variations are found to be only 3.36–3.52 mm and 3.36–3.42 mm along the channel in this cycle for HBT-4 and Step-F, respectively. For the case of Step-F, the flame is almost “visually” stabilised, although it is not in the “real” steady-state.
Among these wall temperature profiles, the channel wall lengths LT=1400 K that are maintained at the highest wall temperature of 1400 K (from a certain location to the right-end of the channel) are the key factor determining the flame behaviours. When the flame is located within this length range, the longer the LT=1400 K, the more heat can be transferred from the wall to preheat the mixture and enhance the flame propagation speed. Therefore, for the cases with the shortest LT=1400 K (HBT-1 and LIN-1), the flames without sufficient preheating cannot be sustained within the channel and thereby get extinguished. Moreover, the flame is very sensitive to the wall preheating effects. A minor difference in the amount of preheating can lead to significantly different flame behaviours. For example, the LT=1400 K for the case of HBT-2 is only slightly shorter than that for LIN-2. However, the flame for HBT-2 eventually ends up with a long-term inactive phase after a few cycles of FREI, while the flame shows repetitive oscillations for LIN-2 with only slightly larger preheating.
Fast Fourier transform (FFT) of the temporal evolution of the THRR (Fig. 3(b)) is performed for the flame oscillation cases (HBT-2, LIN-2, HBT-3, LIN-3, HBT-4, and Step-F) in MATLAB (Version R2012a, The MathWorks, Natick, USA). The predominant frequencies of the oscillating flames are determined and listed in Table 2. The oscillation peak-to-peak amplitudes (in the flame front location and THRR variation) of the simulated last oscillation cycle are also summarised. It is found that the flame oscillation frequency increases as the wall temperature gradient (parameters of γ and k) increases. The oscillation amplitude, on the contrary, decreases with the gradient-controlling parameters.
| Case | Key parameters | Frequency (Hz) | Variation amplitude in xff (mm) | Variation amplitude in the THRR (W) |
|---|---|---|---|---|
| a For the case of HBT-2, the frequency is evaluated only for a few cycles of flame extinction and re-ignition (before the long-term extinction phase). | ||||
| HBT-2a | γ = 2.0 mm−1 | 255.54 | 2.31 | 1666.6 |
| HBT-3 | γ = 4.0 mm−1 | 430.54 | 0.80 | 823.3 |
| HBT-4 | γ = 8.0 mm−1 | 530.74 | 0.16 | 156.1 |
| LIN-2 | k = 550 K mm−1 | 283.04 | 1.99 | 1546.8 |
| LIN-3 | k = 1100 K mm−1 | 484.99 | 0.54 | 587.0 |
| Step-F | k = ∞ | 540.28 | 0.06 | 46.1 |
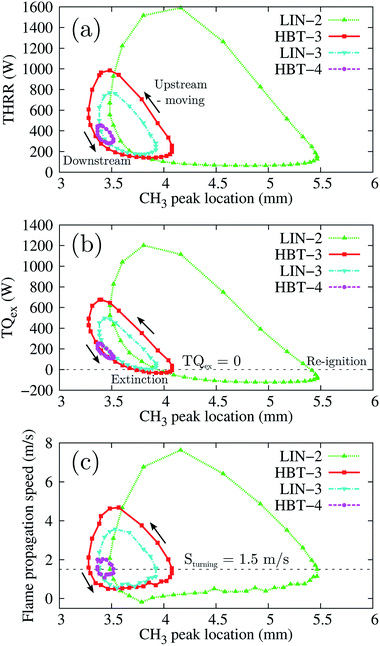
Fig. 10 shows the THRR, the TQex, and the flame propagation speed versus the flame front stream-wise locations within one cycle of the flame’s stable periodic oscillations for the four oscillation cases (LIN-2, HBT-3, LIN-3, and HBT-4). It is found that the flame propagation speed at all the turning points (both upstream-to-downstream and downstream-to-upstream) has the same value of Sturning = 1.5 m s−1 which has been mentioned earlier in the analysis for the case of LIN-2. The flame propagation speed and the local flow velocity vary with the same trend while the former changes much more drastically than the latter (Fig. 8(b)). Therefore, every time before the flame propagation speed goes beyond or falls behind the local flow velocity, there must be a cross-point between these two velocity evolution curves, which is the critical value Sturning. This is the critical value at which the flame propagation speed and the local flow velocity are equal to each other, so that the flame is at rest (the flame front moving speed is zero) at its most upstream or downstream location. Since the flame propagation speed is affected by both the THRR and the TQex, which are strongly dependent on the magnitude of the wall temperature, different wall temperature ramping profiles therefore render the flame propagation speed to reach the Sturning = 1.5 m s−1 at different channel stream-wise locations. This explains the different flame oscillating distances that are determined by their respective upstream-to-downstream and downstream-to-upstream turning points for the different cases.
In order to investigate the quantitative relation between the flame propagation speed S and the THRR and TQex, we assume an expression for the S(THRR, TQex) as a function of the THRR and TQex:
| S = a(THRR − bTQex) + c, | (7) |
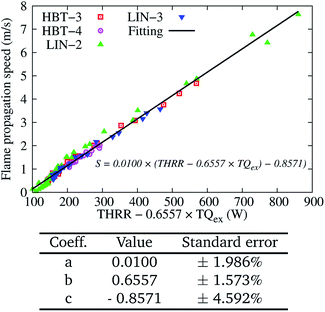 | ||
| Fig. 11 Two-variable (THRR and TQex) fitting of the flame propagation speed S for various wall temperature profiles at an inflow velocity of Uin = 0.2 m s−1. | ||
The coefficient b of 0.6557 can indicate the “relative importance weight” of the TQex contributing to the flame propagation speed, as compared to the THRR. For example, when the TQex and THRR are both positive, only 0.6557 W of heat release is needed to counteract the influence of a unit watt of heat loss on the flame speed. However, when the flame is in the weak reaction phase (downstream-moving and after extinction), the THRR is limited and the TQex becomes negative and more pronounced. As discussed earlier, the heat transfer from the walls is more important to the S rather than the limited heat release within this period.
Medium inflow velocity condition (Uin = 0.4 m s−1)
For an inflow velocity Uin equal to the CH4/air laminar flame speed of 0.4 m s−1, the flames are prone to showing more stability at higher input energy, which is consistent with previous studies.4,18,48 Two categories of flame behaviour are observed:• flames with repetitive oscillations (HBT-1 and LIN-1),
• flame stabilisation (HBT-2, LIN-2, HBT-3, LIN-3, HBT-4, and Step-F).
As shown in Fig. 12, the flames for the cases of HBT-2, LIN-2, HBT-3, LIN-3, HBT-4, and Step-F are eventually stabilised within the channel after the “flame initiation event”. The cases of HBT-1 and LIN-1 which end up with flame extinction at the low inflow velocity condition (Uin = 0.2 m s−1) exhibit periodic oscillations at this medium inflow velocity condition.
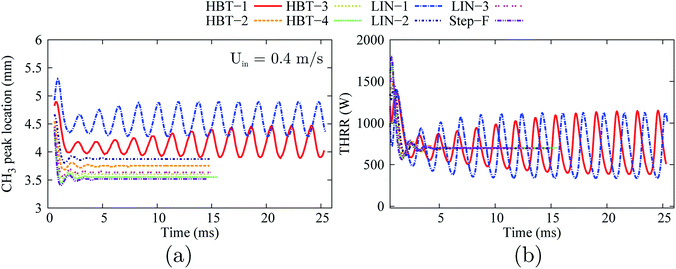 | ||
| Fig. 12 Temporal evolution of the stream-wise flame front location (a) and the total heat release rate (b) for various wall temperature profiles at an inflow velocity of Uin = 0.4 m s−1. | ||
Similar to the analysis for Uin = 0.2 m s−1, the calculated flame propagation speed S for Uin = 0.4 m s−1 among the various cases are also fitted to eqn (7) and plotted in Fig. 13. The determined coefficient b is slightly lower than that for Uin = 0.2 m s−1 (0.5657 vs. 0.6557). This is because that with higher input energy (higher Uin), the flame is more capable of maintaining self-stability, with less dependence on the gas–solid heat transfer.
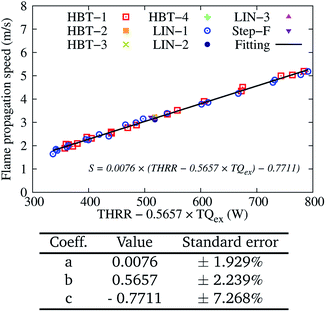 | ||
| Fig. 13 Two-variable (THRR and TQex) fitting of the flame propagation speed S for various wall temperature profiles at an inflow velocity of Uin = 0.4 m s−1. | ||
High inflow velocity condition (Uin = 0.8 m s−1)
At the high inflow velocity of Uin = 0.8 m s−1 (two times larger than the CH4/air laminar flame speed), the flames for the cases of HBT-1, LIN-1, HBT-2, and LIN-2 are found to not be able to be fully established within the “flame initiation event” of 0.5 ms. Fig. 14 shows an example of the ignition issue for the case of HBT-1. At t = 0.5 ms, the CH3 peak is still near the walls rather than located at the channel centre line. Then after the “ignition zone” is switched off, the flame is rapidly extinguished and the remaining pool of radicals is eventually blown out of the channel. Slice plots of the reaction zone structures along the channel centre line and the walls after t = 0.5 ms are shown in Fig. 15. It can be seen that the concentrations of intermediate species and radicals, as well as the temperature magnitude near the walls, are all higher than those at the centre line, which indicates that the flame has not been fully established before it gets blown out of the channel. The underlying reason for this issue is because the high inflow velocity has shortened the flow residence time thereby hindering radical accumulation and diffusion within the channel. Therefore, the “ignition zone” in effect-time is extended to 1.0 ms for those cases in order to ensure that the flame is fully established. As shown in Fig. 16, for the case employing the prolonged ignition event, a strong reaction zone has already been formed at 1.0 ms. Therefore, although the flame front is pushed a bit downstream after the “ignition zone” is switched off, it is able to be eventually stabilised within the channel at a high propagation speed.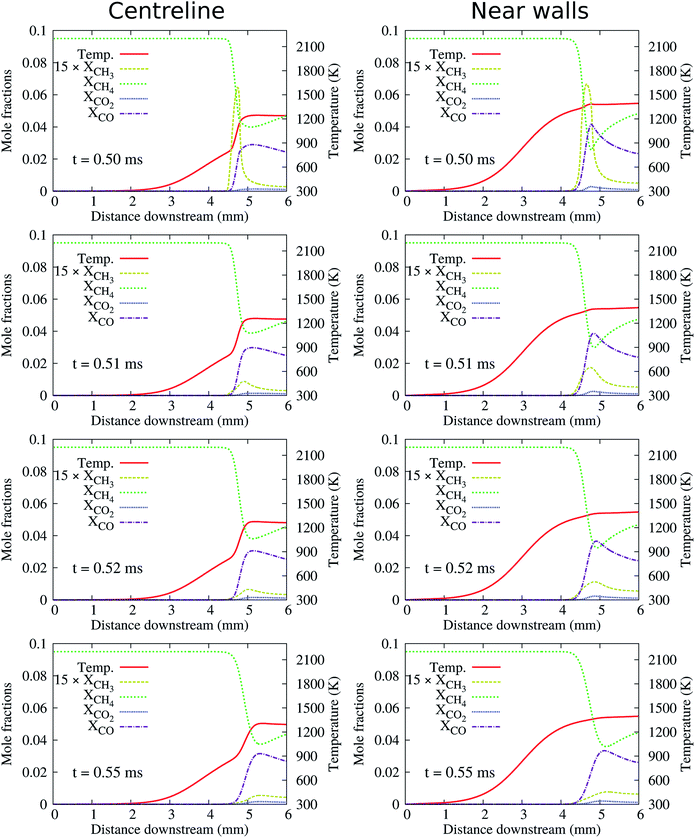 | ||
| Fig. 15 Slice plots along the channel centre line and the walls showing flame structures for the case corresponding to Fig. 14(a). | ||
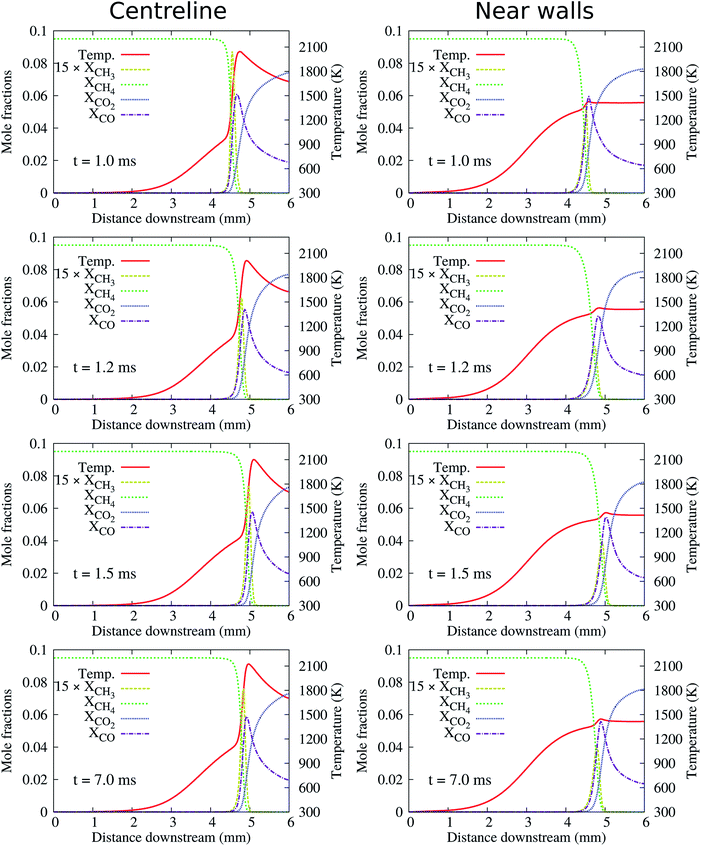 | ||
| Fig. 16 Slice plots along the channel centre line and the walls showing flame structures for the case corresponding to Fig. 14(b). | ||
Among all the cases (with an “ignition zone” in effect-time of 0.5 ms for HBT-3, LIN-3, HBT-4, and Step-F and 1.0 ms for HBT-1, LIN-1, HBT-2, and LIN-2), flames are found to be eventually stabilised within the channel, as shown in the plots of temporal evolution of the flame front location and the THRR (Fig. 17). The flame stabilisation location moves more upstream as the temperature gradient-controlling parameters (γ and k) increase.
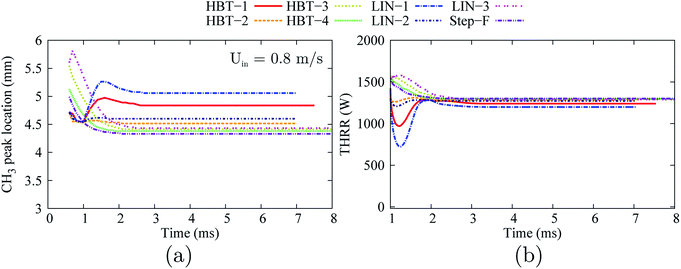 | ||
| Fig. 17 Temporal evolution of the stream-wise flame front location (a) and the total heat release rate (b) for various wall temperature profiles at an inflow velocity of Uin = 0.8 m s−1. | ||
The calculated flame propagation speed S for Uin = 0.8 m s−1 among the various cases is also fitted to eqn (7) and plotted in Fig. 18. Both the transient flames approaching their steady-states and the stable flames are included. At this high level of input energy, the determined coefficient b is further decreased, indicating even less dependence of the flame speed on the gas–solid heat transfer. This also partially explains why flames for all the wall temperature profiles at the high inflow velocity condition are able to overcome the wall surface heat losses and be eventually stabilised.
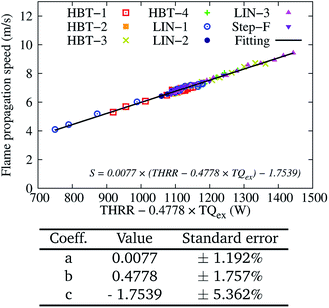 | ||
| Fig. 18 Two-variable (THRR and TQex) fitting of the flame propagation speed S for various wall temperature profiles at an inflow velocity of Uin = 0.8 m s−1. | ||
4. Summary
In summary, the flame shows instabilities in the form of spatial oscillations or even flame extinction at the low inflow velocity condition of Uin = 0.2 m s−1. The flame oscillation amplitude is found to be very sensitive to the wall temperature profiles. More specifically, it increases as the wall temperature gradient-controlling parameters decrease. With the increase of the inflow velocity, flames are prone to showing more stability at the medium inflow velocity condition of Uin = 0.4 m s−1, and eventually show flame stabilisation at the high inflow velocity condition of Uin = 0.8 m s−1 for all the wall temperature profiles examined. Another thing that should be mentioned here is that except for the “flame initiation event”, in which the combustion radicals are generated and accumulated near the wall, the flame shapes (represented by the contour of the OH radicals, not shown here) remain almost constant for all the temperature profiles and inflow velocities, with a slight convex curvature towards the combustor inlet. This can be attributed to the fact that such a narrow channel (H = 0.6 mm) confines the flame and does not allow too much flame stretching. Flames may have more shape variations in wider channels, which can be investigated in future studies.5. Conclusions
This paper has investigated the effect of wall temperature profiles on the premixed CH4/air flame behaviours in a narrow channel, using time-accurate simulations with the DRM-19 reaction mechanism. Three types of prescribed wall temperature profile including the hyperbolic tangent, linear, and step function with a range of values of temperature gradient-controlling parameters were simulated under three different inflow velocity conditions of Uin = 0.2, 0.4, and 0.8 m s−1. The main conclusions are as follows.• Under the low inflow velocity condition, flames show instabilities which are in the form of spatial oscillations and even flame extinction. These instabilities, however, disappear under the high inflow velocity condition and flame stabilisation is seen for all the wall temperature profiles examined.
• The flame oscillation modes can be attributed to competition between the flame propagation speed and the local flow velocity. The flame's spatial oscillations are determined by the flame front upstream-to-downstream and downstream-to-upstream turning points, which are characterised by the same flame propagation speed Sturning. Various wall temperature profiles render the flame propagation speed to reach the same Sturning at different channel stream-wise locations, which explains their respective but different flame oscillation amplitudes.
• The total chemical heat release rate (THRR) and total gas–solid heat exchange rate (TQex) have a combined effect on the flame propagation speed S. For spatially oscillating flames, the predominant role in determining the S shifts from the THRR for most of the time of the flame propagation to the TQex in the weak flame phase. The dependence of the S on the TQex is slightly decreased at higher inflow velocities owing to the higher input energy.
• Since the flame behaviours are very sensitive to the wall temperature profiles, the selection of an appropriate profile becomes a tricky issue. Moreover, a specified wall temperature profile is not capable of capturing the transient thermal response of the walls to the flame propagation for a “real” combustor. For example, the location and magnitude of the peak temperature at the wall will probably evolve as the flame propagates through the channel. Therefore, these above-mentioned aspects call for a conjugate heat transfer model that also accounts for the heat conduction in the combustor walls. A solid heat transfer solver which is tightly coupled with our fluid solver has been newly developed and verified.49 Future simulations will be conducted utilising conjugate heat transfer along with the detailed chemical kinetics in order to capture all of the relevant physics accurately.
Conflicts of interest
There are no conflicts to declare.References
- N. S. Kaisare and D. G. Vlachos, Prog. Energy Combust. Sci., 2012, 38, 321–359 CrossRef.
- A. C. Fernandez-Pello, Proc. Combust. Inst., 2002, 29, 883–899 CrossRef.
- K. Maruta, Proc. Combust. Inst., 2011, 33, 125–150 CrossRef.
- K. Maruta, T. Kataoka, N. I. Kim, S. Minaev and R. Fursenko, Proc. Combust. Inst., 2005, 30, 2429–2436 CrossRef.
- A. Fan, S. Minaev, E. Sereshchenko, R. Fursenko, S. Kumar, W. Liu and K. Maruta, Proc. Combust. Inst., 2009, 32, 3059–3066 CrossRef.
- Y. Liu, A. Fan, H. Yao and W. Liu, Int. J. Heat Mass Transfer, 2015, 91, 18–26 CrossRef.
- X. Kang and A. Veeraragavan, Appl. Therm. Eng., 2015, 85, 234–242 CrossRef.
- J. Chen, X. Gao and D. Xu, RSC Adv., 2015, 5, 39375–39383 RSC.
- J. Chen, X. Gao and D. Xu, RSC Adv., 2015, 5, 51318–51329 RSC.
- Y. Liu, A. Fan, H. Yao and W. Liu, Appl. Therm. Eng., 2016, 101, 239–246 CrossRef.
- W. Yang, A. Fan and H. Yao, Appl. Therm. Eng., 2016, 107, 837–843 CrossRef.
- J. Bai, Q. Wang, Z. He, C. Li and J. Pan, Appl. Therm. Eng., 2014, 73, 1066–1075 CrossRef.
- X. Kang and A. Veeraragavan, Energy Convers. Manage., 2017, 133, 127–137 CrossRef.
- A. Veeraragavan and C. P. Cadou, Combust. Flame, 2011, 158, 2178–2187 CrossRef.
- A. Veeraragavan, Energy, 2015, 93, 631–640 CrossRef.
- D. Norton and D. Vlachos, Combust. Flame, 2004, 138, 97–107 CrossRef CAS.
- J. Li, S. K. Chou, Z. W. Li and W. M. Yang, Combust. Theory Modell., 2008, 12, 325–347 CrossRef CAS.
- G. Pizza, C. E. Frouzakis, J. Mantzaras, A. G. Tomboulides and K. Boulouchos, Combust. Flame, 2008, 152, 433–450 CrossRef CAS.
- A. Alipoor and K. Mazaheri, Energy, 2014, 73, 367–379 CrossRef.
- A. Nair, V. R. Kishore and S. Kumar, Combust. Sci. Technol., 2015, 187, 1620–1637 CrossRef.
- C. Jiménez, D. Fernández-Galisteo and V. N. Kurdyumov, Int. J. Hydrogen Energy, 2015, 40, 12541–12549 CrossRef.
- H. Nakamura, A. Fan, S. Minaev, E. Sereshchenko, R. Fursenko, Y. Tsuboi and K. Maruta, Combust. Flame, 2012, 159, 1631–1643 CrossRef.
- E. Miyata, N. Fukushima, Y. Naka, M. Shimura, M. Tanahashi and T. Miyauchi, Proc. Combust. Inst., 2015, 35, 3421–3427 CrossRef.
- X. Kang, R. Gollan, P. Jacobs and A. Veeraragavan, Combust. Flame, 2016, 173, 266–275 CrossRef.
- V. N. Kurdyumov and C. Jiménez, Combust. Flame, 2014, 161, 927–936 CrossRef.
- G. P. Gauthier and J. M. Bergthorson, Combust. Flame, 2016, 173, 27–38 CrossRef.
- A. P. Singh, V. RatnaKishore, S. Minaev and S. Kumar, RSC Adv., 2015, 5, 100879–100890 RSC.
- A. P. Singh, V. Kishore, Y. Yoon, S. Minaev and S. Kumar, Combust. Sci. Technol., 2017, 189, 150–168 CrossRef.
- B. Aravind, R. K. Velamati, A. P. Singh, Y. Yoon, S. Minaev and S. Kumar, RSC Adv., 2016, 6, 50358–50367 RSC.
- G. P. Gauthier, G. M. Watson and J. M. Bergthorson, Combust. Flame, 2014, 161, 2348–2360 CrossRef.
- G. P. Gauthier, G. M. G. Watson and J. M. Bergthorson, Combust. Sci. Technol., 2012, 184, 850–868 CrossRef.
- V. R. Kishore, S. Minaev, M. Akram and S. Kumar, RSC Adv., 2017, 7, 2066–2073 RSC.
- R. J. Gollan and P. A. Jacobs, Int. J. Numer. Methods Fluids, 2013, 73, 19–57 CrossRef.
- M. Liou, J. Comput. Phys., 2006, 214, 137–170 CrossRef.
- B. J. McBride and S. Gordon, Computer Program for Calculation of Complex Chemical Equilibrium Compositions and Applications. Part 2: Users Manual and Program Description, NASA Lewis Research Center, Cleveland, OH, USA, Report No. Reference Publication 1311, 1994 Search PubMed.
- C. R. Wilke, J. Chem. Phys., 1950, 18, 517–519 CrossRef.
- R. C. Reid, J. M. Prausnitz and B. E. Poling, The properties of gases and liquids, McGraw–Hill, New York, 4th edn, 1987 Search PubMed.
- K. Sutton and P. Gnoffo, 7th AIAA/ASME Joint Thermophysics and Heat Transfer Conference, 1998 Search PubMed.
- H. Bongers and L. P. H. D. Goey, Combust. Sci. Technol., 2003, 175, 1915–1928 CrossRef.
- A. Kazakov and M. Frenklach, Reduced Reaction Sets based on GRI–Mech 1.2, a 19-species reaction set, http://www.me.berkeley.edu/drm/.
- G. P. Smith, D. M. Golden, M. Frenklach, N. W. Moriarty, B. Eiteneer, M. Goldenberg, C. T. Bowman, R. K. Hanson, S. Song, W. C. Gardiner Jr, V. V. Lissianski and Z. Qin, GRI–Mech 3.0, http://www.me.berkeley.edu/gri–mech/.
- B. O’Flaherty, Ph.D. thesis, The University of Queensland, 2012.
- N. Slavinskaya, M. Braun-Unkhoff and P. Frank, J. Eng. Gas Turbines Power, 2008, 130, 021504 CrossRef.
- X. Kang, R. Gollan, P. Jacobs and A. Veeraragavan, 20th Australasian Fluid Mechanics Conference, 2016 Search PubMed.
- V. N. Kurdyumov, G. Pizza, C. E. Frouzakis and J. Mantzaras, Combust. Flame, 2009, 156, 2190–2200 CrossRef.
- X. Kang, R. J. Gollan, P. A. Jacobs and A. Veeraragavan, Comput. Fluids, 2017, 144, 117–136 CrossRef.
- S. R. Turns, An Introduction to Combustion: Concepts and Applications, McGraw–Hill, New York, 3rd edn, 2012 Search PubMed.
- X. Kang, R. J. Gollan, P. A. Jacobs and A. Veeraragavan, Proceedings of the Australian Combustion Symposium, 2015 Search PubMed.
- A. Veeraragavan, J. Beri and R. J. Gollan, J. Comput. Phys., 2016, 307, 308–320 CrossRef.
| This journal is © The Royal Society of Chemistry 2017 |


