 Open Access Article
Pinecone biomass-derived hard carbon anodes for high-performance sodium-ion batteries†
Tao Zhangab,
Jing Mao *ab,
Xiaolin Liua,
Minjie Xuanab,
Kai Bia,
Xiao Li Zhang
 ab,
Junhua Huab,
Jiajie Fan
 ab,
Shimou Chen
 c and
Guosheng Shao
 *ab
*ab
aSchool of Materials Science and Engineering, Zhengzhou University, Zhengzhou 450001, China
bState Centre for International Cooperation on Designer Low-Carbon and Environmental Materials, Zhengzhou University, Zhengzhou 450001, China. E-mail: maojing@zzu.edu.cn; gsshao@zzu.edu.cn
cInstitute of Process Engineering, Chinese Academy of Sciences, Beijing 100190, China
First published on 25th August 2017
Abstract
Hard-carbon is considered as one of the most promising anode materials for sodium-ion batteries (SIBs). Now it is imperative to develop a proper preparation method to obtain hard carbon anode particles with high initial coulombic efficiency and good cycling performance. In this paper, we have successfully prepared high performance hard carbon anodes, by selecting abundant and low-cost pinecones as biomass precursor and optimizing the preparation parameters of pinecone-derived hard carbon (PHC). The microstructure of PHC is studied by X-ray diffraction (XRD), Raman spectroscopy, high-resolution transmission electron microscopy (HRTEM) as well as nitrogen adsorption–desorption isotherm methods. The performance of PHC is highly dependent on the carbonization temperature. Increasing carbonization temperature of pinecone precursor can reduce surface area and thus improve the initial coulombic efficiency. Varying carbonization temperature can also adjust the slope and plateau capacity of PHC, and then regulate the energy density and power characteristics of PHC in battery operation. PHC1400 still delivers a capacity of 334 mA h g−1 after 120 cycles, with a high initial coulombic efficiency of 85.4%. Our results suggest that PHC is a promising anode material for practical large-scale SIB application.
1. Introduction
Nowadays, lithium-ion batteries (LIBs) are generally utilized in various kinds of electronic products and electric vehicles. However, the amount of lithium resources and the high cost limit the large-scale applications of LIBs.1–3 The neighbor of lithium in group 1 in the periodic table, sodium element, has similar physical and chemical properties to lithium.4 In addition to this, the wide distribution of sodium in the oceans and its low cost also make sodium-ion batteries the most promising candidate for extensive energy storage applications.5–9 Several kinds of cathode materials for SIBs have been already prepared with excellent potential properties.10–13 However, few anode materials have the ability to fully meet the large-range commercial applications. Graphite has been generally used as anode in LIBs, with the reversible specific capacity of 372 mA h g−1 and a low voltage plateau of 0.1 V.14,15 However, on account of the limitation of interlayer spacing and intrinsic crystal structure, sodium ion could hardly intercalate into the graphitic layers.16,17 Expanded graphite synthesized by chemical oxidation and partial reduction method was used as anode material of SIBs, with a reversible specific capacity of 284 mA h g−1 at a current density of 20 mA g−1, only showed an initial coulombic efficiency of 49.5%.18 So far, several kinds of anode materials, including carbon-based materials,19–23 alloys,24–26 Ti-based oxides,27 and organic compounds28 have been investigated. Nevertheless, the barriers of structure instability, high discharge potential, low initial coulombic efficiency and low reversible specific capacity for those various anodes still exist. Different from graphite, hard carbon with amorphous structure has shown the greatest potential as practical anode material of sodium-ion batteries (SIBs).29–32 In recent years, researchers are paying more attention to synthesizing hard carbon via abundant biomass-based materials,33–36 instead of expensive inorganic materials. Utilization of biomass could not only decrease the cost but also solve the pollution from incinerating abundant waste biomass. Besides that, the battery energy density could be maximized by using high capacity hard carbon anode. Although biomass-based hard carbon exhibits a fair electrochemical property in SIBs, the low initial coulombic efficiency and the weak cycling performance hinder the commercial application of the hard carbon anode material for SIBs. To deal with such tasks, selecting proper biomass resources of hard carbon should be important. Hard carbon prepared from harmful algal blooms only had an initial coulombic efficiency of 52.1%, a specific capacity of approximately 230 mA h g−1, and instable cycling performance.37 The hard carbon derived from banana peels with additional air-activation process, showed an initial coulombic efficiency of 67.8%, and had a specific capacity of 298 mA h g−1 after 300 cycles.38 The hard carbon electrode made from leaves had a specific capacity of 320 mA h g−1 at a current density of 20 mA g−1, as well as a 74.8% initial coulombic efficiency.39 Hu et al. reported different kinds of hard carbon made from sucrose,40 cotton41 and corn cob.42 One of them showed an initial coulombic efficiency of 85% and approximately a specific capacity of 300 mA h g−1. Based on these considerations, we report a pinecone-derived hard carbon, made from a cheap and resourceful biomass of pinecones. Pinecones have the following advantages: (a) pinecones are cheap and renewable agricultural biomass waste. (b) Drying pinecone is relatively clean without much silicon impurity. (c) Pinecones have moderate hardness, and are easily pulverized to fine powder precursor using household grinder. The pinecone-derived hard carbon (PHC) anode for sodium-ion batteries made by properly carbonizing and cleaning process, exhibited a good electrochemical property. The PHC carbonized at 1400 °C in this work shows the best electrochemical performance delivering a reversible capacity of 370 mA h g−1 (the third cycle) at the current density of 30 mA g−1 and 334 mA h g−1 after 120 cycles, with a high initial coulombic efficiency of 85.4%. Parameters such as morphology, particle size, specific surface area, pore characteristics and impurity also have vital roles in the electrochemical properties of the hard-carbon electrode. One should thus mainly focus on factors of carbonization temperature, impurity content and cleaning process. This work explores the effect of carbonization temperature and impurity content on electrochemical property of PHC in sodium-ion batteries.2. Experimental
2.1. Materials synthesis
PHC was prepared by a two-step carbonization method using pinecone as carbon source. Firstly, dried pinecones were smashed into fine powders by a grinder and fractioned by passing 300-mesh sieve. Then the powders were pre-pyrolyzed at 500 °C for 2 hours in a tube furnace under argon atmosphere. The argon flow rate was 80 cm3 min−1, and the furnace cooled naturally. The yield was 33%. Secondly, the pre-pyrolyzed PHC powders were dispersed in 20% wt KOH solution at 60 °C for 3 hours, then filtered, and dispersed in 3 M HCl solution at 60 °C for 5 hours under stirring to remove impurities. The obtained PHC powders were further rinsed by deionized water, then filtered, and dried at 120 °C for overnight in a vacuum oven. Thirdly, the pre-pyrolyzed clean PHC powders were carbonized again in a tube furnace under argon atmosphere at different temperatures (500 °C, 800 °C, 850 °C, 900 °C, 1000 °C, 1200 °C, 1400 °C, 1600 °C) for 2 hours with a heating rate 5 °C min−1 and a argon flow rate of 80 cm3 min−1. The yield was 80%. Finally, we obtained several pinecone derived hard carbon samples and labeled them as PHC500, PHC800, PHC850, PHC900, PHC1000, PHC1200, PHC1400, PHC1600, respectively.2.2. Materials characterization
TGA analysis was carried out using a diamond TG/DTA, heating from room temperature to 800 °C at heating rate of 5 °C min−1 in N2 atmosphere. XRD (Ultima IV; Cu Kα λ = 1.54050 Å) and Raman patterns (LABRAM HR EVO) were utilized to characterize the structure of PHC. Scanning electron microscopy (SEM) observations were carried out on a Hitachi SU8020 microscope operated at 5.0 kV for representing the surface microtopography. High-resolution transmission electron microscopy (HRTEM) observations measurement were performed with a JEOL JEM-2100 microscope operated at 200 kV for detecting the d(002). The nitrogen adsorption–desorption isotherms of PHC samples was reported by extended surface area and pore size analyzer (MicroActive for ASAP 2460). Specific surface was measured by the Brunauer–Emmett–Teller (BET) method and pore size distribution was determined by the Barrett–Joyner–Halenda (BJH) method.2.3. Electrochemical measurements
All the electrochemical tests of the PHC electrodes were determined in half cells (CR2025) with Na foil (homemade) as the counter electrode. The working electrode was prepared by spreading the mixed slurry of active material and sodium carboxymethyl cellulose (CMC) binder in water solvent with a weight ratio of 90![[thin space (1/6-em)]](https://www.rsc.org/images/entities/char_2009.gif) :
:![[thin space (1/6-em)]](https://www.rsc.org/images/entities/char_2009.gif) 10 onto Cu foil, and then dried at 120 °C overnight in vacuum oven. The loading density of active material was adjusted between 1.5 and 2.5 mg cm−2. The electrolyte was 1 M NaClO4 dissolved in a mixture of ethylene carbonate (EC) and diethyl carbonate (DEC) with a volume ratio of 1
10 onto Cu foil, and then dried at 120 °C overnight in vacuum oven. The loading density of active material was adjusted between 1.5 and 2.5 mg cm−2. The electrolyte was 1 M NaClO4 dissolved in a mixture of ethylene carbonate (EC) and diethyl carbonate (DEC) with a volume ratio of 1![[thin space (1/6-em)]](https://www.rsc.org/images/entities/char_2009.gif) :
:![[thin space (1/6-em)]](https://www.rsc.org/images/entities/char_2009.gif) 1. Glass fiber was used as the separator. The coin cells were assembled in the argon-filled glovebox with oxygen content and water content less than 0.1 ppm. The galvanostatic discharge and charge tests were performed using Land CT2001A (Wuhan, China) battery test systems in the voltage range of 0.001–2 V at various C-rates at room temperature. Cyclic voltammetry (CV) and electrochemical impedance spectra (EIS) tests were carried out on electrochemical workstation (Bio-logic VMP-3).
1. Glass fiber was used as the separator. The coin cells were assembled in the argon-filled glovebox with oxygen content and water content less than 0.1 ppm. The galvanostatic discharge and charge tests were performed using Land CT2001A (Wuhan, China) battery test systems in the voltage range of 0.001–2 V at various C-rates at room temperature. Cyclic voltammetry (CV) and electrochemical impedance spectra (EIS) tests were carried out on electrochemical workstation (Bio-logic VMP-3).
3. Results and discussion
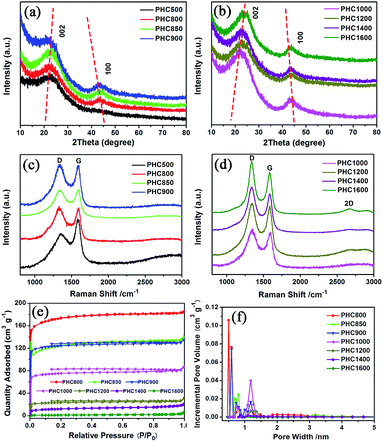
The PHC was prepared by a simple thermal carbonization process, and the schematic diagram of synthesis route is shown in Fig. 1. The physical structure parameters of PHC powders examined by XRD, Raman and BET gas sorptometry measurement are shown in Fig. 2 and Table 1. XRD patterns indicate that all PHC samples have partially disordered crystal structure (Fig. 2a and b), consisting of one relatively strong broad peak at about 23° and another weak broad peak at about 43°, which correspond to (002) and (100) diffractions. It is clearly that the (002) peaks move to higher angle slightly as carbonization temperature increasing. Then the calculated d(002) decreases from 0.421 to 0.375 nm, which are much higher than that of graphite (0.34 nm) and will facilitate the insertion of big Na+ in carbonate electrolyte. The calculated stacking height (Lc) increases from 1.12 to 1.91 nm gradually, indicating more graphene layers are piled in graphene-like crystallite region. From PHC carbonized at 800 °C, the (100) peaks appear clearly. To measure the lateral size (La) value more accurately, we use Scherrer equation based on (002) and (100) XRD peaks and Raman-based equation.43 The (La) increases slightly from PHC800 to PHC1600, indicating that the lateral crystalline size increases upon increasing calcination temperature. The lateral size growth is beneficial to the storage of more Na+. In general, XRD patterns confirm the overall disordered carbon structure of all PHC samples and the more ordered structure in short range upon increasing carbonization temperature. The Raman patterns (Fig. 2c and d) show two broad peaks, approximately centered at 1351 (D-band) and 1582 cm−1 (G-band), which belong to characteristic disordered carbon structure. As carbonization temperature rising, the full width half-maximum (FWHM) of G-band and D-band decrease and the integrated strength ratio (IG/ID) increase. This phenomenon indicates that the order degree of the PHC is being higher and higher in short range. Fig. 2e and f exhibit the N2 adsorption–desorption isotherms and the BJH pore size distribution. The values of the BET surface area, total pore volume and average pore diameter are listed in Table 1. It can be seen that PHC carbonized at high temperature has lower BET surface area, lower total pore volume and bigger average pore diameter. All the PHC powders belong to mesoporous material and the average pore diameter exceed 2 nm, especially PHC1600 has the largest pore diameter of 8.9 nm. Generally speaking, smaller specific surface area of anode powder will produce higher initial coulombic efficiency in lithium-ion battery operation. Our tests of PHC in half-cells as anodes in sodium-ion battery show similar trend. Samples carbonized at higher temperature (PHC1000, PHC1200, PHC1400, PHC1600) have smaller specific surface, as is 239, 75, 40, 4 m2 g−1, and the initial coulombic efficiency is 83.5%, 84.4%, 85.4%, 83.5%, respectively. While samples carbonized at lower temperature (PHC500, PHC800, PHC850, PHC900) have larger specific surface of 393, 557, 400, 395 m2 g−1, and lower initial coulombic efficiency of 39.7%, 33.3%, 67.1%, 77.6%, respectively. From the analysis of the results, it can be seen that when the carbonization temperature exceeds 1000 °C, the initial coulombic efficiency of the obtained PHC does not vary much.a La: lateral size of the crystallite calculated by equation:  (K = 0.89, β is half width of (100) diffraction peak, λ = 0.154056 nm); Lc: stacking height of the crystallite, calculated by equation: (K = 0.89, β is half width of (100) diffraction peak, λ = 0.154056 nm); Lc: stacking height of the crystallite, calculated by equation:  (K = 0.89, β is half width of (002) diffraction peak, λ = 0.154056 nm).b (K = 0.89, β is half width of (002) diffraction peak, λ = 0.154056 nm).b  c ID and IG are the integrated intensities of D and G band.d Surface area calculated with Brunauer–Emmett–Beller (BET) method.e Total pore volume determined at a relative pressure of 0.99.f Average pore diameter. c ID and IG are the integrated intensities of D and G band.d Surface area calculated with Brunauer–Emmett–Beller (BET) method.e Total pore volume determined at a relative pressure of 0.99.f Average pore diameter. |
||||||||
|---|---|---|---|---|---|---|---|---|
| Sample | PHC500 | PHC800 | PHC850 | PHC900 | PHC1000 | PHC1200 | PHC1400 | PHC1600 |
| d(002) (nm) | 0.421 | 0.417 | 0.413 | 0.407 | 0.402 | 0.391 | 0.381 | 0.375 |
| Lca (nm) | 1.12 | 1.25 | 1.43 | 1.46 | 1.64 | 1.72 | 1.85 | 1.91 |
| Laa (nm) | — | 9.59 | 10.52 | 10.70 | 11.14 | 11.31 | 11.48 | 11.97 |
| Lab (nm) | — | 6.34 | 6.34 | 6.54 | 7.11 | 8.84 | 10.2 | 11.53 |
| IG/IDc | 0.37 | 0.33 | 0.33 | 0.34 | 0.37 | 0.46 | 0.53 | 0.60 |
| SBETd (m2 g−1) | 393 | 557 | 400 | 395 | 239 | 75 | 40 | 4 |
| Vte (cm3 g−1) | 0.19 | 0.29 | 0.22 | 0.21 | 0.13 | 0.05 | 0.03 | 0.01 |
| APDf (nm) | 1.9 | 2.1 | 2.2 | 2.1 | 2.2 | 2.5 | 3.1 | 8.9 |
The particle morphology of all PHC materials is examined by scanning electron microscope (SEM) and shown in Fig. S2.† Low magnification SEM images (Fig. S2a1–h1†) show that all PHC materials are composed of irregular-shaped secondary particles with average size around 16–20 μm. High magnification SEM images (Fig. S2a2–h2†) show that all particles have fish-scale-like coarse surface and micrometer sized pores. The porous structure of PHC materials should benefit the ion transportation in electrolyte, and improve the electrochemical performance of PHC electrodes. To examine the micro-structure evolution clearly of PHC materials carbonized at different temperature, HRTEM images are shown in Fig. 3a–h. HRTEM images of sample PHC500, PHC800, PHC850, PHC900 (Fig. 3a–d) are observed to be typical amorphous carbon structure without any orientation trend of the graphene-like region. Samples of PHC1000, PHC1200, PHC1400, PHC1600 (Fig. 3e–h) reveal more obvious turbostratic graphitic microstructures with increasing carbonization temperature and graphene-like regions can be clearly seen (Fig. 3g and h). The structure information of PHC samples presented by HRTEM images is consistent with the results of XRD and Raman.
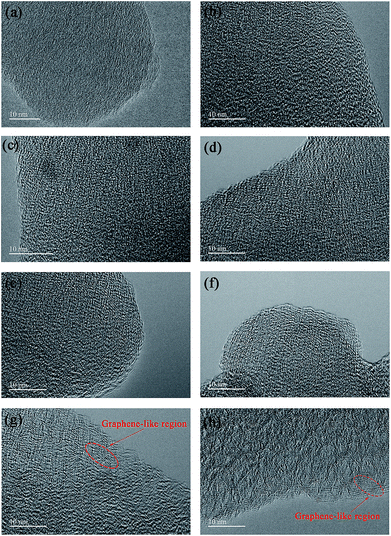 | ||
| Fig. 3 (a–h) HRTEM images of PHC500, PHC800, PHC850, PHC900, PHC1000, PHC1200, PHC1400 and PHC1600, respectively. | ||
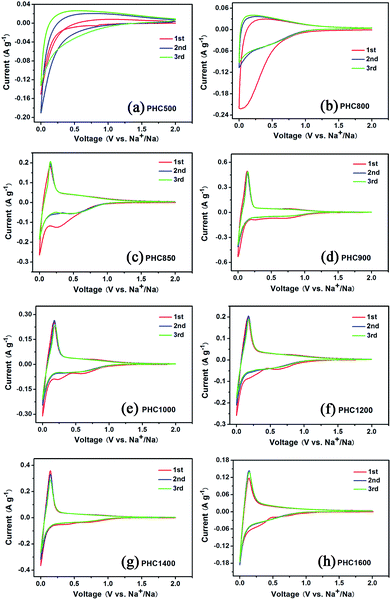
To investigate the influence of carbonization temperature on the electrochemical properties of PHC materials, we perform cyclic voltammetry tests in half cell with Na as counter electrode between 0.001 and 2 V with a scanning rate of 0.1 mV s−1 at 27 °C. The CV curves of PHC500 and PHC800 (Fig. 4a and b) show no sharp peaks and are very different from that of other PHC materials. The CV curves of PHC850 to PHC1600 are similar and consist of one pair of sharp reduction and oxidation peak between 0.001 and 0.25 V, corresponding to Na insertion/extraction, which is in agreement with previous studies on other hard carbon in literatures.17,33,38 As shown in Fig. 4c, the sharp redox peaks begin appearing clearly from PHC850 material, which has a higher initial coulombic efficiency and reversible capacity compared to PHC800 material (see Table 2). It can be clearly seen that the additional two weak peaks between 0.2 and 1.0 V at first CV scan disappear in the subsequent cycles, which is a common phenomenon and can be attributed to the formation of solid electrolyte interface (SEI) and other irreversible reaction. Totally speaking, the first three CV curves of PHC900 to PHC1600 overlap well, implying that PHC should have stable cycle performance in long-term cycling tests. We can obtain some kinetics information of Na insertion/extraction from the peak height value in CV curves for PHC materials. Higher CV peak height value means better rate performance in charge–discharge tests. Fig. 4d–h show that the peak height value decrease as the sequence of PHC900, PHC1400, PHC1200, PHC1000, PHC1600, which is consistent with the rate performance tests. As shown in Table 2, the capacity ratio of 0.5C/0.1C and 1C/0.1C show the same trend, decreasing as the sequence of PHC900, PHC1400, PHC1200, PHC1000, PHC1600.
| a The reversible capacity at current density 0.1C (30 mA g−1).b The sloping capacity.c The plateau capacity.d The initial coulombic efficiency. | ||||||||
|---|---|---|---|---|---|---|---|---|
| Sample | PHC500 | PHC800 | PHC850 | PHC900 | PHC1000 | PHC1200 | PHC1400 | PHC1600 |
| RCa (mA h g−1) | 149 | 110 | 205 | 287 | 301 | 324 | 370 | 346 |
| SCb (mA h g−1) | 117 | 79 | 108 | 131 | 120 | 102 | 90 | 65 |
| PCc (mA h g−1) | 32 | 31 | 97 | 156 | 181 | 222 | 280 | 281 |
| SC/RC | 78.5% | 71.8% | 52.7% | 45.6% | 39.9% | 31.5% | 24.3% | 18.8% |
| PC/RC | 21.5% | 28.2% | 47.3% | 54.4% | 60.1% | 68.1% | 75.7% | 81.2% |
| 0.1C (mA h g−1) | 147 | 108 | 197 | 284 | 300 | 321 | 366 | 330 |
| 0.2C (mA h g−1) | 125 | 96 | 171 | 271 | 272 | 294 | 319 | 279 |
| 0.5C (mA h g−1) | 93 | 73 | 121 | 228 | 175 | 197 | 237 | 113 |
| 1C (mA h g−1) | 66 | 54 | 79 | 163 | 86 | 99 | 142 | 43 |
| 2C (mA h g−1) | 37 | 35 | 47 | 96 | 47 | 49 | 51 | 27 |
| 0.2C/0.1C | 85% | 88.9% | 89.5% | 95.4% | 90.7% | 91.6% | 87.2% | 84.5% |
| 0.5C/0.1C | 63.3% | 67.6% | 61.4% | 80.1% | 58.3% | 61.4% | 64.8% | 34.2% |
| 1C/0.1C | 44.9% | 50% | 40.1% | 57.4% | 28.7% | 30.8% | 38.8% | 13.0% |
| 2C/0.1C | 25.2% | 32.4% | 23.9% | 33.8% | 15.7% | 15.3% | 13.9% | 8.2% |
| ICEd (%) | 39.7 | 33.3 | 67.1 | 77.6 | 83.5 | 84.4 | 85.4 | 83.5 |
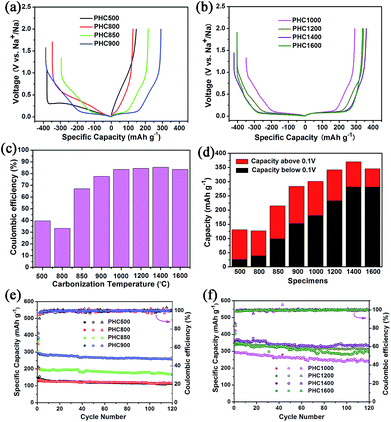
Coin cell (2025) with a metallic Na counter electrode were used to evaluate the electrochemical performance of PHC electrodes. Initial charge/discharge curves at 0.1C (30 mA g−1), the comparison of ICE, capacity contribution of slope and plateau, and the cycle performance is displayed in Fig. 5. The corresponding detailed data is shown in Table 2. It is seen that carbonization temperature has a great effect on the electrochemical property of PHC materials.44 As increasing temperature in the range of 800–1400 °C, the ICE and the reversible capacity increased gradually. PHC1400 exhibits the highest ICE of 85.4% (Fig. 5c) and reversible capacity of 370 mA h g−1 (Fig. 5d) among all the PHC materials. When temperature exceeding 850 °C, the plateau around 0.1 V can be seen clearly from the curves, and the contribution of plateau capacity increases upon increasing the carbonization temperature. For example, PHC1400 has a plateau (0.1 V) capacity as high as 280 mA h g−1, and a slope capacity of 90 mA h g−1, which is good for anode material in practical battery application. The capacity retention of all PHC materials exceeds 80%, indicating stable cycling for long term battery tests (30 mA g−1, 120 cycles) (Fig. 5e and f). PHC1200 shows the highest capacity retention of 96.9%, delivering a capacity of 314 mA h g−1 after 120 cycles (4 months). For PHC1400 and PHC1600, the capacity retention is 90.3% and 84.7%. According to literature, the sloping zone corresponds to sodium ion adsorption on defects, edges and surface, while plateau zone relates to sodium ion insertion into graphene-like sheets.45,46 At 0.1 V plateau, side reactions, such as sodium plating at close to 0 V, possibly happen, and may result the rapid decay of reversible capacity. A comparison of the performance of the PHC1400 with different hard carbons is shown in Table 3. The result shows that the PHC1400 delivers the highest reversible capacity and a high initial coulombic efficiency.
| Material | Capacity (mA h g−1) | ICEa (%) | Current density (mA g−1) | Reference |
|---|---|---|---|---|
| a The initial coulombic efficiency. | ||||
| Tire-derived carbon | 203 | 66 | 20 | 29 |
| Pitch-derived amorphous carbon | 284 | 88 | 30 | 30 |
| Carbon molecular sieves | 297 | 73 | 100 | 31 |
| Carbonized banana peel | 355 | 67.8 | 50 | 38 |
| Carbonized-leaf | 360 | 74.8 | 10 | 39 |
| Hard carbon microtubes | 315 | 83 | 30 | 41 |
| PHC1400 | 370 | 85.4 | 30 | This work |
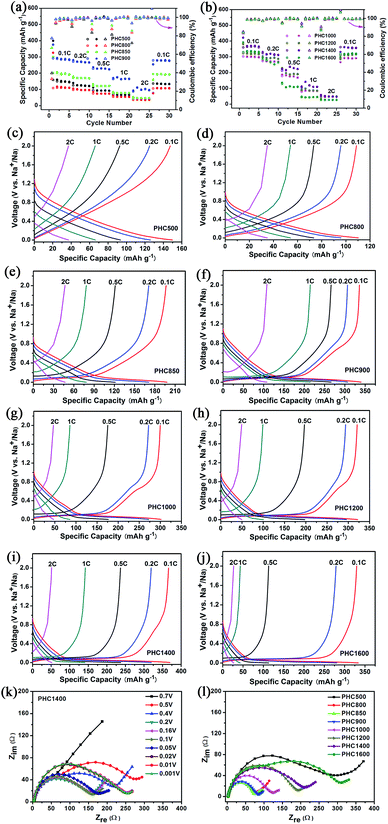
To investigate the overall rate capability of hard carbon anodes derived from pinecone precursor, we performed galvanostatic charge/discharge tests at various current density (Fig. 6a–j). Electrochemical impedance spectra tests for PHC materials are conducted, trying to explain the charge/discharge performance qualitatively (Fig. 6k and l). It is noted that no additional conductive carbon, such as graphene, carbon tube, carbon fiber or carbon black, is added to the PHC electrode. The charge rate and discharge rate are set to be the same. It is worth noting that a recent report points out hard carbon should have good rate capability in 3-electrode cells.32 The results are shown in Fig. 6 and Table 2. All PHC materials recover the capacity of 0.1C rate after experiencing 2C-high-current discharge, indicating stable structure of PHC anodes. The overall rate capability of PHC carbonized at lower temperature is better than that of PHC carbonized at higher temperature. This may be correlated to the different slope capacity contribution of different PHC anodes. Slope capacity is assumed to adsorption mechanism, while plateau capacity is resulting from sodium ion insertion into graphene-like sheets. Adsorption process has faster kinetics than insertion process intrinsically. Our results from EIS tests confirm the same trend. PHC800–1000 has relatively small internal resistance (which can be calculated from the circle diameter). The overall internal resistance increases gradually for PHC1000–1600. As shown in Fig. 6k, the Nyquist plots vary little at around 0.1 V, so EIS data at 0.1 V for all PHC anodes are measured (Fig. 6l).
To evaluate the effect of impurity on the electrochemical properties of PHC materials, we tested cycling performance of washed and unwashed PHC1400 (Fig. 7) at 0.1C (30 mA g−1). The impurities of washed PHC1400 estimated by SEM-EDX tests are obviously less than unwashed sample (shown in Table 4) and the ash ratio decreases from 1.46 to 0.008 wt% after cleaning process. As shown in Fig. 7a and b, the washed PHC1400 exhibits a better cycling performance than unwashed PHC1400. The capacity of washed and unwashed PHC1400 is 328 mA h g−1 and 299 mA h g−1 after 100 cycles, corresponding to capacity retention of 91.1% and 83.3%. Fig. 7c and d show the 1st, 25th, 50th, 75th and 100th discharge/charge profiles of the washed and unwashed PHC1400 electrode at 0.1C (30 mA g−1). The plateau capacity decays faster for unwashed PHC1400 in subsequent cycles. The reason may be that impurities occupy some active sites impeding sodium ion insertion process. And our results confirm that a suitable cleaning process is very essential for preparing high performance hard carbon anode derived from biomass precursor.
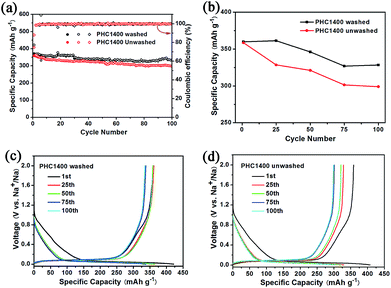 | ||
| Fig. 7 (a, b) Cycling performance of washed and unwashed PHC1400 at 0.1C; (c, d) discharge and charge curves for the 1st, 25th, 50th, 75th and 100th cycles of washed and unwashed PHC1400. | ||
| Sample | C, wt% | O, wt% | Mg, wt% | P, wt% | S, wt% | K, wt% | Ca, wt% | Si, wt% | Ash ratio, wt% |
|---|---|---|---|---|---|---|---|---|---|
| Washed PH1400 | 94.43 | 5.57 | 0 | 0 | 0 | 0 | 0 | 0 | 0.008 |
| Unwashed PHC1400 | 90.88 | 7.82 | 0.08 | 0.18 | 0.06 | 0.70 | 0.10 | 0.18 | 1.46 |
4. Conclusions
In summary, we have synthesized porous hard carbon anode powders derived from abundant natural and low-cost pinecone (PHC) by a simple two-step carbonization process. PHC anode exhibit excellent electrochemical performance that can meet requirements of large-scale commercial application. Our results confirm that high initial coulombic efficiency and stable cycling can be achieved by controlling key synthesis parameters such as carbonization temperature and cleaning process. The effects of carbonization temperature and impurities on the electrochemical performance of PHC materials are carefully investigated. With the increasing of carbonization temperature, the specific surface of all PHC materials decreases, the initial coulombic efficiency and the capacity of the low voltage plateau increase gradually. The PHC carbonized at 1400 °C shows the best electrochemical performance delivering a reversible capacity of 370 mA h g−1 at the current density of 30 mA g−1 and 334 mA h g−1 after 120 cycles, with a high initial coulombic efficiency of 85.4%. These excellent properties suggest that PHC is one of the most promising anode material for large-scale sodium-ion batteries application.Conflicts of interest
There are no conflicts to declare.Acknowledgements
This work was supported by the National Natural Science Foundation of China (U1504521, 51604224) and the Fundamental Research Program from the Ministry of Science and Technology of China (2014CB931704).Notes and references
- S. W. Kim, D. H. Seo, X. Ma, G. Ceder and K. Kang, Adv. Energy Mater., 2012, 2, 710 CrossRef CAS.
- M. D. Slater, D. Kim, E. Lee and C. S. Johnson, Adv. Funct. Mater., 2013, 23, 947 CrossRef CAS.
- J. Zhao, L. Zhao, K. Chihara, S. Okada, J. I. Yamaki, S. Matsumoto, S. Kuze and K. Nakane, J. Power Sources, 2013, 244, 752 CrossRef CAS.
- V. Palomares, P. Serras, I. Villaluenga, K. B. Hueso, J. Carretero-González and T. Rojo, Energy Environ. Sci., 2012, 5, 5884 CAS.
- G. Hasegawa, K. Kanamori, N. Kannari, J. I. Ozaki, K. Nakanishi and T. Abe, ChemElectroChem, 2015, 2, 1917 CrossRef CAS.
- H. Pan, Y. S. Hu and L. Chen, Energy Environ. Sci., 2013, 6, 2338 CAS.
- B. Fu, X. Zhou and Y. Wang, J. Power Sources, 2016, 310, 102 CrossRef CAS.
- S. Komaba, W. Murata, T. Ishikawa, N. Yabuuchi, T. Ozeki, T. Nakayama, A. Ogata, K. Gotoh and K. Fujiwara, Adv. Funct. Mater., 2011, 21, 3859 CrossRef CAS.
- A. Ponrouch, E. Marchante, M. Courty, J. M. Tarascon and M. R. Palacín, Energy Environ. Sci., 2012, 5, 8572 CAS.
- N. Yabuuchi, M. Kajiyama, J. Iwatate, H. Nishikawa, S. Hitomi, R. Okuyama, R. Usui, Y. Yamada and S. Komaba, Nat. Mater., 2012, 11, 512 CrossRef CAS PubMed.
- Y. Qi, L. Mu, J. Zhao, Y. S. Hu, H. Liu and S. Dai, Angew. Chem., Int. Ed., 2015, 127, 10049 CrossRef.
- X. Xiang, K. Zhang and J. Chen, Adv. Mater., 2015, 27, 5343 CrossRef CAS PubMed.
- W. L. Pang, X. H. Zhang, J. Z. Guo, J. Y. Li, X. Yan, B. H. Hou, H. Y. Guan and X. L. Wu, J. Power Sources, 2017, 356, 80 CrossRef CAS.
- L. Wang, Y. Huang and D. Jia, Electrochim. Acta, 2006, 51, 4950 CrossRef CAS.
- Y. Lin, Z. H. Huang, X. Yu, W. Shen, Y. Zheng and F. Kang, Electrochim. Acta, 2014, 116, 170 CrossRef CAS.
- H. Wang, W. Yu, J. Shi, N. Mao, S. Chen and W. Liu, Electrochim. Acta, 2016, 188, 103 CrossRef CAS.
- L. Xiao, Y. Cao, W. A. Henderson, M. L. Sushko, Y. Shao, J. Xiao, W. Wang, M. H. Engelhardc, Z. Nie and J. Liu, Nano Energy, 2016, 19, 279 CrossRef CAS.
- Y. Wen, K. He, Y. Zhu, F. Han, Y. Xu, I. Matsuda, Y. Ishii, J. Cumings and C. Wang, Nat. Commun., 2014, 5, 4033 CAS.
- Z. Wang, L. Qie, L. Yuan, W. Zhang, X. Hu and Y. Huang, Carbon, 2013, 55, 328 CrossRef CAS.
- B. Jache and P. Adelhelm, Angew. Chem., Int. Ed., 2014, 53, 10169 CrossRef CAS PubMed.
- L. Qie, W. Chen, H. Xu, X. Xiong, Y. Jiang, F. Zou, X. Hu, Y. Xin, Z. Zhang and Y. Huang, Energy Environ. Sci., 2013, 6, 2497 Search PubMed.
- H. Liu, M. Jia, B. Cao, R. Chen, X. Lv, R. Tang, F. Wu and B. Xu, J. Power Sources, 2016, 319, 195 CrossRef CAS.
- J. Yang, X. Zhou, D. Wu, X. Zhao and Z. Zhou, Adv. Mater., 2017, 29, 1604108 CrossRef PubMed.
- L. Wu, X. Hu, J. Qian, F. Pei, F. Wu, R. Mao, X. Ai, H. Yang and Y. Cao, J. Mater. Chem. A, 2013, 1, 7181 CAS.
- J. Qian, Y. Chen, L. Wu, Y. Cao, X. Ai and H. Yang, Chem. Commun., 2012, 48, 7070 RSC.
- L. Xiao, Y. Cao, J. Xiao, W. Wang, L. Kovarik, Z. Nie and J. Liu, Chem. Commun., 2012, 48, 3321 RSC.
- H. Pan, X. Lu, X. Yu, Y. S. Hu, H. Li, X. Q. Yang and L. Chen, Adv. Energy Mater., 2013, 3, 1186 CrossRef CAS.
- Y. Park, D. S. Shin, S. H. Woo, N. S. Choi, K. H. Shin, S. M. Oh, K. T. Lee and S. Y. Hong, Adv. Mater., 2012, 24, 3562 CrossRef CAS PubMed.
- Y. Li, M. P. Paranthaman, K. Akato, A. K. Naskar, A. M. Levine, R. J. Lee, S. O. Kim, J. Zhang, S. Dai and A. Manthiram, J. Power Sources, 2016, 316, 232 CrossRef CAS.
- Y. Li, L. Mu, Y. S. Hu, H. Li, L. Chen and X. Huang, Energy Storage Materials, 2016, 2, 139 CrossRef.
- S. W. Zhang, W. Lv, C. Luo, C. H. You, J. Zhang, Z. Z. Pan, F. Y. Kang and Q. H. Yang, Energy Storage Materials, 2016, 3, 18 CrossRef.
- Z. Li, Z. Jian, X. Wang, I. A. Rodríguez-Pérez, C. Bommier and X. Ji, Chem. Commun., 2017, 53, 2610 RSC.
- N. Sun, H. Liu and B. Xu, J. Mater. Chem. A, 2015, 3, 20560 CAS.
- T. Yang, T. Qian, M. Wang, X. Shen, N. Xu, Z. Sun and C. Yan, Adv. Mater., 2016, 28, 539 CrossRef CAS PubMed.
- L. Wu, D. Buchholz, C. Vaalma, G. A. Giffin and S. Passerini, ChemElectroChem, 2016, 3, 292 CrossRef CAS.
- V. Simone, A. Boulineau, A. de Geyer, D. Rouchon, L. Simonin and S. Martinet, J. Energy Chem., 2016, 25, 761 CrossRef.
- X. Meng, P. E. Savage and D. Deng, Environ. Sci. Technol., 2015, 49, 12543 CrossRef CAS PubMed.
- E. M. Lotfabad, J. Ding, K. Cui, A. Kohandehghan, W. P. Kalisvaart, M. Hazelton and D. Mitlin, ACS Nano, 2014, 8, 7115 CrossRef CAS PubMed.
- H. Li, F. Shen, W. Luo, J. Dai, X. Han, Y. Chen, Y. Yao, H. Zhu, K. Fu, E. Hitz and L. Hu, ACS Appl. Mater. Interfaces, 2016, 8, 2204 CAS.
- Y. Li, S. Xu, X. Wu, J. Yu, Y. Wang, Y. S. Hu, H. Li, L. Chen and X. Huang, J. Mater. Chem. A, 2015, 3, 71 CAS.
- Y. Li, Y. S. Hu, M. M. Titirici, L. Chen and X. Huang, Adv. Energy Mater., 2016, 6, 1600659 CrossRef.
- P. Liu, Y. Li, Y. S. Hu, H. Li, L. Chen and X. Huang, J. Mater. Chem. A, 2016, 4, 13046 CAS.
- L. G. Cancado, K. Takai, T. Enoki, M. Endo, Y. A. Kim, H. Mizusaki, A. Jorio, L. N. Coelho, R. M. Paniago and M. A. Pimenta, Appl. Phys. Lett., 2006, 88, 163106 CrossRef.
- C. Wang, J. Huang, H. Qi, L. Cao, Z. Xu, Y. Cheng, X. Zhao and J. Li, J. Power Sources, 2017, 358, 85 CrossRef CAS.
- C. Bommier, T. W. Surta, M. Dolgos and X. Ji, Nano Lett., 2015, 15, 5888 CrossRef CAS PubMed.
- S. Qiu, L. Xiao, M. L. Sushko, K. S. Han, Y. Shao, M. Yan, X. Liang, L. Mai, J. Feng, Y. Cao, X. Ai, H. Yang and J. Liu, Adv. Energy Mater., 2017, 1700403 CrossRef.
Footnote |
| † Electronic supplementary information (ESI) available. See DOI: 10.1039/c7ra07231g |
| This journal is © The Royal Society of Chemistry 2017 |


