 Open Access Article
Creative Commons Attribution 3.0 Unported Licence
Aligned hydroxyapatite nano-crystal formation on a polyamide surface
Di Huang *ab,
Meng Yina,
Qiaoxia Lina,
Yi Qina,
Yan Weia,
Yinchun Hua,
Xiaojie Liana,
Meiqing Guoa,
Jingjing Du*a and
Weiyi Chen*b
aDepartment of Biomedical Engineering, Research Center for Nano-biomaterials and Regenerative Medicine, College of Mechanics, Taiyuan University of Technology, Taiyuan 030024, P. R. China. E-mail: huangjw2067@163.com; dujingjing@tyut.edu.cn; Fax: +86 3513176658; Tel: +86 3513176655
bInstitute of Applied Mechanics & Biomedical Engineering, Shanxi Key Laboratory of Material Strength & Structural Impact, Taiyuan University of Technology, Taiyuan 030024, P. R. China. E-mail: chenweiyi@tyut.edu.cn; Fax: +86 3516010028; Tel: +86 3516018864
First published on 5th September 2017
Abstract
Controlling the orientation of well-crystallized nano-hydroxyapatite (n-HA) remains a difficult task because of the complicated process of n-HA crystallization. In the present research, highly aligned n-HA arrays were fabricated on a polyamide matrix. The oriented n-HA crystals were characterized by scanning electron microscopy (SEM), energy-dispersive X-ray spectroscopy (EDS), high-resolution transmission electron microscopy (HRTEM), X-ray diffraction (XRD), X-ray photoelectric spectroscopy (XPS) and Fourier-transform infrared spectroscopy (FTIR). The mechanism of how these structures form was explored. The results show that the oriented n-HA arrays are formed on a calcium treated polyamide matrix. The diameter of the n-HA columns is about 47.41 ± 3.02 nm. The n-HA crystals grow vertically with the substrate and the length of the crystals is 613.423 ± 61.57 nm. Osteoblast-like MG63 cells were cultured on the nano-crystals in order to demonstrate the biocompatibility of these oriented n-HA crystals. The MTT assay suggests that the oriented n-HA crystals could promote cell proliferation. The overall results indicate the promising potential of oriented n-HA crystals for bone regeneration.
1. Introduction
The intimate relationship between the self-assembled collagen matrix and uniaxially oriented nano-hydroxyapatite (n-HA) crystals provides bone with its remarkable biomechanical properties and remodeling capabilities.1–4 Although extensive studies on n-HA crystallization have been reported, controlling the orientation of well-crystallized n-HA remains a difficult task because of the complicated process of n-HA crystallization.5–8 The general methods for controlling crystal growth involve proteins in mineralization systems in vitro.9–12 However, the frangibility of proteins limits their applications in chemical synthesis. Surfactants, such as polyvinyl alcohol (PVA), sodium dodecyl sulfate (SDS), Tween, and cetyltrimethyl ammonium bromide, are also widely used for the control of apatite mineralization.13–16 These assistants do not ideally direct the growth of n-HA in mimicking hard tissues. A recent study has revealed the role of pre-nucleation clusters in surface-induced calcium phosphate crystallization,17 which suggests that controlling the crystal arrangement of n-HA could be achieved by guiding the aggregation of basic building blocks (Ca, P ions and clusters) during the crystallization process. However, still little is known about the structure and role of these so-called pre-nucleation clusters.18 Up until now, very few examples of well-ordered n-HA structure directed by specific additives have been reported.2,17,19 Liquid-solid-solution strategies with the assistance of linoleic acid or polyaspartic acid have been utilized to prepare the uniaxially oriented apatite crystals.2,20 Huang et al. proposed a new and simple apatite formation scheme by soaking calcium-containing borate glass spheres in alkaline phosphate solutions to yield n-HA particles.21 Unfortunately, the obtained HA particles consisted of randomly oriented nanometer-scale grains with no preferred orientation. Recently, Hayakawa et al. presented a similar strategy by soaking calcium-containing silicate glass substrates in phosphate solution and obtained a nanometer-scale rod array of HA.22 Although the formation mechanism of high oriented n-HA crystals based on silicate glass substrate was totally different with that in bone, the formation process inspired us try using collagen-like organic matrix as substrate by anchoring calcium ions to fabricate oriented n-HA crystals.Owning to its similarity to collagen protein in chemical structure and active groups (for example, –C![[double bond, length as m-dash]](https://www.rsc.org/images/entities/char_e001.gif) O–NH– groups), PA has already been proved to possess good biocompatibility with various human cells and tissues and widely used in biomaterials application.23–26 Pre-treated PA lamina can provide a collagen-like organic matrix by chelating calcium ions on carbonyl groups of the amide chains.27 The calcium-rich micro-environment serves as a dynamic nucleation scaffold that controls and facilitates the formation of highly ordered, elongated apatite crystals. On the basis of the findings, we propose a model of nucleating n-HA and controlling crystal orientation on polymeric matrix. With the help of anchoring calcium ions, a controllable apatite crystal coating was formed assembly on the calcium-nucleating PA matrix in phosphate aqueous solution. Using scanning electron microscopy (SEM), energy-dispersive X-ray spectroscopy (EDS), high-resolution transmission electron microscopy (HRTEM), X-ray diffraction (XRD), and Fourier-transform infrared spectroscopy (FTIR), the mechanism of how these structures form was explored. The osteoblast-like MG63 cells were cultured on the nano-crystals in order to demonstrate the biocompatibility of these oriented n-HA crystals.
O–NH– groups), PA has already been proved to possess good biocompatibility with various human cells and tissues and widely used in biomaterials application.23–26 Pre-treated PA lamina can provide a collagen-like organic matrix by chelating calcium ions on carbonyl groups of the amide chains.27 The calcium-rich micro-environment serves as a dynamic nucleation scaffold that controls and facilitates the formation of highly ordered, elongated apatite crystals. On the basis of the findings, we propose a model of nucleating n-HA and controlling crystal orientation on polymeric matrix. With the help of anchoring calcium ions, a controllable apatite crystal coating was formed assembly on the calcium-nucleating PA matrix in phosphate aqueous solution. Using scanning electron microscopy (SEM), energy-dispersive X-ray spectroscopy (EDS), high-resolution transmission electron microscopy (HRTEM), X-ray diffraction (XRD), and Fourier-transform infrared spectroscopy (FTIR), the mechanism of how these structures form was explored. The osteoblast-like MG63 cells were cultured on the nano-crystals in order to demonstrate the biocompatibility of these oriented n-HA crystals.
2. Experimental
2.1 Materials
Polyamide (PA66) with a viscosity-average molecular weight of 18 kDa was purchased from Asahi Chemical. Calcium chloride (CaCl2, 99%), disodium hydrogen phosphate (Na2HPO4·12H2O, 99%) and sodium hydrous (NaOH) were purchased from Sigma-Aldrich. All chemical reagents were of analytical grade and were used directly without further purification.2.2 PA lamina preparation
PA granules were dried at 80 °C for 24 h in vacuum chamber and molded into lamina specimens of 1 mm thickness by injection molding machine (KTC-200, Kinki, China). The injection temperature ranged from 240 to 270 °C under 30 MPa pressure. Then, the as-prepared PA laminae were cut into rectangle shape of 10 × 40 mm2, cleaned ultrasonically in distilled water and dried at 60 °C for 6 h.2.3 Growth of HA nanorod crystals on PA matrix
In this process, two steps were used for the growth of HA nanorod crystals. The first step was the pre-treatment of PA lamina by calcium solution. Firstly, calcium solution was prepared by dissolving CaCl2 in 400 ml ethanol (0.3 M). The properly cleaned PA laminae were immersed in calcium solution at 37 °C for 12 h. Then, the samples were taken out and dried in the air at room temperature. The second step was growth of HA nanorod crystals on PA substrate. The calcium solution-treated PA laminae were placed vertically in 10 ml phosphate aqueous solution (Na2HPO4, 0.02 M, pH = 12) and reacted at 90 °C for a certain time. Then, the PA laminae were removed from the phosphate solution and rinsed with distilled water 6 times. Finally, the samples were dried at room temperature for 24 h.2.4 Characterization
The etched PA lamina surfaces were characterized by X-ray photoelectron spectroscopy (XPS, XSAM800, UK) and Fourier transform infrared (FTIR) spectroscopy (NEXUS670, USA) in combination with the attenuated total reflectance (ATR) to detect chemical changes during etching. XPS analysis was carried out using Al Kα (1486.6 eV) excitation radiation. After being dried at room temperature in air, n-HA coated PA lamina were subjected to thin-film X-ray diffraction (TF-XRD, Philips X'Pert Pro, Netherlands; CuKα (λ = 1.5406 Å)). The diffractometer was operated at 40 kV, 35 mA. The angle of incident beam was 1°. Scan was performed with 2θ value from 10° to 60° at a rate of 0.05° s−1. The powder sample acquired by annealing the n-HA coated PA lamina at 650 °C for 30 min was characterized using XRD and FTIR was carried out using a FTIR spectrometer in the range of 4000–500 cm−1. The transmission technique was applied and the sample was prepared as standard KBr pellets. The cross-view of n-HA coated PA66 substrate was obtained using a high-speed, water cooled sawing machine (Sherline-5410, USA). The morphology of the n-HA crystals on PA matrix were characterized by SEM (JSM-6500LV, JSM-7100F, Japan) equipped with EDS (OXFORD, X-MaxN, UK). The shapes and crystalline structures of the crystals were studied by HRTEM (FEI-Tecnai F20, Netherlands) accompanying selected area electron diffraction (SAED) and EDS.2.5 Cytocompatibility
Human osteosarcoma cell lines (MG63) were employed to evaluate the cytocompatibility of oriented nano-apatite coated samples. The MG63 cells were provided by West China College of Stomatology, Sichuan University. The samples were cut into discs of ∅ 10 × 1 mm and sterilized by ethylene oxide gas. The disinfected specimens were put in 24-well plates. The MG63 cells were dispersed at a seeding density of 2 × 10⁴ per well onto the specimens and the cultures were maintained at 37 °C in a humidified atmosphere containing 5% CO2 and 95% air for 1, 3 and 5 day(s), respectively. MTT (3-(4,5-dimethylthiazol-2-yl)-2,5-diphenyl-2H-tetrazolium-bromide) assay was selected and the OD values at 570 nm were measured. Three samples were tested for each group. MG63 cells cultured on the specimen for 3 days were rinsed with PBS, fixed at 2.5 percent volume fraction of glutaraldehyde, subjected to graded ethanol dehydration, rinsed with isoamyl acetate, dried with supercritical CO2 and observed with SEM. Prior to examination, each specimen was coated with gold.2.6 Statistical analysis
Data were presented as the means ± standard deviations from at three independent experiments. Two experimental groups were evaluated by Student's t-test. A value of p < 0.05 was considered statistically significant.3. Results and discussion
3.1 Pretreatment of PA substrate
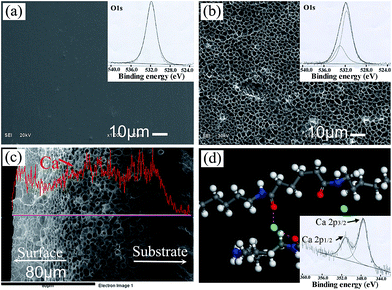
The surface morphologies of PA substrate before and after etching by calcium ethanol solution are shown in Fig. 1. The PA substrate surface appears neat and smooth (Fig. 1a). The O1s XPS spectrum of PA can be considered as the contribution of oxygen in the amide units (–C![[double bond, length as m-dash]](https://www.rsc.org/images/entities/char_e001.gif) O–NH–). There is one expected peak located at 531.9 eV (–C
O–NH–). There is one expected peak located at 531.9 eV (–C![[double bond, length as m-dash]](https://www.rsc.org/images/entities/char_e001.gif) O–NH–).28 After etching and ethanol phase separation completely, the surface becomes rough and presents homogenously porous (Fig. 1b). Two O1s peaks at 531.6 eV (–C
O–NH–).28 After etching and ethanol phase separation completely, the surface becomes rough and presents homogenously porous (Fig. 1b). Two O1s peaks at 531.6 eV (–C![[double bond, length as m-dash]](https://www.rsc.org/images/entities/char_e001.gif) O–NH–) and 532.9 eV appear, where the latter can be attributed to the oxygen with a double bond to carbon and complex with calcium ions (–C
O–NH–) and 532.9 eV appear, where the latter can be attributed to the oxygen with a double bond to carbon and complex with calcium ions (–C![[double bond, length as m-dash]](https://www.rsc.org/images/entities/char_e001.gif) O⋯Ca2+⋯O
O⋯Ca2+⋯O![[double bond, length as m-dash]](https://www.rsc.org/images/entities/char_e001.gif) C–). From the cross section microstructure of the etched PA lamina, about 100 μm porous layer can be seen (Fig. 1c). The EDS line scanning shows Ca element content is increasing from dense substrate to porous etched layer and then keep stable in the etched layer. The schematic in Fig. 1d shows the possible calcium complex sites between PA molecules and calcium ions. This point is verified by Ca2p XPS spectrum. The XPS results show that distinct peaks were detected in the spectra after etching in CaCl2/ethanol solution. The distinct peak near 347.8 eV in the spectra mainly originated from calcium chloride and/or calcium complex sites.24 Therefore, it introduces a chemical bonding for the growth of n-HA crystals on PA matrix by this process.
C–). From the cross section microstructure of the etched PA lamina, about 100 μm porous layer can be seen (Fig. 1c). The EDS line scanning shows Ca element content is increasing from dense substrate to porous etched layer and then keep stable in the etched layer. The schematic in Fig. 1d shows the possible calcium complex sites between PA molecules and calcium ions. This point is verified by Ca2p XPS spectrum. The XPS results show that distinct peaks were detected in the spectra after etching in CaCl2/ethanol solution. The distinct peak near 347.8 eV in the spectra mainly originated from calcium chloride and/or calcium complex sites.24 Therefore, it introduces a chemical bonding for the growth of n-HA crystals on PA matrix by this process.
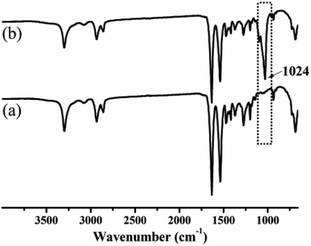
After taken out from the solution, the phase change of ethanol from liquid to gas caused the formation of an inter-connective porous structure. The ATR-FTIR results (Fig. 2) show that the peak at 1024 cm−1 corresponding to the C![[double bond, length as m-dash]](https://www.rsc.org/images/entities/char_e001.gif) O groups is increased after etching.29 It means that the calcium–ethanol complex molecules open the hydrogen bonding between the polymer chains.23 As a result, the polymer chains at the surface of the substrate become loose and complex with calcium ions.23,27 The increased peak at 1024 cm−1 corresponding to the C
O groups is increased after etching.29 It means that the calcium–ethanol complex molecules open the hydrogen bonding between the polymer chains.23 As a result, the polymer chains at the surface of the substrate become loose and complex with calcium ions.23,27 The increased peak at 1024 cm−1 corresponding to the C![[double bond, length as m-dash]](https://www.rsc.org/images/entities/char_e001.gif) O groups in Fig. 2 verify this point.27
O groups in Fig. 2 verify this point.27
3.2 n-HA formation on PA matrix
The orientation of n-HA crystals was further investigated by thin-film X-ray diffraction. As shown in Fig. 3, the peaks at 2θ = 26° and 53° are assigned to the (002) and (004) diffraction of HA (JCPDS no. 09-0432), while the one at about 32° is an envelope of the (211), (112) and (300) diffractions of HA crystals. Two broad patterns around 40° were detected for the PA matrix.26 As for line of 24 h, the relative intensity of (002) diffraction peak is remarkably stronger than that of the other diffractions, showing that the n-HA crystals are preferentially well-oriented in the direction of the c-axis.22,26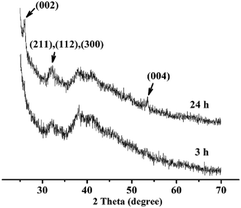 | ||
| Fig. 3 TF-XRD patterns of n-HA crystals grown on PA lamina in phosphate solution (0.02 M, pH = 12) for 3 h (bottom) and 24 h (up). | ||
After treated by calcium ethanol solution, a porous etched layer about 100 μm is formed on PA lamina surface. Two kinds of calcium ions exist in the porous etched layer. One is the chelating calcium ions bonding with the carbonyl groups of PA molecules. The other is the free calcium ions uniformly dispersed in the porous etched layer. Hexagonal sheet-like structures was gained (Fig. 4) when reaction at lower temperature (37 °C). Since a similar sheet-like morphology of HA was observed in SBF, the mild reaction temperature (37 °C) is deduced to cause the two-dimensional growth.30
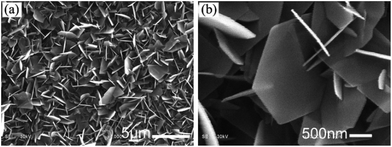 | ||
| Fig. 4 SEM images of the as-prepared HA crystals on PA matrix in phosphate solution (0.02 M, pH = 12) at 37 °C for 3 h: low-magnification (a) and high-magnification (b). | ||
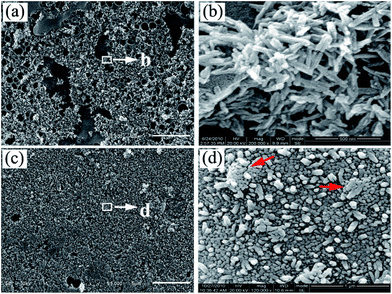
After immersion etched PA lamina into phosphate solution (0.02 M, pH = 12) at 90 °C, an immediate nucleation occurred based on the chelating calcium sites and subsequently n-HA crystals formed. Therefore, there exists a chemical interaction between the substrate and n-HA crystals. After reaction for 3 h, large-area of rod-like n-HA crystals is formed on PA lamina surface (Fig. 5a). The high magnification of the nano-crystals shows that the diameter and length of n-HA rods is about 32.97 ± 3.58 nm and 193.61 ± 11.28 nm, respectively (Fig. 5b). When reaction time increased to 24 h, highly oriented n-HA arrays nearly covered the entire substrate as shown in Fig. 5c. The high magnification of the nano-crystals shows that the diameter of n-HA columns is about 47.41 ± 3.02 nm (Fig. 5d), indicating the continuous growth of n-HA crystals and narrow size distribution comparing with Fig. 5a. Compared with hexagonal sheet-like HA crystals formed at lower temperature (37 °C), nanorod-like HA crystals can be formed at higher temperature (90 °C) as shown in Fig. 5. The possible reason is that the (001) planar has a high free surface energy when reaction at 90 °C, so the growth of crystals along [100] and [010] directions is restrained while preferred growth along the [001] direction. However, further investigation is required to clarify the detailed formation mechanism of the specific morphology.
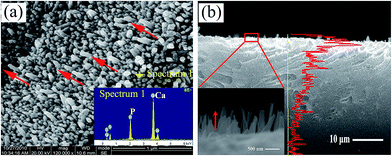
The nanorods arrange regularly along the vertical direction and spontaneously form bundles. Fig. 6a is the tilted view of the nanorods, exhibiting the preferential growth direction along the c-axis. The corresponding energy-dispersive X-ray spectrometer (EDS) result shows the main component of crystals on PA matrix is Ca and P and the Ca/P ratio is about 1.60. The cross view of the sample is shown in Fig. 6b. The inset is the high magnification of the rectangle region and shows the crystals grow vertically with the substrate and the length of the crystals is 613.423 ± 61.57 nm. The Ca element line-scanning demonstrates the Ca element mainly distributes on the surface of the substrate. Compared with Fig. 1c, most of free calcium ions released from the porous etched layer and participated the growth of n-HA rods.
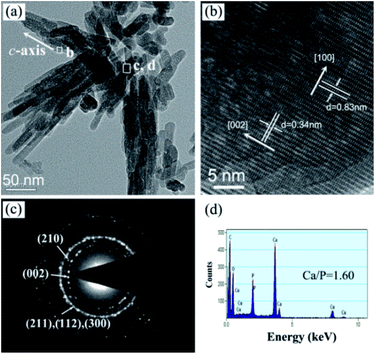
In order to further understand the ultrafine structure of the highly oriented n-HA crystals, HRTEM analyses were performed to characterize their crystal structure. Fig. 7a shows a typical low-magnification image of the n-HA nanorods, indicating the formation of bundles of nanorod-like n-HA crystals. The size of n-HA nanorods is 10–20 nm in diameter and 30–150 nm in length and they are always organized along the longitudinal direction. Fig. 7b shows the HRTEM image recorded in the framed region of Fig. 7a. The crystal lattice planes are perfectly aligned and the lattice spacing is 0.34 nm, corresponding to the interplanar spacing of (002) planes for hexagonal n-HA. This reveals that the growth of n-HA occurs in the [002] direction, indicating the nanorods grow along the c-axis direction of HA. The corresponding SAED pattern (Fig. 7c), taken from the rectangle region in Fig. 7a, exhibits strong concentric ring patterns that can be indexed to the (002), (210), (211), (112) and (300) planes of HA, respectively. The composition of nanorods was investigated using EDS (Fig. 7d). The results indicate that the nanorods are only composed of Ca, P and O. No evidence of other impurities has been found in the EDS data. The Cu and C signals originate from the TEM grid. The Ca/P ratio is about 1.60, indicating a composition similar to the stoichiometric HA, which has a Ca/P ratio of 1.67.
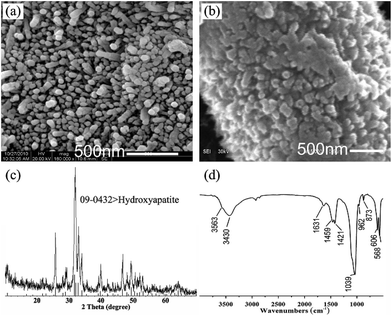
Differently from the previous report (always synthetic micro-scale HA crystals on substrate),5,30,31 we obtained nano-scale HA arrays in this research. The nano-scale of HA crystal gives itself some excellent features, for example, high surface activity. The high oriented n-HA arrays on PA laminae were annealed at relatively low temperature (650 °C) for 30 min in a muffle furnace. From Fig. 8, compared with the origin HA nanorod arrays, the boundary of the crystals fuse together. The diameter of the crystals is increasing from around 45 nm to 90 nm. The results demonstrate that the lower sintering temperature benefits from its high surface energy of nanoscale HA crystals. After annealing at 650 °C for 30 min, the obtained powder was analyzed by conventional XRD and FTIR (Fig. 8c and d). The result of XRD pattern shows that all diffraction peaks can be well indexed to the hexagonal structure of HA (JCPDS no. 09-0432). The peak at 2θ = 25.9°, 31.8°, 32.2° and 32.9° belong to the diffraction peaks of (002), (211), (112) and (300) of HA. The FTIR analysis confirms the typical HA structure. The broad absorption bands around 3430 cm−1 and the bands at 1631 cm−1 are due to incorporated water molecules. The strong and broad bands centered at 1039 and 568 cm−1 are assigned to the v3 P–O stretching and v4 bending modes of the phosphate, respectively. The absorption bands at 1459, 1421 and 873 cm−1 come from v3b, v3a and v2 modes of CO32− replacing PO43−.34 The position of these peaks indicate that the CO32− group substitutes for the PO43− group in the HA (type B of carbonate containing HA), demonstrating that the synthetic HA is similar to the natural bone apatite. The band at 3564 cm−1 arises from the stretching modes of the OH− ions.32,33
3.3 Cytocompatibility
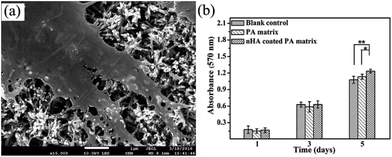
Also, evidence is presented demonstrating the cytocompatibility of these crystals with osteoblast-like MG63 cells. From the photographs, after 3 days culture, the cells with predominant fusiform shape have attached on the surface of the n-HA crystals (Fig. 9a). After 1, 3, and 5 day(s) of culturing, the cell proliferation in each group was assessed using MTT test. As representation in Fig. 9b, after 5 days, the proliferation of cells cultured on oriented n-HA crystals shows signification difference from the pure PA matrix (p < 0.05). The results demonstrate that the oriented n-HA crystals coated samples have superior cytocompatibility.3.4 Formation mechanism of oriented n-HA crystals
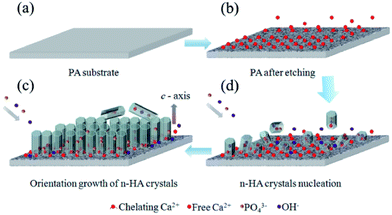
To obtain the oriented n-HA crystals, many more reports adopted surfactant, ions, proteins or hydrothermal method.2,5,13,14 Different from these reports, highly oriented n-HA crystals was obtained just by controlling the chemical conditions in the present research. There are several important factors severely influence the formation of oriented n-HA crystals: (i) pre-treated PA lamina by calcium–ethanol solution. Nucleation of nano-scale HA crystals has a lower free energy barrier of activation than on bare substrate because of the chelating calcium sites formed on the PA surface. The chelating calcium sites can be served as nucleation center for the growth of HA crystals. (ii) Reaction time. As can be seen in Fig. 5, n-HA rods were randomly oriented at low density on the substrate at the early stage (3 h). With the increase of reaction time to 24 h, there is an increase of density and the tropism of n-HA rod arrays. (iii) Reaction temperature. Hexagonal sheet-like structures was gained (Fig. 4) when reaction at lower temperature (37 °C). Since a similar sheet-like morphology of HA was observed in SBF, the mild reaction temperature (37 °C) is deduced to cause the two-dimensional growth.34 Whereas, nanorod-like HA crystals can be formed at higher temperature (90 °C) as shown in Fig. 5.The schematic mechanism is shown in Fig. 10. First, PA lamina with neat and smooth surface is obtained by injection-molded method (Fig. 10a). Then, the PA lamina is treated by calcium ethanol solution at 37 °C for 12 h. In this process, hydrogen bonding between the molecules on PA lamina surface is loosen by calcium–ethanol solution and the carbonyl groups of the amide chains are chelating with Ca2+ ions. These Ca2+ ions bond with PA substrate and can be served as nucleation sites of n-HA crystals. After the phase change of ethanol from liquid to gas, an inter-connective porous structure is formed and some free Ca2+ ions are located in the porous etched layer (Fig. 10b). When immersing into phosphate aqueous solution (0.02 M, pH = 12), immediate nucleation occurs on the PA lamina surface (Fig. 10c). By chelating action, PA substrate selectively adsorbs some co-axis faces, which decreases the interfacial energy of nucleation. These nuclei bond with substrate are stable than the depositions formed in the suspensions. With the increase of reaction time, more Ca2+ ions are released from the porous etched layer and participate in the n-HA crystals growth. Then, to eliminate the high energy face ((001) planar), those n-HA rods grow along the same axis, pack densely and form highly oriented n-HA arrays (Fig. 10d).
4. Conclusions
The present study has introduced new strategy to design highly aligned n-HA arrays on collagen-like matrix. It includes two important findings. One is that, at the early stage, the carbonyl groups of the amide chains capture and complex Ca2+ ions. The complex Ca2+ ions provide the nucleation sites of n-HA crystals, demonstrating the chemical bonding between the matrix and n-HA crystals. On the other hand, the porous etched layer carrying free Ca2+ ions is served as a calcium reservoir. It supplies continuous Ca2+ ions for the growth of n-HA crystals. As a result, highly oriented n-HA arrays based on polymeric matrix are achieved by controlling the chemical conditions. The diameter of n-HA columns is about 47.41 ± 3.02 nm. The n-HA crystals grow vertically with the substrate and the length of the crystals is 613.423 ± 61.57 nm. It provides some information for us to design high surface bioactive, biocompatible and biomechanical matched bone substitutes.Conflicts of interest
There are no conflicts to declare.Acknowledgements
This work has been supported by the Natural Science Foundation of China (Grant no. 11502158, 11632013, 51503140, 51502192). The support of the Natural Science Foundation of Shanxi Province (Grant no. 2015021195, 2014021039-6), International Cooperation Project Foundation of Shanxi Province (Grant no. 201603D421037) is also acknowledged with gratitude.References
- L. Li and C. Ortiz, Nat. Mater., 2014, 13, 501–507 CrossRef CAS PubMed.
- F. Nudelman, K. Pieterse, A. George, P. H. H. Bomans, H. Friedrich, L. J. Brylka, P. A. J. Hilbers, G. d. With and N. A. J. M. Sommerdijk, Nat. Mater., 2010, 9, 1004–1009 CrossRef CAS PubMed.
- K. Tai, F.-J. Ulm and C. Ortiz, Nano Lett., 2006, 6, 2520–2525 CrossRef CAS PubMed.
- K. Tai, M. Dao, S. Suresh, A. Palazoglu and C. Ortiz, Nat. Mater., 2007, 6, 454–462 CrossRef CAS PubMed.
- H. Chen, Z. Tang, J. Liu, K. Sun, S. R. Chang, M. C. Peters, J. F. Mansfield, A. Czajka-Jakubowska and B. H. Clarkson, Adv. Mater., 2006, 18, 1846–1851 CrossRef CAS.
- G. Wang, Z. Lu, X. Zhao, A. Kondyurin and H. Zreiqat, J. Mater. Chem. B, 2013, 1, 2455–2462 RSC.
- A. J. Lausch, B. D. Quan, J. W. Miklas and E. D. Sone, Adv. Funct. Mater., 2013, 23, 4906–4912 CrossRef CAS.
- Z. Zhao, M. Espanol, J. Guillem-Marti, D. Kempf, A. Diez-Escudero and M. P. Ginebra, Nanoscale, 2016, 8, 1595–1607 RSC.
- L. Li, C. Mao, J. Wang, X. Xu, H. Pan, Y. Deng, X. Gu and R. Tang, Adv. Mater., 2011, 23, 4695–4701 CrossRef CAS PubMed.
- Y. Xu, G. Ma, X. Wang and M. Wang, Cryst. Growth Des., 2012, 12, 3362–3368 CAS.
- G. Montoya, J. Arenas, E. Romo, M. Zeichner-David, M. Alvarez, A. S. Narayanan, U. Velázquez, G. Mercado and H. Arzate, Bone, 2014, 69, 154–164 CrossRef CAS PubMed.
- H. Liu, J. Cheng, F. Chen, D. Bai, C. Shao, J. Wang, P. Xi and Z. Zeng, Nanoscale, 2014, 6, 5315–5322 RSC.
- J. Xiao, Y. Zhu, Q. Ruan, Y. Liu, Y. Zeng, F. Xu and L. Zhang, Cryst. Growth Des., 2010, 10, 1492–1499 CAS.
- X. Liu, K. Lin, R. Qian, L. Chen, S. Zhuo and J. Chang, Chem.–Eur. J., 2012, 18, 5519–5523 CrossRef CAS PubMed.
- F. Ye, H. Guo and H. Zhang, Nanotechnology, 2008, 19, 245605 CrossRef PubMed.
- W. Pon-On, S. Meejoo and I. M. Tang, Mater. Chem. Phys., 2008, 112, 453–460 CrossRef CAS.
- A. Dey, P. H. H. Bomans, F. A. Müller, J. Will, P. M. Frederik, G. de With and N. A. J. M. Sommerdijk, Nat. Mater., 2010, 9, 1010–1014 CrossRef CAS PubMed.
- W. J. E. M. Habraken, J. Tao, L. J. Brylka, H. Friedrich, L. Bertinetti, A. S. Schenk, A. Verch, V. Dmitrovic, P. H. H. Bomans, P. M. Frederik, J. Laven, P. van der Schoot, B. Aichmayer, G. de With, J. J. DeYoreo and N. A. J. M. Sommerdijk, Nat. Commun., 2013, 4, 1507 CrossRef PubMed.
- N. L. D'Elia, C. Mathieu, C. D. Hoemann, J. A. Laiuppa, G. E. Santillan and P. V. Messina, Nanoscale, 2015, 7, 18751–18762 RSC.
- X. Wang, J. Zhuang, Q. Peng and Y. D. Li, Adv. Mater., 2006, 18, 2031–2034 CrossRef CAS.
- W. Huang, D. Day, K. Kittiratanapiboon and M. Rahaman, J. Mater. Sci.: Mater. Med., 2006, 17, 583–596 CrossRef CAS PubMed.
- S. Hayakawa, Y. Q. Li, K. Tsuru, A. Osaka, E. Fujii and K. Kawabata, Acta Biomater., 2009, 5, 2152–2160 CrossRef CAS PubMed.
- D. Huang, L. Niu, Y. Wei, M. Guo, Y. Zuo, Q. Zou, Y. Hu, W. Chen and Y. Li, J. R. Soc., Interface, 2014, 11, 20140101 CrossRef PubMed.
- D. Huang, S. Xi, Y. Zuo, Y. Wei, M. Guo, H. Wang, W. Chen and Y. Li, Mater. Lett., 2014, 133, 105–108 CrossRef CAS.
- D. Huang, Y. Zuo, J. Li, Q. Zou, L. Zhang, M. Gong, L. Wang, L. Li and Y. Li, J. R. Soc., Interface, 2012, 9, 1450–1457 CrossRef CAS PubMed.
- H. Wang, Y. Zuo, Q. Zou, L. Cheng, D. Huang, L. Wang and Y. Li, J. Polym. Sci., Part A: Polym. Chem., 2009, 47, 658–669 CrossRef CAS.
- B. Sun, Chin. J. Polym. Sci., 1994, 12, 57–65 CAS.
- J. Shen, Y. Li, Y. Zuo, Q. Zou, J. Li, D. Huang and X. Wang, J. Biomed. Mater. Res., Part B, 2009, 91, 897–904 CrossRef PubMed.
- K. Hamada, M. Kon, T. Hanawa, K. Yokoyama, Y. Miyamoto and K. Asaoka, Biomaterials, 2002, 23, 2265–2272 CrossRef CAS.
- K. Inoue, T. Marukawa, K. Sassa, Y. Yokogawa, Y. Sakka, M. Okido and S. Asai, Mater. Trans., 2003, 44, 1133–1137 CrossRef CAS.
- S. X. Chen, W. S. Wang, H. Kono, K. Sassa and S. Asai, J. Cryst. Growth, 2010, 312, 323–326 CrossRef CAS.
- J. Zhou, X. Zhang, J. Chen, S. Zeng and K. Groot, J. Mater. Sci.: Mater. Med., 1993, 4, 83–85 CrossRef CAS.
- G. Xu, I. A. Aksay and J. T. Groves, J. Am. Chem. Soc., 2001, 123, 2196–2203 CrossRef CAS PubMed.
- H. Ito, Y. Oaki and H. Imai, Cryst. Growth Des., 2008, 8, 1055–1059 CAS.
| This journal is © The Royal Society of Chemistry 2017 |

