DOI:
10.1039/C7RA07150G
(Paper)
RSC Adv., 2017,
7, 39411-39419
Top-down synthesis of zinc oxide based inks for inkjet printing
Received
28th June 2017
, Accepted 6th August 2017
First published on 11th August 2017
Abstract
Developing printed optoelectronic devices based on metal oxide inks requires synthesizing stable suspensions of the desired materials. In this work, pure and manganese doped zinc oxide inks were synthesized by a top-down wet milling route and the role of solvent in ink stabilization and printing was analyzed. Fluid properties of the as-prepared inks were measured and used for studying jettability criteria for inkjet printing. Among the various solvents evaluated, ethylene glycol produced stable oxide inks and satisfied the jetting conditions. The inks were evaluated using a commercial drop-on-demand piezoelectric inkjet printer. The morphology of the patterns printed on glass substrates, for various ink volumes, was investigated and was found to be continuous and showed good optical transmittance. We also investigated the particle segregation in these inks using a custom built direct writing system. This top-down approach, by separating the material development and ink synthesis, can be extended to a variety of metal oxide based inks.
1 Introduction
Thin film based electronic devices have applications in a variety of areas, including energy harvesting and conversion devices, such as, solar cells, solid oxide fuel cells, thin film transistors, and light emitting diodes.1 There is a market driven demand for fabricating high-quality, high resolution patterns with long term reliability, using cost effective techniques and minimal material wastage. In recent years, inkjet printing technique has developed as an inexpensive route to fabricate electronic devices with complex circuits.2 The technology involves direct patterning of the device components on flexible and rigid substrates by dispensing precise volume of material at specific locations on the substrate.3–5 A variety of materials, including organics, polymers, metals, hybrids and oxides can be deposited using inkjet printing and the technique conserves costly processing materials.5–11 Inkjet printing technology has been in widespread use since the 1970s, primarily for printing pigment based inks on paper.12 These printers have evolved from the continuous ink dispensing type into the modern drop-on-demand (DOD) printers, with thermal or piezoelectric print heads. The DOD technology helps in lowering cost since material is ejected only when required, compared to the continuous inkjet type where flow is constant and ink is diverted to a reservoir when not needed.13 Inkjet printing has become an important technology for many applications, such as organic electronics, ceramics, and biopolymer arrays.14
Two general approaches used to prepare nanoparticles are the bottom-up and top-down approach. Both have varying abilities to control particle size, distribution, shape, composition, and degree of agglomeration. In bottom-up chemical synthesis, particle growth and morphology can be controlled by optimizing reaction conditions. There have been extensive reports on nanomaterial preparation using the bottom-up approach by in situ and ex situ reaction.15–18 These include chemical vapor synthesis, pyrolysis, sol–gel synthesis, hydrothermal, and precipitation methods.19–25 Some of these have been adopted from technologies developed for spin and dip coating. There has been limited work on particle ink preparation using top-down approach, mainly using ultrasonication and ball milling.26–31 Top-down approach involves break down of the bulk material into smaller particles, using a mixture of mechanical and chemical processes. Ball milling is a direct and simple operation and its main advantages include low cost of production, the possibility to upscale the process, and chemical uniformity of the product.26 A wide range of nanoparticles can be easily produced, with little process modification, for different materials.32–34
Zinc oxide (ZnO) is widely used in optoelectronic devices due to its direct band gap (3.37 eV) and high exciton binding energy (60 meV at room temperature).35,36 ZnO also possess attractive optical and magnetic properties (pure ZnO is diamagnetic), with doping significantly changing the functional properties.37–41 Reports on ball milling route for preparing inorganic semiconductor inks are scarce, specifically for ZnO based inks. This process produces particles with a varied size distribution, which could lead to lowered mobility of carriers in the film. But electrical and optical properties of printed layers are averaged over the entire film and do not depend significantly on the individual particle sizes.
In this work, ZnO nanoparticle inks have been synthesized using a top-down approach. The particle size was first reduced by milling. These were then dispersed in a suitable solvent, containing an added surfactant, to prevent agglomeration. Depending on the solvent, it was observed that as-synthesized inks were stable for up to a month. The size distribution can be narrowed by filtering the original ink and these filtered inks also showed similar stability against sedimentation. The technique for formulation of the oxide ink and the effect of the solvent on the stability and printability of the ink are explored in this study. Some properties, specifically particle size, are controlled based on the size of the nozzles of the print head of the specific printing system, while flow properties also depend on the print head conditions to a certain extent. We have optimized the ink properties based on existing formulations, which dictate that an ideal ink for a DOD system should have a particle size less than 100 times the nozzle diameter, viscosity and surface tension in the range of 2–20 mPa s and 30–60 mN m−1 respectively.42,43
2 Materials and methods
The starting materials used were zinc oxide and manganese oxide powders, procured from Sigma-Aldrich, of analytical grade purity and particle size between 2–8 μm. We also prepared Mn doped ZnO (MZO) using a solid-state synthesis process by heating pure ZnO and MnO (10 atom% doping) at 1100 °C for 6 h in a conventional muffle furnace.44 Toluene, procured from Merck was used as a milling media for initial particle size reduction, which was carried out using zirconia balls (0.8–2 mm diameter) with a ball to powder ratio of 50![[thin space (1/6-em)]](https://www.rsc.org/images/entities/char_2009.gif) :1 in planetary ball mill Pulverisette (Fritsch, Germany) at a milling speed of 300 rpm. For dispersion of the particles, various solvents were evaluated including glycerol (anhydrous), and ethylene glycol, all procured from Merck. A water based ink was also synthesized and evaluated along with the other solvents. Sodium salt of poly-acrylic acid (PAANa), procured from Sigma-Aldrich, was used as the surfactant.
:1 in planetary ball mill Pulverisette (Fritsch, Germany) at a milling speed of 300 rpm. For dispersion of the particles, various solvents were evaluated including glycerol (anhydrous), and ethylene glycol, all procured from Merck. A water based ink was also synthesized and evaluated along with the other solvents. Sodium salt of poly-acrylic acid (PAANa), procured from Sigma-Aldrich, was used as the surfactant.
2.1 Ink formulation
As received ZnO powder was wet milled in toluene for 12 h to reduce the particle size. To this milled powder, 15 mL of ethanol, 40 mL of solvent, and PAANa were added and the milling was continued. After every eight hours of milling, the dispersion was left untouched overnight to check for sedimentation. It was observed that after 24 h of milling (three 8 h milling periods), a stable ink with uniform suspension was obtained with no visible sedimentation. Thus, the total milling time was 36 h. The various ink formulations are listed in Table 1, labelled PZ1–PZ5 for pure ZnO inks and MZ1 for the MZO ink. In these formulations, the ZnO loading was between 2–4 weight percent. Ethanol evaporates during ball milling because of sample heating and hence its weight was not considered while calculating particle loading. The pure ZnO inks, PZ4 and PZ5, are both ethylene glycol based inks, but with twice the weight loading of ZnO. The MZO ink, designated as MZ1, is also ethylene glycol based, with the same particle loading as PZ4 and PZ5. In case of MZO ink, it was observed that the ink was stable after only 16 h of milling. Morphological inspection of the milled powders was carried out in a FEI Inspect F scanning electron microscope (SEM). Particle sizes were also measured using a transmission electron microscope (TEM), Philips CM 12 operating at 120 keV. Particle size and zeta potential measurements were carried out using Horiba Partica LA 950 analyser. The viscosity of the ink was measured using a DV-II+ Pro EXTRA Brookfield Viscometer and density measurements were performed using an Anton Paar DMA 4500M densitometer. The surface tension and contact angle measurements were performed using Digidrop GBX contact angle meter.
Table 1 Metal oxide ink formulation using various solvents and dispersant amounts. The solvents used are glycerol (G), ethylene glycol (EG), and water. Ethanol (EtOH) is common to all solvents and is added during the milling process. ZnO stands for pure ZnO while MZO is Mn doped ZnO. The surfactant, PAANa, is common for all ink formulations
| Formulation |
Name |
| PZ1 |
PZ2 |
PZ3 |
PZ4 |
PZ5 |
MZ1 |
| Dispersant |
ZnO (1 g) |
ZnO (2 g) |
MZO (2 g) |
| Dispersing media |
15 mL EtOH + 40 mL G |
15 mL EtOH + 40 mL water |
15 mL EtOH + 40 mL EG |
15 mL EtOH + 40 mL EG |
| Surfactant |
PAANa (0.2 g) |
PAANa (0.4 g) |
| Wt% of ZnO |
1.9 |
2.4 |
2.1 |
3.4 |
3.4 |
3.4 |
2.2 Direct writing and inkjet printing setup
The printability of the inks was tested using two different setups. In the first one, a commercially available Epson T60 photo printer was used, which has a piezoelectric print head for dispensing the ink. We also printed patterns using a direct writer setup, which is a customized extrusion based printer manufactured by Tvasta Manufacturing Solution Pvt. Ltd. This setup is equipped with a stage and a print head with a metal nozzle. The print head and the stage can move freely in x and y – directions respectively, while the height of the nozzle from the substrate is fixed. A rotary screw controls the extrusion of the ink through the nozzle. The volume of ink dispensed can be controlled by varying the extrusion speed. The setup also has a provision for heating the stage up to 70 °C. This direct writer setup is controlled by Repetier Host software, which customizes the pattern and printing conditions. The printed patterns were characterized by optical microscopy and SEM. The thickness profile was measured using Nanomap 100 WLI optical profiler. Optical absorption spectra of the printed patterns were collected using a Cary-2000 UV-Vis spectrophotometer.
3 Results and discussion
3.1 Particle size measurement
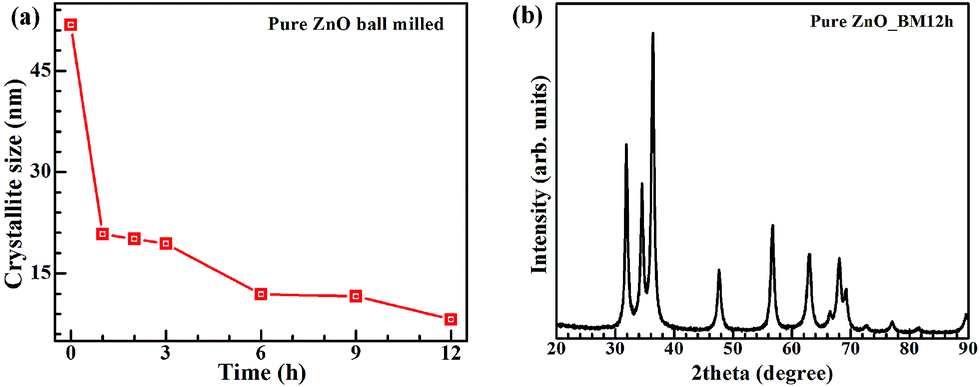
The first step in ink formulation is the reduction of particle size by wet milling. Fig. 1 shows representative SEM images of the particles after different milling times. Initial particle size is of the order of tens of microns, with a mixture of small particles and large aggregates. The particle sizes were reduced to a few hundred nm after milling. Fig. 2(a) shows the change in crystallite size with milling time. Most of the reduction occurs within the first 10 h of milling, with the rate decreasing beyond that. Hence, we restricted the initial milling period to 12 h. Milled powders obtained were confirmed to be crystalline using XRD as shown in Fig. 2(b). The crystallite size was calculated from the XRD pattern using Debye–Scherrer formula.
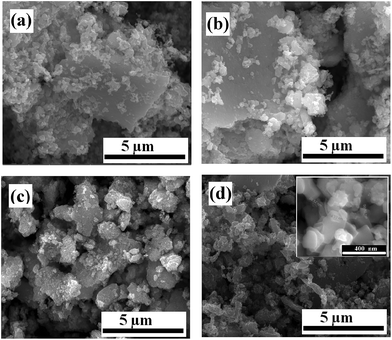 |
| | Fig. 1 SEM micrographs of ball milled zinc oxide powders after different milling times of (a) 1 h, (b) 3 h, (c) 6 h and, (d) 12 h. Initially, the particle size reduction is fast but slows down after about 10 h of milling. Based on this, the milling time was fixed at 12 h. Inset in (d) is the higher magnification SEM image of 12 h milled sample, showing the nanostructured particles. | |
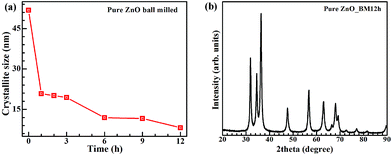 |
| | Fig. 2 (a) Crystallite size reduction as a function of milling time. After 10 h, the reduction in size is minimal. Hence, we have restricted the milling time to 12 h. (b) XRD of ball milled zinc oxide powders after 12 h. The particles are crystalline with peak broadening due to size reduction. The crystallite size is calculated from the XRD pattern using Debye–Scherrer formula. | |
The maximum particle size that can be printed is limited by the nozzle diameter. This is due to agglomeration of particles in the ink, which can cause clogging of the nozzles. In the setups used in this study, the nozzle diameter for the commercial printer is 25 μm, while for the direct writer it is 100 μm. For printing, the ratio of nozzle to particle size should be as high as 100, which limits the required particle size for our work to less than 250 nm. Large particles also increase the probability of precipitation and agglomeration, unless the mixture is constantly agitated or surfactants are included to maintain the particles in dispersion.
For measuring particle size and distribution in the inks, we diluted 50 μL of the ink in 15 mL of ethanol. This was done to avoid multiple scattering. Fig. 3 shows that the particle radii for the as-prepared inks span a broad range, with the highest frequency of the size distribution occurring around 100 nm. The average particle size and standard deviations for the various inks are tabulated in Table 2. The particle size distribution is narrower and the overall size is lower when using ethylene glycol and water as the solvent during the second stage of milling.
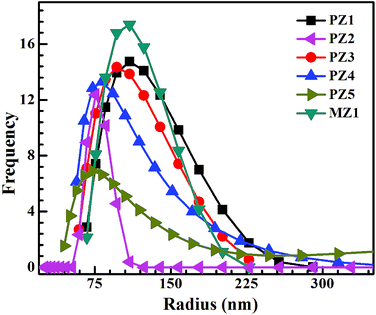 |
| | Fig. 3 Comparison of the particle size distribution as a function of solvent and ZnO loading. PZ1 and PZ3 correspond to glycerol and ethylene glycol inks respectively and show similar size distribution. PZ5 is ethylene glycol ink with double the ZnO loading. The particle size distribution for PZ5 is wider with a longer tail due to this higher particle loading. | |
Table 2 Average particle size and zeta potential values for the as-prepared inks. Water based inks shown smaller particle size distribution than other solvent based inks as well as good zeta potential. Based on the zeta potential values all inks are stable
| As-prepared inks |
Particle radius (nm) |
Zeta potential (mV) |
| PZ1 |
114 ± 31 |
43.7 ± 1.6 |
| PZ2 |
67 ± 19 |
59.4 ± 5.7 |
| PZ3 |
96 ± 28 |
68.6 ± 0.1 |
| PZ4 |
119 ± 28 |
67.9 ± 0.3 |
| PZ5 |
187 ± 20 |
67.3 ± 0.3 |
| MZ1 |
160 ± 27 |
67.1 ± 0.5 |
To check the effect of the increase in the ZnO weight percent, the amount of material was increased to 2 g, with ethylene glycol as the solvent. Fig. 3 shows that the particle size distribution becomes broader with increased ZnO loading, though the peak of the distribution has shifted slightly towards lower values. This can be attributed to greater particle loading, which produces a size distribution with a longer tail.
The as-prepared ink is shown in Fig. 4 and due to the large size distribution, is not suitable for inkjet printing. Hence, the inks were filtered with Whatman paper of pore size 200 nm. Fig. 4(b) shows the PZ1 filtered ink and the TEM image of the particles is shown in Fig. 4(d), with most of them having size less than 100 nm.
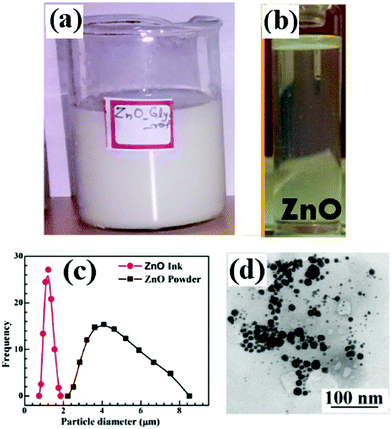 |
| | Fig. 4 Picture of the (a) as-prepared unfiltered and, (b) filtered glycerol (PZ1) ink. (c) Particle size distribution of as received ZnO powder and after ball milling for 12 h. The as prepared ink is filtered using a 200 nm pore size filter, since the print head in the commercial inkjet printer was 25 μm and the particle size cannot be larger than 250 nm (100 times smaller). (d) TEM of the filtered ink shows that most of the particles have size smaller than 100 nm. | |
3.2 Ink stability measurement
The stability of the as-prepared and filtered inks was compared by keeping the inks undisturbed to observe sedimentation. Existing literature on nanoparticle inks have reported stability ranging from one week to one month.42,45
Inks with low stability have to be usually redispersed before use. Our observations show that the stability of the inks depends on the solvent. Glycerol based inks were stable up to a month, while other inks were observed to be stable for more than a week. Water based ZnO ink was observed to be more stable than inks based on ethylene glycol and could be attributed to the lower average particle size obtained after milling. The filtered inks were also observed to have similar stability as the unfiltered inks.
To understand the reasons for the stability and to quantitatively differentiate between the different solvents, we measured the zeta potential, which is the potential difference between the solution and the shear plane at the particle–fluid interface.46 The inks were diluted with ethanol before the measurement. Higher the absolute value of the zeta potential, greater is the stability of the suspension.47 Charge separation in a ZnO particle creates a dipole and this interaction between neighbouring particles is attractive and leads to agglomeration. When a surfactant, such as PAANa is added, it ionizes due to the pH of the solution and forms a layer around the particle. Because ZnO nanoparticles have a negative charge at the surface due to lattice defects48 or due to its dispersion in ethanol (with pH of 7.3),49 the positive part of surfactant (the Na+ ion) will be oriented towards the particle surface and the negative part (the acrylic acid chain) will extend into the solvent. These chains repel each other and keep the suspension stable. The extent of this repulsion is measured by the zeta potential. Table 2 shows the compiled absolute zeta potential values for pure and doped ZnO inks. An absolute potential value greater than 40 mV is a good indication of ink stability50 and the measured values show that all inks are stable. This corroborates our earlier observation that ink sedimentation is not observed up to a month after synthesis. The particle size is smaller for EG based ink than other non-aqueous solvents and it shows the highest value of zeta potential among the pure ZnO inks.
3.3 Jettability measurement of prepared inks
Nanoparticle based inks used in printing are subject to certain physical requirements and constraints to ensure jettability. The principal parameters which decide jettability are density, surface tension, viscosity, and nozzle diameter.51 The nozzle diameter is fixed for a given print head but the other factors depend on the ink and can be varied by changing the ink composition.
3.3.1 Viscosity and surface tension. The viscosity of the ink is the most significant parameter affecting jettability and its value should be in the range of 2–20 mPa s for DOD inks.52,53 A high value of viscosity prevents free flow of the ink on the substrate after printing and it also increases the force required to eject the ink out of the nozzle. Low viscosity inks are also unacceptable because it leads to formation of satellite drops while printing.54 The ink viscosity depends on its components, including dispersant, surfactant, solvent, and/or binding agents. Based on the ink, viscosity can exhibit a very complex dependence on formulation, which affects the extent of shearing as the ink flows through the nozzle. A Newtonian fluid shows linear behaviour between the viscous stress and corresponding shear strain rate and is desirable for printing. We performed viscous shear measurements on the ink formulations and Fig. 5 shows the data for both glycerol and ethylene glycol representative inks. All inks displayed Newtonian behaviour and the viscosity data are listed in Table 3. The water based ink (PZ2) has low viscosity and, despite its good stability, lies at the lower end of the printability range and was not evaluated further. Ethylene glycol inks, for both ZnO and MZO, have viscosity in the correct range for printing. The glycerol based ink (PZ1) has a high viscosity value and was also found to be not suitable for printing.
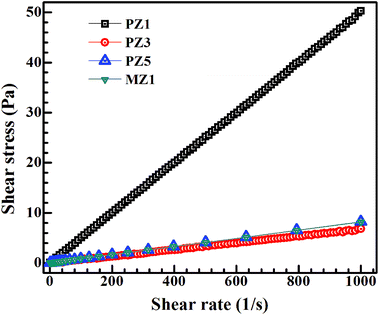 |
| | Fig. 5 Both glycerol and ethylene glycol based inks follow linear stress–strain behaviour, characteristic of a Newtonian fluid, and the slope gives the ink viscosity. This is the desired characteristic of a drop-on-demand inkjet printing. A similar behaviour is observed for the remaining inks and the viscosity values for all inks are compiled in Table 3. | |
Table 3 Ink jettability data for pure and doped ZnO inks. The Z number is calculated using eqn (1). This equation includes the major fluid parameters, such as viscosity, surface tension, and fluid density (values between 1.1 to 1.2 kg m−3). The Z number for ethylene glycol based inks is within the printability range (Z value between 2 and 10)
| Sample ID |
Viscosity@5 s−1 (η; mPa s) |
Surface tension (σ; mN m−1) |
Drop velocity (m s−1) |
Z |
| PZ1 |
88.8 |
60.5 |
0.68 |
0.5 |
| PZ2 |
2.0 |
58.3 |
29.15 |
20.0 |
| PZ3 |
12.1 |
48.9 |
4.04 |
3.0 |
| PZ4 |
10.1 |
55.0 |
5.4 |
3.9 |
| PZ5 |
8.5 |
54.4 |
6.4 |
4.6 |
| MZ1 |
8.7 |
53.9 |
6.2 |
4.4 |
Another important physical parameter to evaluate the printability of a fluid is its surface tension. Surface tension controls the drop formation as the ink is ejected out of the nozzle and the spreading of the ink on a substrate. Ideally, the value must be such that the ink is held in the nozzle without dripping, while allowing an ejected droplet to spread over the substrate to form a continuous film. Surface tension values of the as-prepared inks are shown in Table 3. The values for the various inks are similar, within a narrow range of 48–60 mN m−1. Surface tension is affected by the surfactant adsorption on the particle surface which reduces the dipole attraction forces acting between the ZnO particles. With smaller particle size, the dipole attraction will be lower.53 The surface tension can also be affected by the solvent and surfactant used. In this study, the surfactant is the same and when we look at printability only ethylene glycol inks are found suitable and hence the solvent is also the same.
3.3.2 Jettability. The commercial inkjet printer used in this work has a piezoelectric print head. The ink requirements for this printer include a minimum surface tension of 35 mN m−1, with the viscosity in the range of 8–15 mPa s.54 For inkjet printing, a dimensionless number, called the Ohnesorge number (Oh), incorporates the relevant parameters and is defined as| |
 | (1) |
where η, σ, ρ, and l are the viscosity, surface tension, fluid density, and the nozzle diameter for the printer respectively. The first two parameters are listed in Table 3, while for all prepared inks the density lies between 1.1–1.2 kg m−3. The nozzle diameter for the commercial printer is 25 μm. The inverse of the Ohnesorge number is called the Z number and for good printability, this number should be in the range of 2–10.55–57 The calculated Z number for different ink formulations are also listed in Table 3. Only ZnO-EG inks, for both pure and doped ZnO (PZ3, PZ4, PZ5, and MZ1), satisfy the jettability criteria for printing condition. Therefore, only these inks were chosen for printing.
3.4 Characterization of the printed patterns
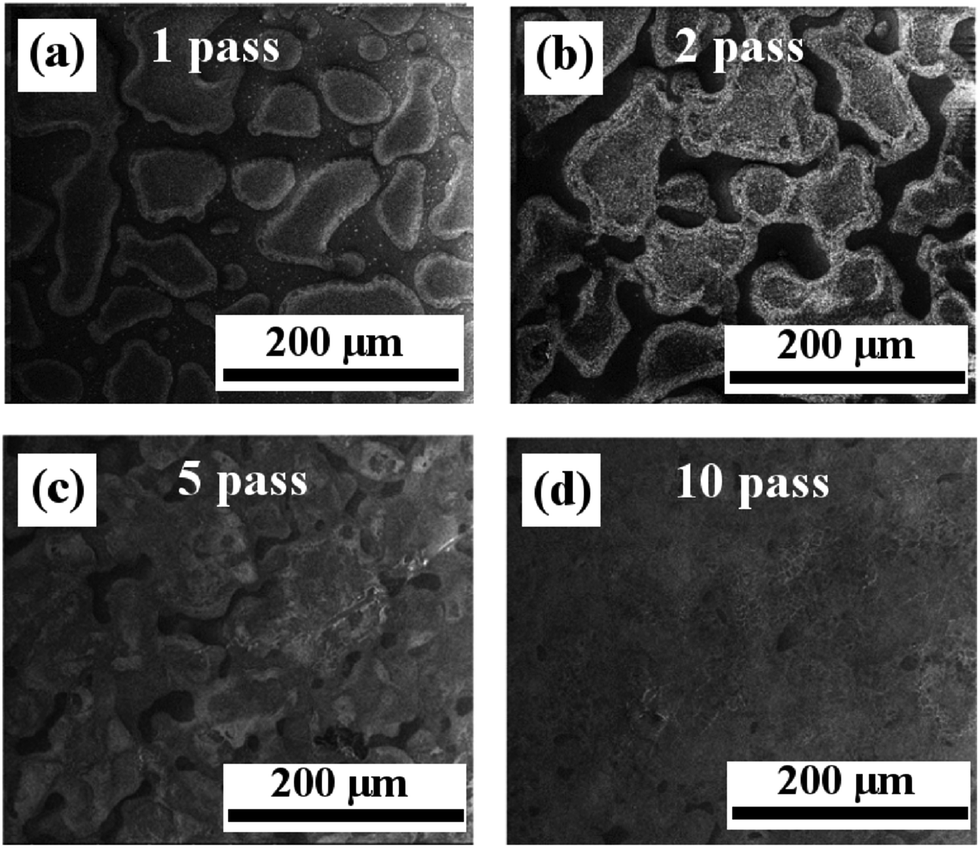
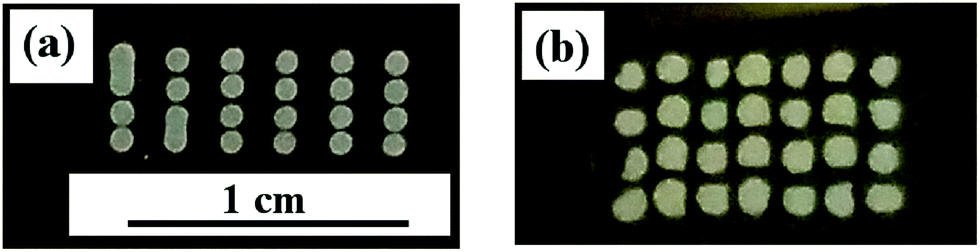
3.4.1 Patterns printed using commercial inkjet printer. ZnO-EG satisfies the jettability condition and it was used for printing with a commercial inkjet printer. Because of the small volume of ink ejected in each pass, multiple passes were required to obtain pattern connectivity. The final patterns, as a function of the number of passes, are shown in Fig. 6. Between the individual passes, the film was dried using a hot air blower, with the blower located below the film. This was done to prevent the flux motion to the drop edge and minimize the coffee-ring effect. SEM images show discontinuity in the printed film for single pass and connectivity gradually improves with increasing number of passes, with continuous films obtained for 5 and 10 passes. Post printing, these patterns were annealed at 200 °C for 3 h. The phrase ‘Thin films’ and ‘Electronics’ was printed on glass substrates using five and ten passes respectively and the phrase ‘ZnO’ was printed on a cleaned silicon substrate using five passes. The images are shown in Fig. 7. The multi pass films were continuous with no visible particle segregation.
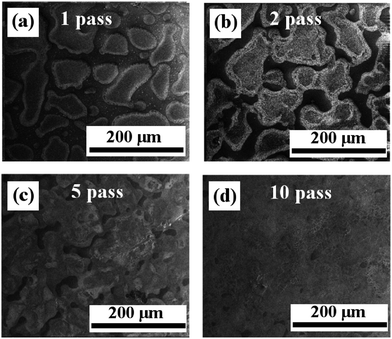 |
| | Fig. 6 SEM micrograph of commercial inkjet printed multi-pass patterns, using PZ4 ink, annealed at 200 °C for 3 h, (a) 1 pass (b) 2 pass (c) 5 pass and (d) 10 pass. Increased number of passes has improved continuity and annealing has caused fusion of the ZnO particles, showing a connected structure. | |
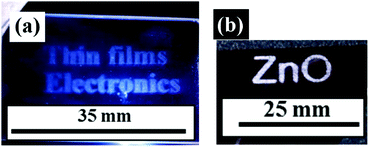 |
| | Fig. 7 Printed patterns of PZ4 ink at room temperature and annealed at 200 °C for 3 h. (a) ‘Thin films’ is printed in 5 passes and ‘Electronics’ in 10 passes on soda lime glass slide. (b) ‘ZnO’ pattern is printed in 10 passes on silicon wafer. Both patterns are continuous. The pattern was dried between individual passes using a hot air blower. | |
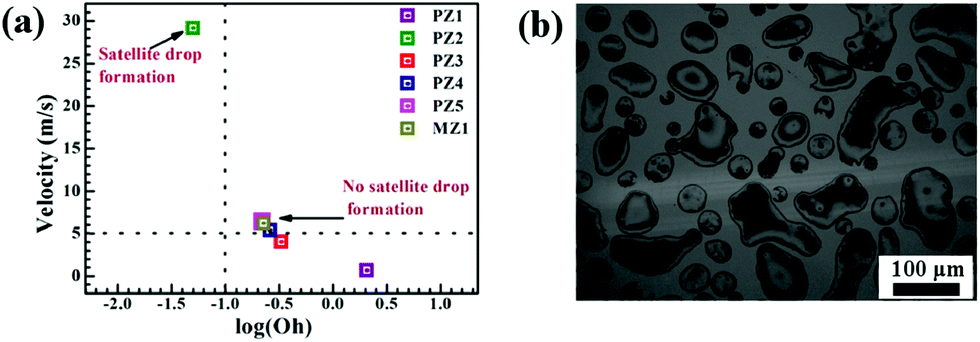
3.4.2 Printed drop analysis. A common occurrence in inkjet printing is the formation of satellite droplets. These are smaller drops jetted between two primary drops, which are formed due to low ink viscosity or a large distance between nozzle and substrate in inkjet printing.58 Existing literature suggest that ethylene glycol (viscosity of 13.35 mPa s and surface tension of 47.9 mN m−1) gives satellite-free drop formation.59,60 Similarly, polymer inclusion in the ink can minimize satellite drop formation.3,48 Our ZnO-EG ink (PZ4, 10.1 mPa s, 55 mN m−1) is the closest in value to existing literature data and hence we expect that this ink will also show minimum satellite drop formation. It is possible to look at the phase space for printability by plotting the log(Oh) versus drop velocity (defined as the ratio of surface tension to viscosity). The plot for our prepared inks is shown in Fig. 8(a) and PZ3, PZ4, and PZ5 inks lie close to the border for satellite to no satellite drop formation.61 PZ1 ink did not satisfy the jettability criteria and its high viscosity precluded the formation of satellite drops. PZ2 ink, lies in the satellite drop formation region because of its low viscosity. To check whether satellite drops are formed in our printed patterns, the optical images of the single pass printing were captured, and one such image is shown in Fig. 8(b). We observed the formation of regular droplets with some smaller droplets seen in the optical micrograph. There are also some merged drops, which have a non-uniform shape compared to the regular droplets. From the analysis of the images it is not possible to completely rule out the formation of the satellite droplets. Droplet formation also depends on the distance between the nozzle head and the substrate and this is fixed for the commercial printer and cannot be changed.
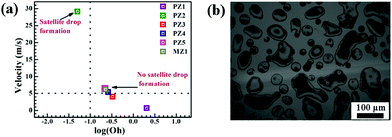 |
| | Fig. 8 PZ3 ink drops deposited in single pass using the commercial inkjet printer. Drops deposited do not show any satellite drop formation. The horizontal and vertical dotted lines represent the boundary between the satellite drop and no satellite drop regions. (a) log(Oh) vs. velocity plot for PZ3, PZ4, PZ5 and MZ1 inks lie at the border of no satellite drop formation.45 (b) Few merged drops can be seen along with regular droplets. There are also some smaller size drops and satellite drop formation cannot be completely ruled out. | |
In inkjet printing, mechanical (acoustic) waves are used to create the drop. Increasing viscosity of the ink dampens this drop, leading to an increase in drive voltage required to create a drop of fixed velocity, and decreasing the drop size at fixed drop velocity. High viscosity also dampens the instabilities that lead to satellite formation. The commercial printer used, operates at a fixed voltage and therefore drops generated from different solvent based inks might have different velocities and sizes. Surface tension provides the key driver for rupture of the liquid ligament.62 The drop velocity should have a range of 0.5–5.0 m s−1 for a typical DOD ink.53,58 The surface tension values and drop velocities for the various inks are listed in Table 3. For getting finer lines and better resolution, we need smaller drop size but at the same time, the number of printing passes need to be increased. In printing of small droplets, connectivity can be maintained since solvent evaporation is faster due to the larger surface area of the drop and segregation will be less. For the larger droplets, fewer passes are required but the end resolution will not be good and coffee-ring effect will be pronounced.
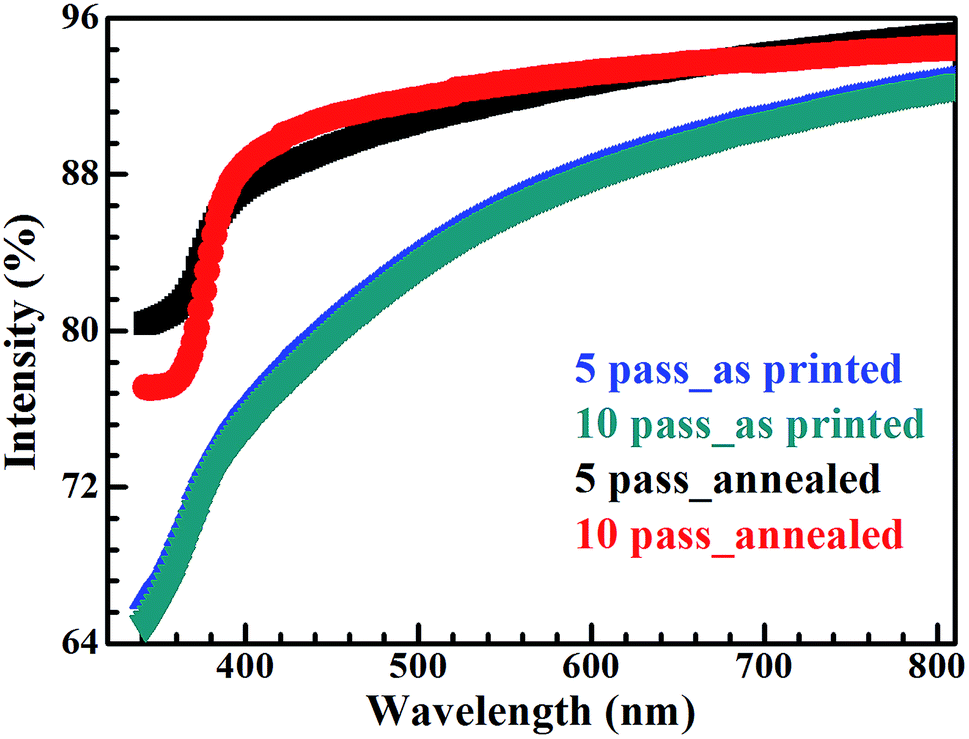
3.4.3 Optical transmittance study. Thin film patterns were printed using PZ4 ink in 5 and 10 passes on a glass slide and then annealed at 200 °C for 3 h. The printed pattern is made of nanoparticles, which fused on increasing the temperature. A spongy structure is observed in SEM images of printed patterns, as shown in Fig. 6. This may be attributed to voids formed due to the solvent removal during heat treatment. This can affect the transmission of light through the structures, since scattering can take place at the pores. Transmittance spectra of as printed and annealed 5 and 10 pass patterns are shown in Fig. 9. For the as-printed pattern, the percentage transmittance was observed to decrease with increase in number of passes. The data for the annealed samples shows that 92% transmittance was observed (typically, 95% transmittance is taken as the requirement for transparent electrodes) and improved transmittance on annealing could be due to evaporation of solvent and surfactant as well as an increase in particle connectivity.
 |
| | Fig. 9 Transmittance spectra of the inkjet printed patterns, using PZ4 ink. Both as printed and annealed 5 pass and 10 pass patterns are included. The films were annealed at 200 °C for 3 h. The annealed patterns have better transmittance than as printed patterns due to elimination of the solvent and better particle interconnectivity. | |
3.4.4 Patterns printed using a custom built direct writer. To study the drying behaviour of the printed patterns, such as the particle segregation at the edges (coffee ring effect), particle–particle connectivity, and thickness profile of the deposit,59,60 drop patterns were printed on a cleaned glass substrate using a custom-built direct writing system. The ink is printed at room temperature and dried post printing. Parameters such as extrusion volume (81 nL per drop), syringe speed (5 mm s−1), substrate temperature (25 °C), and number of passes (1) were optimized for the direct writing system. The extruded volume was measured using the contact angle and radius of the sessile droplet. These printing parameters are optimized such that the drops remain separate and spacing between them is 1 mm, as measured from the centre of one drop to the other. Fig. 10 shows the patterns obtained by depositing individual drops of PZ5 and MZ1 ink.
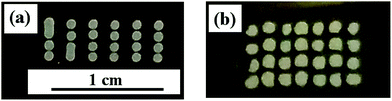 |
| | Fig. 10 Drop patterns of (a) PZ5 (b) MZ1, printed using the direct write system on chemically cleaned glass slides and then annealed at 60 °C for 30 min at atmospheric conditions. Deposited volume for each droplet is approximately 80 nL and spacing between droplets is maintained around 0.1 mm. The scale bar is the same for both images. | |
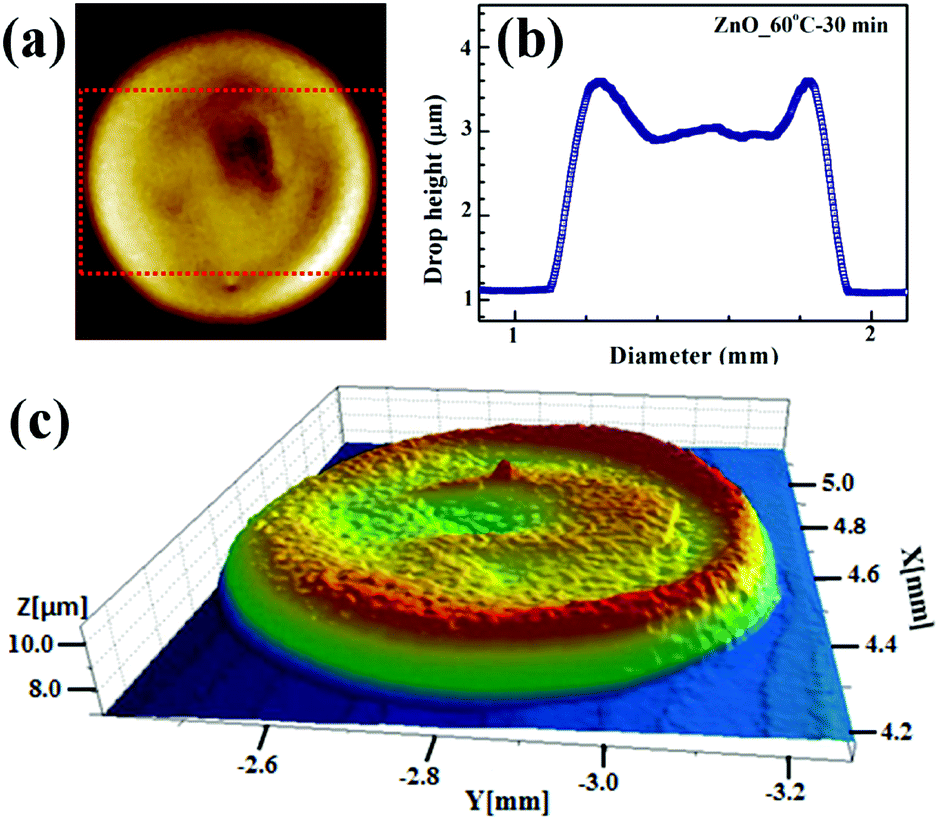
After annealing, the roughness and thickness of the drop patterns were quantified using an optical profiler, while particle continuity was studied using optical and electron microscopy. The effect of temperature was studied by annealing the patterns at 100 °C and 60 °C for 30 min. At 100 °C, large cracks were visible and there is a distinct ring formation due to irregular ethylene glycol evaporation, as seen in Fig. 11.
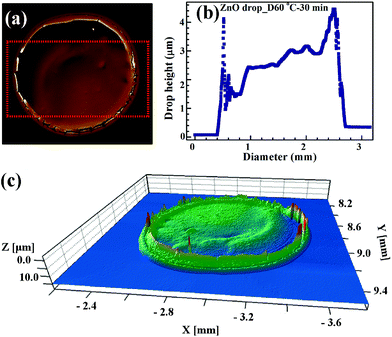 |
| | Fig. 11 ZnO drop dried at 100 °C for 30 min in a hot air oven. (a) Optical image shows the presence of large sized cracks in the drop, (b) line profile of the dried drop (from the red dotted region marked in (a)) shows material accumulation and consequent ring formation at the edges. (c) The 3D profile of the drop shows the non-uniform thickness profile. The crack is also visible in the 3D profile. The colour represents the height variation. | |
On the other hand, uniformly dried drops (without any crack and coffee ring influence) were obtained by drying patterns at 60 °C for 30 min, as shown in Fig. 12. Drop diameter measured using the profiler was 0.81 ± 0.02 mm with height of 2.62 ± 0.11 μm.
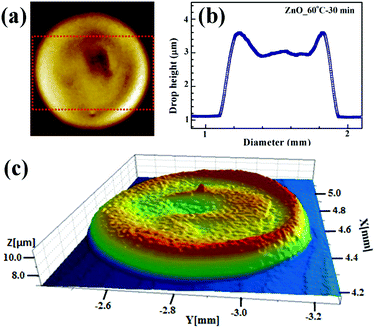 |
| | Fig. 12 ZnO drop dried at 60 °C for 30 min in hot air oven. (a) Optical image shows relatively crack-free surface, (b) line profile (from the red dotted region marked in (a)) shows uniform drying with some particle accumulation still seen at the edges. (c) This minor variation in thickness from the rim to the centre of drop can be seen clearly in the 3D image. | |
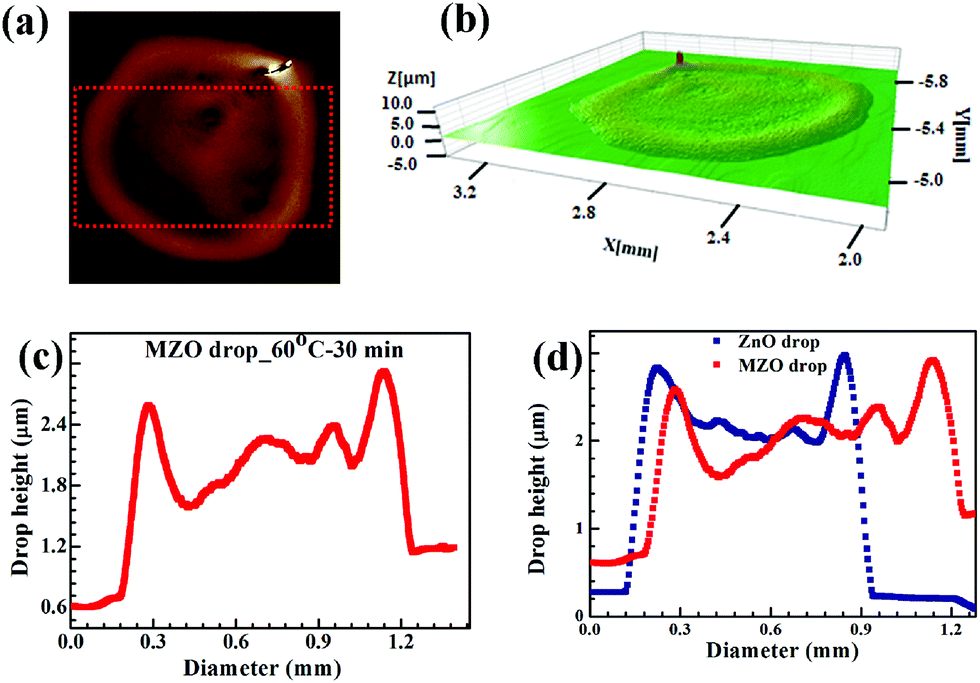
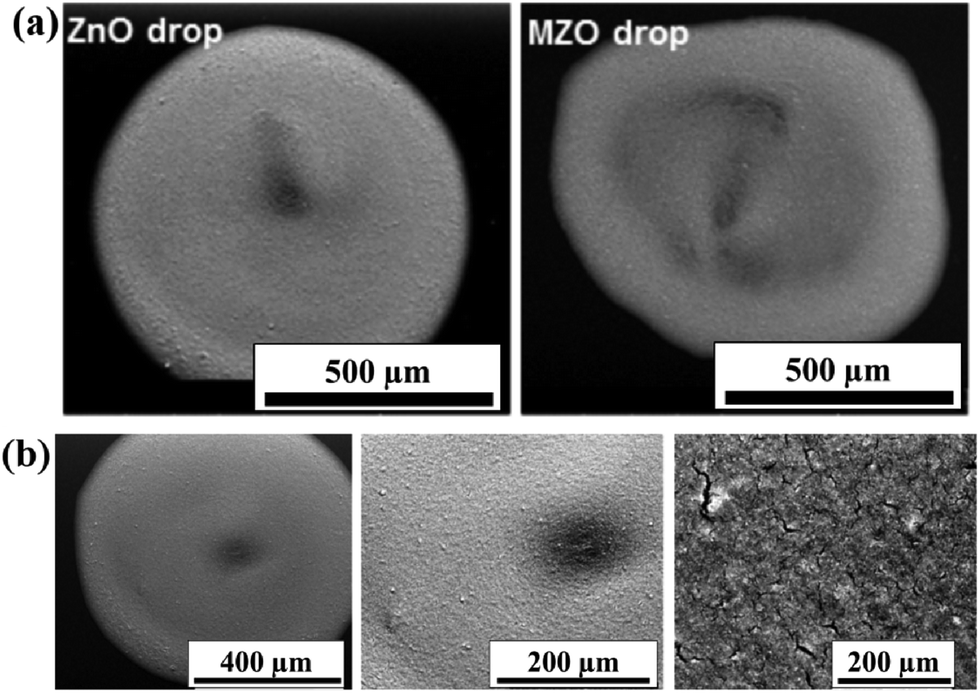
MZO ink drops were also printed under the same conditions and dried at 60 °C for 30 min. Comparison of thickness profile of pure and doped ZnO drops in Fig. 13 showed better wettability by MZO than pure ZnO and that results in a larger drop diameter of 1.06 ± 0.02 mm with a correspondingly smaller thickness of 1.84 ± 0.13 μm for the same extruded volume. This can be understood in terms of the surface tension and surface charge on the MZO particle. ZnO doped with Mn demonstrated lower ferromagnetism than pure ZnO.63 As a result, MZO ink possesses lower surface tension than pure ZnO, as shown in Table 3, and thus better wettability on the substrate. SEM micrographs of pure and doped ZnO dried patterns in Fig. 14 shows a uniform distribution in the drop. The higher magnification images show particle connectivity despite the presence of micro-cracks.
 |
| | Fig. 13 MZO drop dried at 60 °C for 30 min in hot air oven. (a) Optical image shows crack free deposited pattern with a larger drop size for same volume of ink, (b) 3D optical profile of the dried drop and, (c) line profile of the thickness variation from rim to the centre of a single drop. (d) Comparison of the thickness profiles of ZnO and MZO drops, with same drop volume, shows a larger drop size with smaller thickness for MZO. This indicates greater wettability for the MZO drop. | |
 |
| | Fig. 14 SEM micrograph of (a) PZ5 and MZ1 drop dried at 60 °C for 30 min. (b) Higher magnification images of PZ5 drop dried at 60 °C for 30 min shows good particle connectivity, despite the presence of micro cracks. | |
4 Conclusion
We describe the synthesis of metal oxide nanoparticle inks by a top-down wet milling approach and the role of the solvent in maintaining the ink stability and printability. We concentrated on two systems, pure and manganese doped zinc oxide. In MZO, the doping was achieved by a solid-state reaction, independent of the ink synthesis. The ink parameters including zeta potential, viscosity, surface tension, and Z number were calculated for the various solvents and it was found that ethylene glycol based inks have better jettability. These inks were observed to be stable against sedimentation up to a month and the particle size distribution could be narrowed by filtration. These filtered inks were tested by printing drops and word patterns using a commercial inkjet printer and a custom-built direct writer. The patterns showed uniform deposition with minimal particle segregation at the rims. The annealed patterns showed high transmittance in the visible region. To conclude, we have produced ethylene glycol based inkjet printable pure and doped zinc oxide inks by a top-down wet milling approach, which is scalable from an industry point of view. By decoupling doping and ink synthesis, it is possible to adapt this method for a variety of metal oxides, including binary, ternary and complex oxide systems. For these systems, optimization of the ink, in terms of particle loading, surfactant type and concentration, and the solvent volume will have to be carried out. Future work will involve extending this process to other metal oxide based systems. This will aid in the fabrication of all printed oxide electronic devices.
Conflicts of interest
There are no conflicts to declare.
Acknowledgements
This research was supported by a New Faculty Seed Grant, IIT Madras. Ball milling, SEM, TEM, and thickness measurement were carried out in facilities available in the Department of Metallurgical and Materials Engineering, IIT Madras, while viscosity, density, and particle size measurements were done in the facilities available in the Department of Chemical Engineering, IIT Madras. Surface tension was measured in the Department of Applied Mechanics, IIT Madras. UV-visible measurement was performed in the Department of Physics, IIT Madras.
References
- E. B. Duoss, M. Twardowski and J. A. Lewis, Adv. Mater., 2007, 19, 3485 CrossRef CAS.
- J. Li, F. Rossignol and J. Macdonald, Lab Chip, 2015, 15, 2538 RSC.
- J. Alamán, R. Alicante, J. I. Peña and C. Sánchez-Somolinos, Materials, 2016, 9, 910 CrossRef PubMed.
- J. W. Boley, E. L. White, G. T. C. Chiu and R. K. Kramer, Adv. Funct. Mater., 2014, 24, 3501 CrossRef CAS.
- Y. Zheng, Z. He, Y. Gao and J. Liu, Sci. Rep., 2013, 3, 1786–1793 CrossRef.
- B. J. De Gans, P. C. Duineveld and U. S. Schubert, Adv. Mater., 2004, 16, 203 CrossRef CAS.
- Y. J. Kwon, Y. D. Park and W. H. Lee, Materials, 2016, 9, 650 CrossRef PubMed.
- B. Derby, J. Mater. Chem., 2008, 18, 5717 RSC.
- A. Maddaus, P. Curley, M. A. Griswold, B. D. Costa, S. Hou, K. J. Jeong, E. Song and L. F. Deravi, Biointerphases, 2016, 11, 041002 CrossRef.
- S. Jeong, D. Kim and J. Moon, J. Phys. Chem. C, 2008, 112, 5245 CAS.
- Y. Yang, S. C. Chang, J. Bharathan and J. Liu, J. Mater. Sci.: Mater. Electron., 2000, 1(1), 89 CrossRef.
- W. Schwindt and G. Faulhaber, Rev. Prog. Color. Relat. Top., 1984, 14, 166 CrossRef CAS.
- H. P. Le, J. Imaging Sci. Technol., 1998, 42, 49–62 CAS.
- M. Singh, H. M. Haverinen, P. Dhagat and G. E. Jabbour, Adv. Mater., 2010, 22, 673 CrossRef CAS PubMed.
- A. Chiolerio and M. Sangermano, Mater. Sci. Eng., B, 2012, 177, 373 CrossRef CAS.
- A. Kouloumpis, K. Syrou, K. Dimos, V. Georgakilas, P. Rudolf and D. Gournis, Front. Mater., 2015, 2, 10 Search PubMed.
- G. V. Ramesh, S. Porel and T. P. Radhakrishnan, Chem. Soc. Rev., 2009, 38, 2646 RSC.
- S. Porel, S. Singh, S. S. Harsha, D. N. Rao and T. P. Radhakrishnan, Chem. Mater., 2005, 17, 9 CrossRef CAS.
- K. Vernieuwe, D. Cuypers, C. E. A. Kirschhock, K. Houthoofd, H. Vrielinck, J. Lauwaert, J. D. Roo, J. C. Martins, I. V. Driessche and K. D. Buysser, J. Alloys Compd., 2017, 690, 360 CrossRef CAS.
- C. C. Chen, P. Liu and C. H. Lu, Chem. Eng. J., 2008, 144, 509 CrossRef CAS.
- W. An, E. Thimsen and P. Biswas, J. Phys. Chem. Lett., 2010, 1, 249 CrossRef CAS.
- B. Suryanto, X. Lu and C. Zhao, J. Mater. Chem. A, 2013, 1, 12726 CAS.
- K. Okuyama and I. Wuled Lenggoro, Chem. Eng. Sci., 2003, 58, 537 CrossRef CAS.
- J. Sierra-Pallares, T. Huddle, J. García-Serna, E. Alonso, F. Mato, I. Shvets, O. Luebben, M. Cocero and E. Lester, Nano Res., 2016, 9, 3377 CrossRef CAS.
- K. Hong, S. H. Kim, K. H. Lee and C. Frisbee, Adv. Mater., 2013, 25, 3413 CrossRef CAS PubMed.
- P. Giri, S. Bhattacharyya, D. Singh, R. Kesavamoorthy, B. Panigrahi and K. Nair, J. Appl. Phys., 2007, 102, 093515 CrossRef.
- R. H. Müller and J. U. Junghanns, Int. J. Nanomed., 2008, 3, 295 CrossRef.
- M. H. Pahl, Zerkleinerungstechnik, TÜV Rheinland GmbH, Cologne, 1991 Search PubMed.
- Z. Loh, A. Samanta and P. Sia Heng, Asian J. Pharm. Sci., 2015, 10, 255 CrossRef.
- W. Yang and C. Wang, J. Mater. Chem. C, 2016, 4, 7193 RSC.
- A. S. Asvarov, A. K. Akhmedov, A. K. Abudev, A. E. Muslimov and A. Chiolerio, Crystallogr. Rep., 2017, 62, 144 CrossRef CAS.
- S. Amirkhanlou, M. Ketabchi and N. Parvin, Mater. Lett., 2012, 86, 122 CrossRef CAS.
- N. Salah, S. S. Habib, Z. H. Khan, A. Memic, A. Azam, E. Alarfaj, A. Zahed and S. Al-Hamedi, J. Nanomater., 2011, 6, 863 CAS.
- T. P. Yadav, R. M. Yadav and D. P. Singh, Nanosci. Nanotechnol., 2012, 2, 22 CrossRef.
- M. Milanese, G. Colangelo, A. Cretì, M. Lomascolo, F. Iacobazzi and A. de Risi, Sol. Energy Mater. Sol. Cells, 2016, 147, 321 CrossRef CAS.
- C. T. Liu, W. H. Lee and T. L. Shih, J. Nanotechnol., 2012, 8, 2012 Search PubMed.
- S. Sharma, R. Bayikadi and P. Swaminathan, RSC Adv., 2016, 6, 86586 RSC.
- M. Laurenti, S. Porro, C. F. Pirri, C. Ricciardi and A. Chiolerio, Crit. Rev. Solid State Mater. Sci., 2017, 42(2), 153–172 CrossRef CAS.
- M. Laurenti, A. Verna and A. Chiolerio, ACS Appl. Mater. Interfaces, 2015, 7, 24470 CAS.
- M. Laurenti, M. Castellino, D. Perroneov, G. Canavese and A. Chiolerio, Sci. Rep., 2017, 7, 41957 CrossRef CAS PubMed.
- M. I. Dar, N. Arora, N. P. Singh, S. Sampath and S. A. Shivashankar, New J. Chem., 2014, 38, 4783 RSC.
- A. Kosmala, R. Wright, Q. Zhang and P. Kirby, Mater. Chem. Phys., 2011, 129, 1075 CrossRef CAS.
- G. Vescio, J. López-Vidrier, R. Leghrib, A. Cornet and A. Cirera, J. Mater. Chem. C, 2016, 4, 1804 RSC.
- S. Sharma, P. Ramesh and P. Swaminathan, J. Electron. Mater., 2015, 44, 4710 CrossRef CAS.
- T. T. Baby, S. K. Garlapati, S. Dehm, M. Häming, R. Kruk, H. Hahn and S. A. Dasgupta, ACS Nano, 2015, 9, 3075 CrossRef CAS PubMed.
- E. C. Donaldson and W. Alam, Wettability, Elsevier, 2013 Search PubMed.
- B. Shahmoradi, K. Soga, S. Ananda, R. Somashekar and K. Byrappa, Nanoscale, 2010, 2, 1160 RSC.
- M. Schmitt, Nanoscale, 2015, 7, 9532 RSC.
- C. Tso, C. Zhung, Y. Shih, Y. Tseng, S. Wu and R. Doong, Water Sci. Technol., 2010, 61, 127 CrossRef CAS PubMed.
- A. Mikolajczyk, A. Gajewicz, B. Rasulev, N. Schaeublin, E. Maurer-Gardner, S. Hussain, J. Leszczynski and T. Puzyn, Chem. Mater., 2015, 27, 2400 CrossRef CAS.
- A. Teichler, J. Perelaer and U. S. Schubert, J. Mater. Chem. C, 2013, 1, 1910 RSC.
- W. D. Teng, M. J. Edirisinghe and J. R. G. Evans, J. Am. Ceram. Soc., 1997, 80, 486 CrossRef CAS.
- S. D. Hoath, G. D. Martin and I. M. Hutchings, J. Imaging Sci. Technol., 2010, 26, 10 Search PubMed.
- S. Tanvir and L. Qiao, Nanoscale Res. Lett., 2012, 7, 226 CrossRef PubMed.
- B. Derby, Annu. Rev. Mater. Res., 2010, 40, 395 CrossRef CAS.
- P. Calvert, Chem. Mater., 2001, 13, 3299 CrossRef CAS.
- D. Jang, D. Kim and J. Moon, Langmuir, 2009, 25, 2629 CrossRef CAS PubMed.
- W. V. Hoeve, S. Gekle, J. H. Soneijer, M. Versluis, M. P. Brehner and D. Lohse, Phys. Fluids, 2010, 22, 122003 CrossRef.
- R. J. Furbank and J. F. Morris, Phys. Fluids, 2004, 16, 1070 Search PubMed.
- M. H. Tsai and W. S. Hwang, Mater. Trans., JIM, 2008, 49, 331 CrossRef CAS.
- S. D. Hoath, I. M. Hutchings, G. D. Martin, T. R. Tuladhar, M. R. Mackley and D. Vadillo, J. Imaging Sci. Technol., 2009, 53, 041208 CrossRef.
- J. Eggers and E. Villermaux, Rep. Prog. Phys., 2008, 71, 036601 CrossRef.
- D. E. Motaung, I. Kortidis, G. H. Mhlongo, M. M. Duvenhage, H. C. Swart, G. Kiriakidis and S. S. Ray, RSC Adv., 2016, 6, 26227 RSC.
|
| This journal is © The Royal Society of Chemistry 2017 |
Click here to see how this site uses Cookies. View our privacy policy here. 
 Open Access Article
 This Open Access Article is licensed under a
  *a
*a