DOI:
10.1039/C7RA07113B
(Paper)
RSC Adv., 2017,
7, 40922-40928
A first-principles study of anionic (S) and cationic (V/Nb) doped Sr2Ta2O7 for visible light photocatalysis
Received
27th June 2017
, Accepted 14th August 2017
First published on 22nd August 2017
Abstract
In order to effectively utilize the visible solar light to catalyze and decompose water into hydrogen and oxygen, the ultraviolet light responsive photocatalyst Sr2Ta2O7 is engineered via co-doping of the anionic (S) and cationic (V/Nb) to shift the VBM (valence band maximum) upward and CBM (conduction band minimum) downward by approximately 1 eV, respectively. By first principles study (GGA-PBE), it is discovered that the VBM of (S, V) co-doped Sr2Ta2O7 is shifted upward by 1.14 eV while the CBM of this system is shifted downward by 0.68 eV, which is due to the appearance of impurity states near the VBM and CBM, respectively. For (S, Nb) co-doped Sr2Ta2O7, the VBM is shifted upward by 0.74 eV and the CBM is shifted downward by 0.63 eV. No impurity states of Nd are created, neither near the CBM nor in the band gap for (S, Nb) co-doped case, probably because the Sr2Ta2O7 is essentially isostructural with Sr2Nb2O7. For these two systems mentioned above, it could be a feasible way for Sr2Ta2O7 photocatalyst on water splitting under UV irradiation to convert into the visible light-utilizing material without introducing extra electrons or holes.
1. Introduction
Alternative sources of energy have been widely searched for over several decades due to the depletion of fossil fuel resources and increasingly serious environmental problems. It is quite possible for hydrogen to be the candidate. Today 95% of hydrogen in the world is produced via steam reforming of fossil fuels, which generates considerable greenhouse gases.1 Hence, it is necessary to seek a feasible way for hydrogen production. A multitude of tantalates and niobates based layered perovskite structures, including Sr2Ta2O7 and Sr2Nb2O7,2,3 have received intense attention as promising photocatalyst materials for water splitting and hydrogen production owing to their high photocatalytic activity, compared with the standard known bulk type of materials such as TiO2.4 It is reported that Sr2Ta2O7 shows activities for water splitting into H2 and O2 in pure water even without additives under UV irradiation because of its high conduction level and the surface catalytic ability for H2 evolution.2 For strontium tantalates, the conduction band will become narrower and the band gap increases by the same amount when the bond angle O–M–O decreases from 180°. The bond angle O–Ta–O is close to 180° in Sr2Ta2O7 which approaches to an ideal perovskite structure, thus implying that the excitation energy is more delocalized and the photo-generated electron–hole pairs in Sr2Ta2O7 can more easily move.2,5,6 Although Sr2Ta2O7 is promising as the UV-light driven photocatalyst, it still fails to utilize effectively solar energy, especially for the region of visible light.
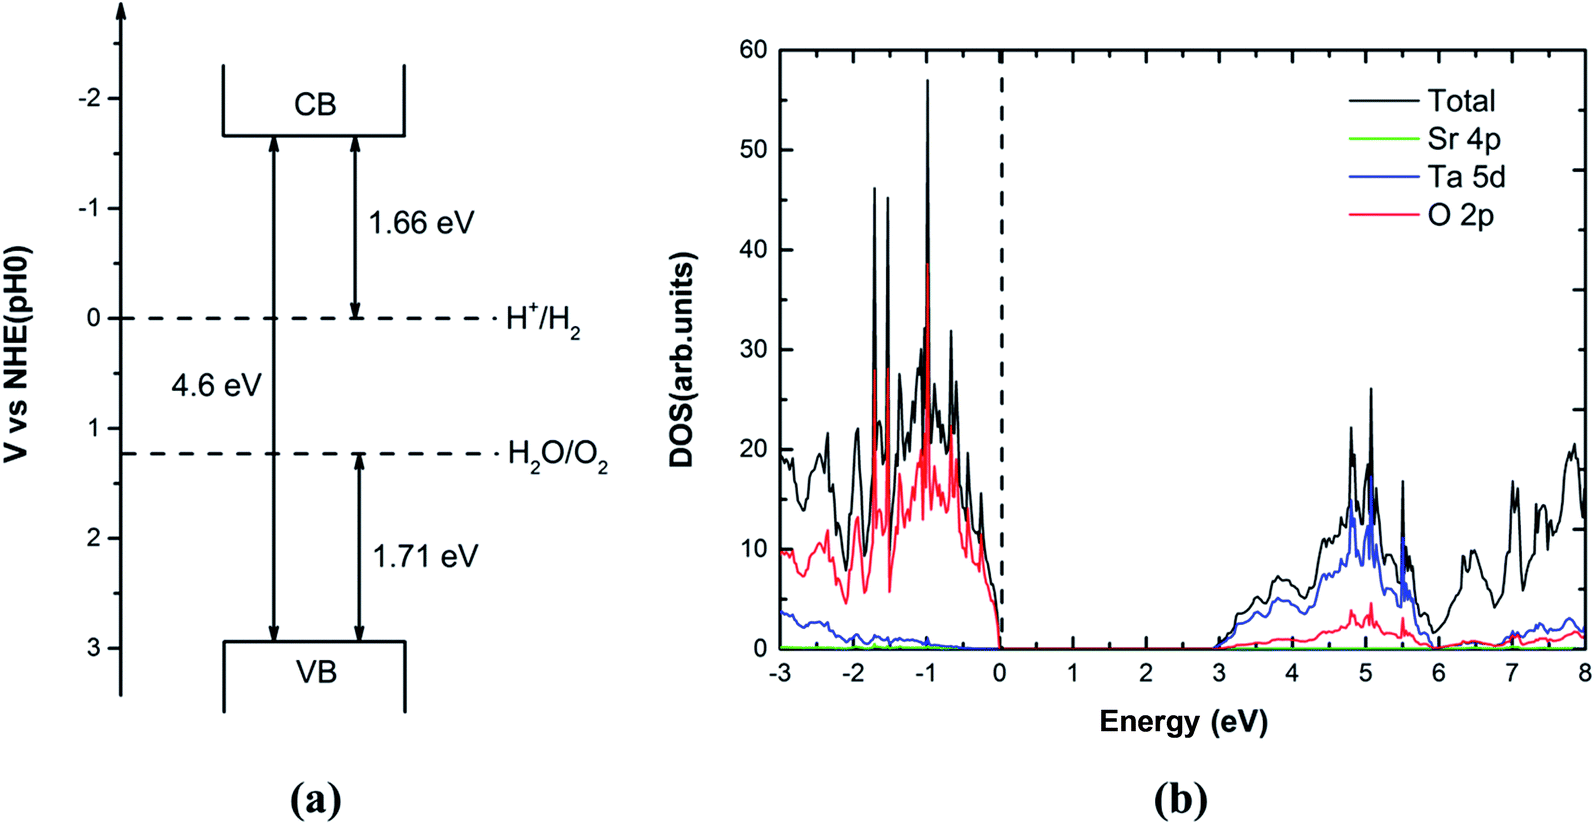
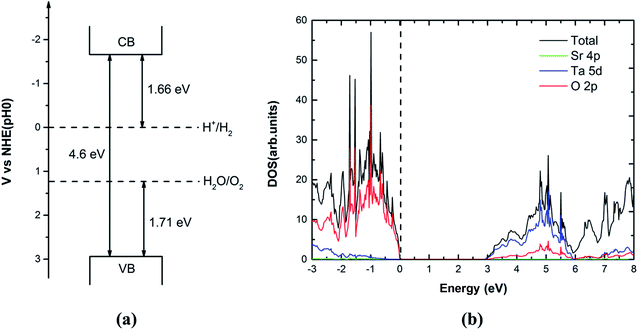
To achieve the maximum usage of sunlight, the semiconductor must have an optimal band gap. The suitable band gap for any visible light irradiated photocatalyst is around 2.0 eV. Furthermore, the valence band position should be more positive than the water oxidation potential (O2/H2O) and conduction band position should be more negative than hydrogen reduction potential (H+/H2).7 Doping of foreign elements into UV-active photocatalyst8–11 is a common strategy to design visible-light efficient photocatalyst. Mukherji et al. have designed a new type of composite containing graphene–Pt and Sr2Ta2O7−xNx with an additional ∼80% increase in hydrogen production and a quantum efficiency of 6.45% (∼177% increase from pristine Sr2Ta2O7).12 Liu et al. discovered that the band gap of Sr2Ta2O7 doped by the anionic (N)/cationic (Mo, W) is significantly reduced for visible light photocatalysis by the first-principles study.13 According to the previous studies on Sr2Ta2O7,2,13 it is known that the valence band maximum (VBM) is 1.71 eV lower than the oxidation potential (H2O/O2) of water while the conduction valence minimum (CBM) is 1.66 eV higher than the reduction potential (H+/H2) in Fig. 1(a).
 |
| | Fig. 1 (a) Band edge alignment of pure Sr2Ta2O7 with respect to the water redox potentials. (b) The calculated total and partial density of states of primitive Sr2Ta2O7 (using PBE). The vertical dashed line represents the Fermi level. | |
In this work, we intend to engineer the band gap by doping, where both the edge of the conduction band and valence band are differently shifted downward and upward by approximately 1 eV based on the primitive Sr2Ta2O7. However, it might be adverse for the stability of systems or create impurity states in the band gap if a single electron or hole is introduced in mono-doping.14 In order to avoid the appearance of the unwanted states and keep stable for the doped Sr2Ta2O7, the anionic element (sulfur) with a higher p orbital energy than that of the oxygen is chosen to dope at the O site while vanadium and niobium become the doped cationic elements to replace Ta. Afterwards, we have studied the (S–V/Nb) co-doped systems with different concentration of S or V/Nb and discussed the effects of mono- and co-doping on the electronic structure of Sr2Ta2O7. We have calculated the formation energies for the mono and co-doped systems to predict the possibilities of such doping. The relative stabilities between the mono and co-doped Sr2Ta2O7 systems are judged on their binding energies.
2. Computational details
The first-principles calculations have been performed using projected augmented wave (PAW) method,15 as implemented in the Vienna ab initio simulation package (VASP).16 For our calculations, the exchange correlation interaction is treated in the level of the GGA using Perdew–Burke–Ernzerhof (GGA-PBE).17 The Brillouin zone was integrated using Monkhorst–Pack generated sets of k-points. The k-point meshes18 of the Brillouin sampling for structural optimization and the density of states (DOS) calculations were set at 3 × 1 × 5 and 5 × 1 × 5, respectively. The plane cutoff energy of 550 eV was used to describe the electronic wave function. In all calculations, self-consistency was achieved with a tolerance in the total energy of at least 10−4 eV and with the residual force below 0.01 eV Å−1. The PAW potentials with the valence states 4s, 4p and 5s for Sr, 2s and 2p for O, 6s and 5d for Ta, 3s and 3p for S, 3p, 3d and 4s for V, 4p, 5s and 4d for Nb have been used. For the doped cases, a 2 × 1 × 1 supercell with 88 atoms (Sr![[thin space (1/6-em)]](https://www.rsc.org/images/entities/char_2009.gif) :Ta:O = 16:16:56) was used, where the dopant anions or cations were substituting the O or Ta site of the supercell, respectively. In order to obtain the proper ground state structure, the spin polarized calculations are used for all the doped systems. The total and partial density of states of pure and the doped systems are aligned with respect to the O 2s core states, which is quite far from the doped atom.
:Ta:O = 16:16:56) was used, where the dopant anions or cations were substituting the O or Ta site of the supercell, respectively. In order to obtain the proper ground state structure, the spin polarized calculations are used for all the doped systems. The total and partial density of states of pure and the doped systems are aligned with respect to the O 2s core states, which is quite far from the doped atom.
3. Results and discussion
3.1. Primitive Sr2Ta2O7
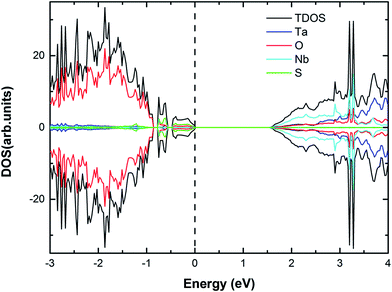
The TaO6 octahedra interconnect in the original crystal of Sr2Ta2O7 (its space group is Cmcm), thus forming layered perovskite structure (Fig. 2). The calculated lattice parameters of the unit cell and band gap by GGA-PBE are compared with the corresponding experimental values,2,19 which are separately listed in the Table 1. The lattice parameters are predicted accurately whereas the band gap of primitive Sr2Ta2O7 from GGA-PBE (2.88 eV) is much smaller than the experimental value (4.60 eV).2 It is common that the GGA-PBE method tends to underestimate the band gap of metal oxides,20 however, this method could correctly predict the shifts of the conduction band and valence band edge and energies of pure or doped structures. We have calculated the electronic structures, formation energies, relative binding energies and absorption spectra using GGA-PBE. Fig. 1(b) illustrates the total and partial densities of states about the primitive Sr2Ta2O7. It is obvious that Ta 5d and O 2p orbitals dominate respectively in the bottom of conduction band and top of valence band,13 which has been reported before. In the following sections, the cationic and anionic doping will be introduced to engineer the band gap.
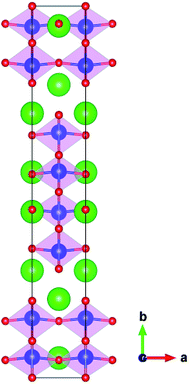 |
| | Fig. 2 The perovskite-slab structures of Sr2Ta2O7 unit cell. The green, blue, red spheres represent Sr, Ta and O atoms, respectively; the pink regions represent TaO6 octahedra. | |
Table 1 The lattice parameters and band gaps of calculation and experiment for Sr2Ta2O7 unit cell
| Sr2Ta2O7 (Cmcm) |
GGA-PBE |
Experimental values |
| a (Å) |
3.989 |
3.937 |
| b (Å) |
27.627 |
27.198 |
| c (Å) |
5.749 |
5.692 |
| Band gap (eV) |
2.88 |
4.60 |
3.2. S-Doping in Sr2Ta2O7
In the S anionic mono-doping, we have replaced oxygen atoms in Sr2Ta2O7 supercell with 88 atoms (Sr:Ta:O = 16:16:56) to tune the valence band edge and explore the effect of the neutral doping on band gap with the variable doping concentrations. Doping S atom is one of the potential methods to engineer the valence band edge, which has been reported in a large number of first-principles studies on metal oxides semiconductors.11 This is because sulfur is isoelectronic to oxygen and it could avoid introducing the extra electrons or holes for the whole doped system after replacing O atom with S atom. Here we have demonstrated the band gaps of S-doped Sr2Ta2O7 with various doping concentrations in Table 2. In addition, the shifts of the valence band maximum (VBM) and conduction band minimum (CBM) for all S-doped systems are also listed in this table. Their respective electronic structures by the spin polarized calculations will be presented in Fig. 3.
Table 2 The band gaps (Eg) calculated by PBE according to the different S-doping concentration of Sr2Ta2O7
| Amount of S doped (amount of O atoms = 56) |
CS-doping (doping concentrations) |
Eg (eV) |
VB shift (eV) |
CB shift (eV) |
ΔEform (eV per f.u) |
| Primitive |
Primitive |
2.88 |
0 |
0 |
|
| 1 |
1.78% |
2.24 |
+0.93 |
+0.29 |
0.41 |
| 2 |
3.57% |
2.03 |
+0.94 |
+0.09 |
0.72 |
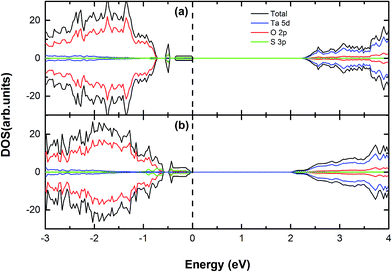 |
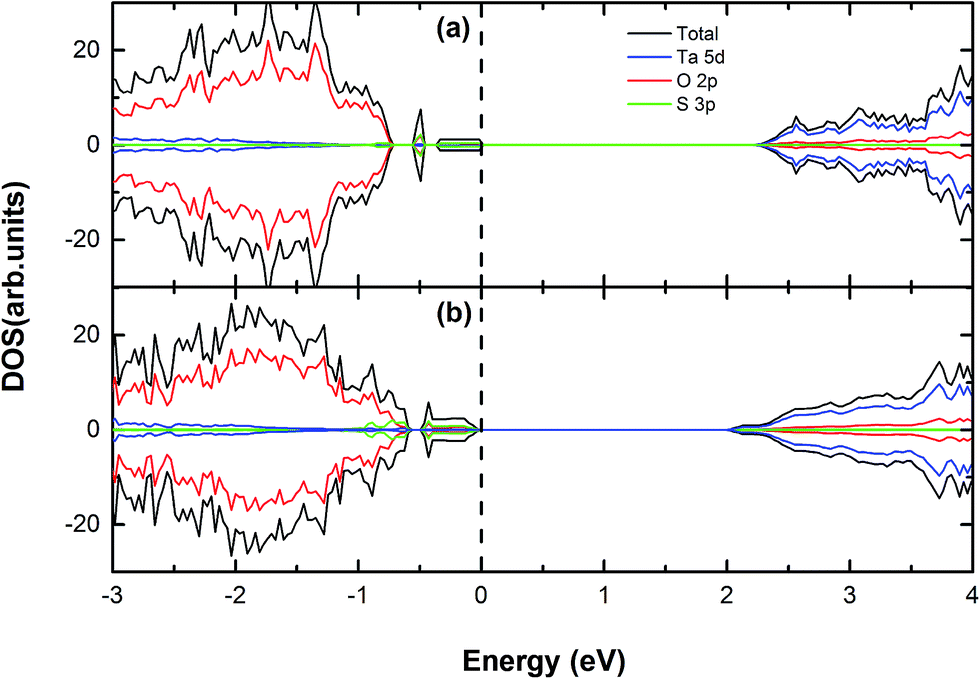
| | Fig. 3 The calculated (using PBE) DOS and PDOS for (a) S, (b) 2S doped Sr2Ta2O7. The vertical dashed line represents the Fermi level. | |
From Table 2, there is the dependence of the band gap on S-doping concentration. The band gap reduces modestly to 2.24 eV with one sulfur atom doped, which can be attributed to the appearance of S impurity states merely above the valence band edge (Fig. 3(a)). Both VBM and CBM of this system move upward by 0.93 eV and 0.29 eV, respectively; as the S-doping concentration is increased, the corresponding band gap continues to decline to 2.03 eV (CS-doping = 3.57%) with the VBM shifted upward by 0.94 eV. According to Fig. 3(a) and (b), it reveals that the VBMs of S-doped Sr2Ta2O7 mainly consist of O 2p and S 3p orbitals. Compared (a) with (b), the peaks of the occupied impurity states in (b) become more obvious and a proportion of impurity states even merge into the initial valence band edge. From the information above, S-doping in Sr2Ta2O7 could engineer the location of valence band edge. The engineered VBM is still lower than the oxidation potential (H2O/O2) of water, which means it is still possible for converting water into oxygen. Moreover, this approach prevents the appearance of impurity states in the middle of the band gap, thus avoiding the forming of recombination centers.
3.3. V or Nb-doping in Sr2Ta2O7
It has been found that the cationic doping can significantly lower down the CBM of the material.21–23 V, Nb and Ta locate on the same row (subgroup V B) of the periodic table, which means it is possible to move the conduction band edge downward by the V or Nb substitution at the Ta site without introducing extra electrons or holes. In this section, we have completed the spin polarized calculation of cationic V/Nb-doped systems and considered the relationship between the doping concentrations and the extent of CBM shifting, which is shown in Table 3 and 4. The total and partial density of states (DOS) are plotted in Fig. 4 and 5, respectively.
Table 3 The band gaps (Eg) calculated by PBE according to the different V-doping concentration of Sr2Ta2O7
| Amount of V doped (amount of Ta atoms = 16) |
CV-doping (doping concentrations) |
Eg (eV) |
VB shift (eV) |
CB shift (eV) |
ΔEform (eV per f.u) |
| Primitive |
0 |
2.88 |
0 |
0 |
|
| 1 |
6.25% |
1.82 |
+0.14 |
−0.92 |
0.34 |
| 2 |
12.5% |
1.48 |
−0.10 |
−1.48 |
0.68 |
Table 4 The band gaps (Eg) calculated by PBE according to the different Nb-doping concentration of Sr2Ta2O7
| Amount of Nb doped (amount of Ta atoms = 16) |
CNb-doping (doping concentrations) |
Eg (eV) |
VB shift (eV) |
CB shift (eV) |
ΔEform (eV per f.u) |
| Primitive |
0 |
2.88 |
0 |
0 |
|
| 4 |
25% |
2.49 |
−0.22 |
−0.62 |
0.47 |
| 6 |
37.5% |
2.42 |
−0.25 |
−0.71 |
0.70 |
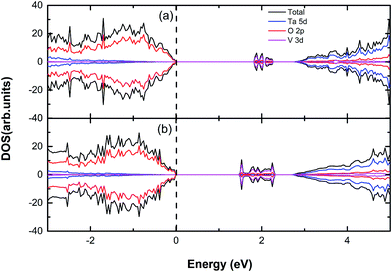 |
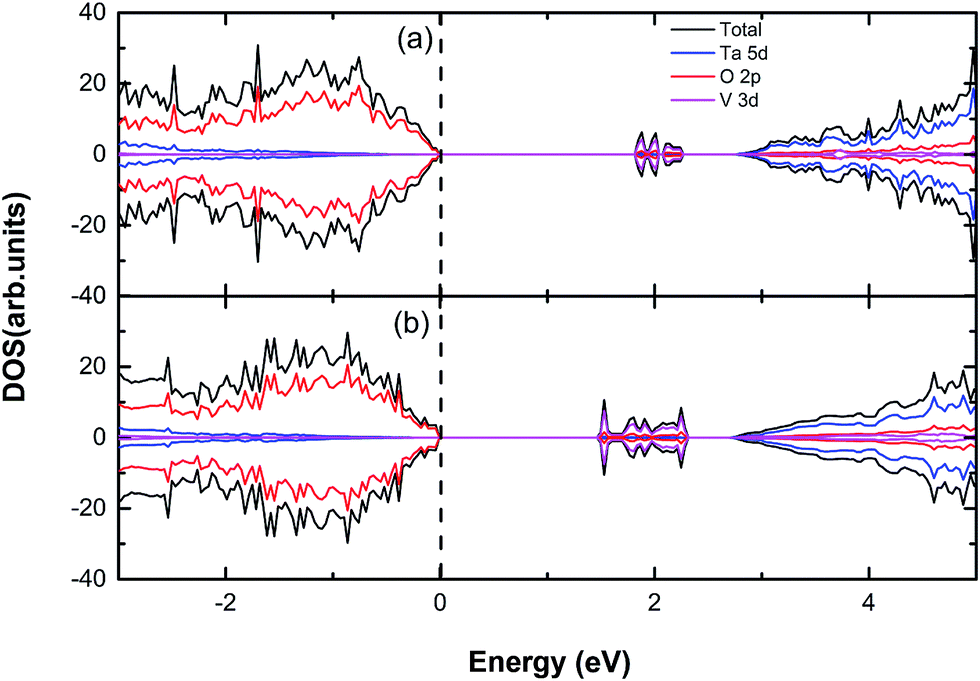
| | Fig. 4 The calculated (using PBE) DOS and PDOS for (a) V, (b) 2V doped Sr2Ta2O7. The vertical dashed line represents the Fermi level. | |
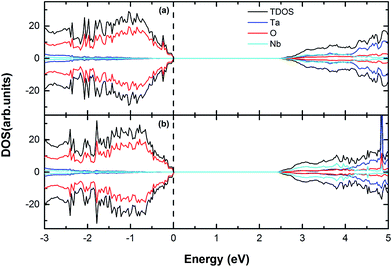 |
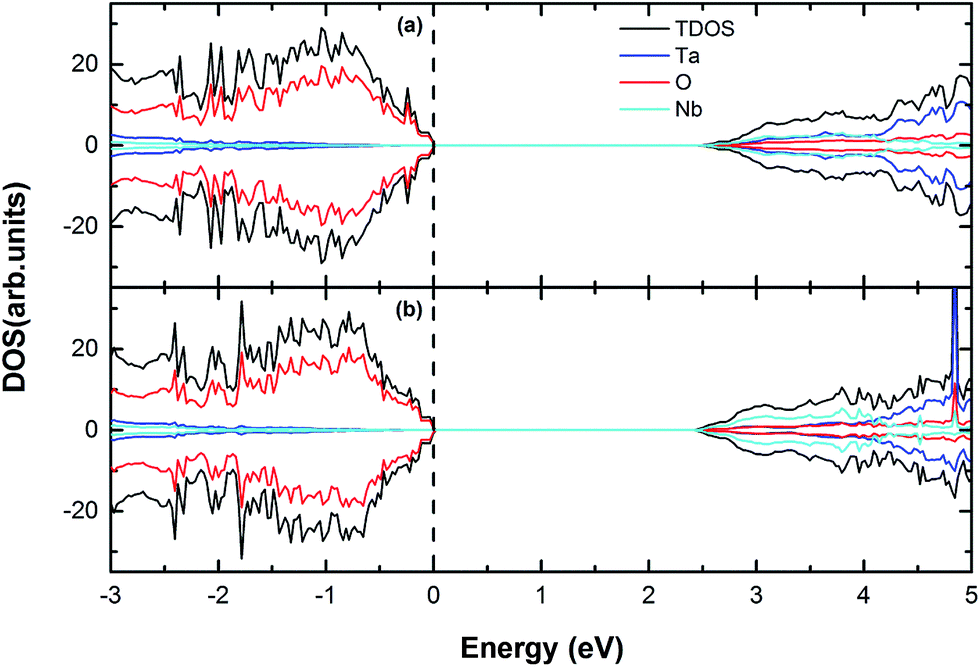
| | Fig. 5 The calculated (using PBE) DOS and PDOS for (a) 4Nb, (b) 6Nb doped Sr2Ta2O7. The vertical dashed line represents the Fermi level. | |
When only one V atom is substituted for a Ta atom, the band gap dramatically declines to 1.82 eV and the CBM shifts downward by 0.92 eV, which might be suitable for tuning the conduction band edge on the purpose of hydrogen production. As the V doping concentration is increased to 12.5%, it is apparent that there is a significant decrease on the band gap (Eg = 1.48 eV) with the CBM moving downward by 1.48 eV. In Fig. 4(a) and (b), we can discover that several unoccupied impurity states appear in the band gap, which is due to the V-doping. The reason why there are impurity states in the band gap might be that V 3d orbital energy is considerably lower than that of Ta 5d.24 Therefore, the effective band gap is reduced for V-doped Sr2Ta2O7. However, the disadvantage of impurity states emerging in the band gap may be trapping the photo generated electrons and contributing to the electron–hole recombination. Furthermore, the range of impurity states will be extended if the V-doping concentration is increased, thus causing a drastic decrease of band gap. From the information mentioned, the band gaps, as well as the shifts of CBM, are affected dramatically by the V-doping concentration. The impurity states in the middle of band gap should be removed from the band gap so that the photochemical catalysis efficiency can be promoted.
Unlike V-doping, Nb-doping could slightly alter the CBM position in the band gap, where no impurity peak forms (Fig. 5). This may be because the radius of Nb atom is close to that of Ta atom and Sr2Ta2O7 is essentially isostructural with Sr2Nb2O7,19 which means that the Nb 4d orbital energy is approximate to the Ta 5d orbital energy. The band gap is reduced to 2.49 eV with the CB shift of −0.62 eV and the VB shift of −0.22 eV when 4Nb doped. When six Nb atoms replace Ta atoms in Sr2Ta2O7 supercell, the band gap is 2.42 eV with the CB shift of −0.71 eV and the VB shift of −0.25 eV (Table 4). However, it has been reported that the photocatalytic activity of Sr2Ta2O7 was dramatically decreased by replacing tantalum with niobium because of lattice distortion around the niobium substituted and a lattice distortion may act as a recombination center for photo-induced electron–hole pairs.25
3.4. Anionic (S) and cationic (V/Nb) co-doping in Sr2Ta2O7
To simultaneously move the VBM upward and the CBM downward by roughly 1 eV for decomposition of water under the visible light, we intend to tune the band gap by the anionic (S) and cationic (V/Nb) co-doping in Sr2Ta2O7 with the S-doping or V/Nb-doping concentrations varied. These results of (S–V/Nb) co-doped groups have been recorded in Table 5. In addition, their electronic structures are shown in Fig. 6 and 7, respectively.
Table 5 The band gaps (Eg) of anionic (S) and cationic (V) co-doping in Sr2Ta2O7 calculated by PBE according to the different S or V-doping concentrations
| Amount of doped anionic atom(s) |
Amount of doped cationic atom(s) |
Eg (eV) |
VB shift (eV) |
CB shift (eV) |
ΔEform (eV per f.u) |
Eb (eV) |
| 1S |
1V |
1.47 |
+1.00 |
−0.40 |
0.72 |
0.21 |
| 1S |
2V |
1.30 |
+0.41 |
−1.17 |
1.08 |
0.02 |
| 2S |
1V |
1.43 |
+1.11 |
−0.35 |
1.17 |
−0.87 |
| 2S |
2V |
1.06 |
+1.14 |
−0.68 |
1.36 |
0.41 |
| 2S |
6Nb |
1.51 |
+0.74 |
−0.63 |
1.55 |
−0.51 |
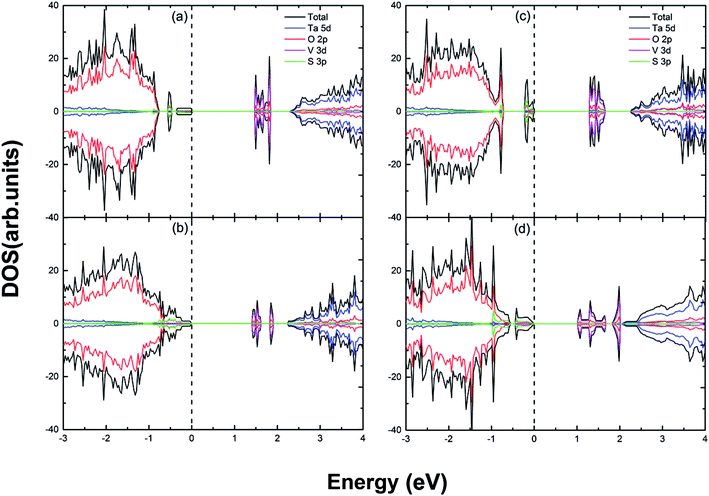 |
| | Fig. 6 The calculated (using PBE) DOS and PDOS for (a) S and V doped; (b) S and 2V doped; (c) 2S and V doped; (d) 2S and 2V doped Sr2Ta2O7. The vertical dashed line represents the Fermi level. | |
 |
| | Fig. 7 The calculated (using PBE) DOS and PDOS for (2S, 6Nb) co-doped Sr2Ta2O7. The vertical dashed line represents the Fermi level. | |
The effective band gap is declined with the VBM shifted upward by 1.00 eV and CBM shifted downward by 0.40 eV in (1S–1V) co-doped case. This is because S 3p and V 3d orbitals differently predominate the VBM and CBM, respectively (in Fig. 6(a)). Compared to the (1S, 1V) doped case, the shift-up of VBM becomes less obvious (only by 0.41 eV) with regard to the (S, 2V) co-doped system, whereas the CBM moves substantially downward (by 1.17 eV). Therefore, the shift-down of CBM could be ideal for the reduction reaction of water. In addition, the impurity states are in the vicinity of the conduction band edge instead of the middle of band gap (in Fig. 6(b)). For the (2S, V) and (2S, 2V) co-doped case, there are both considerable shift-ups of VBM (by 1.11 eV and 1.14 eV, respectively), which indicates that the engineering of VBM is accomplished. The CBM of the (2S, V) system only shifts downward by 0.35 eV, which is almost half of that of the (2S, 2V) co-doped system (by 0.68 eV). Therefore, the band gap of (2S, 2V) doped case (1.06 eV) is significantly narrower than that of (2S, V) doped Sr2Ta2O7 (1.43 eV). In contrast to the DOS and PDOS of (c), there are impurity states in close proximity to conduction band, thus creating a clean band gap in Fig. 6(d).
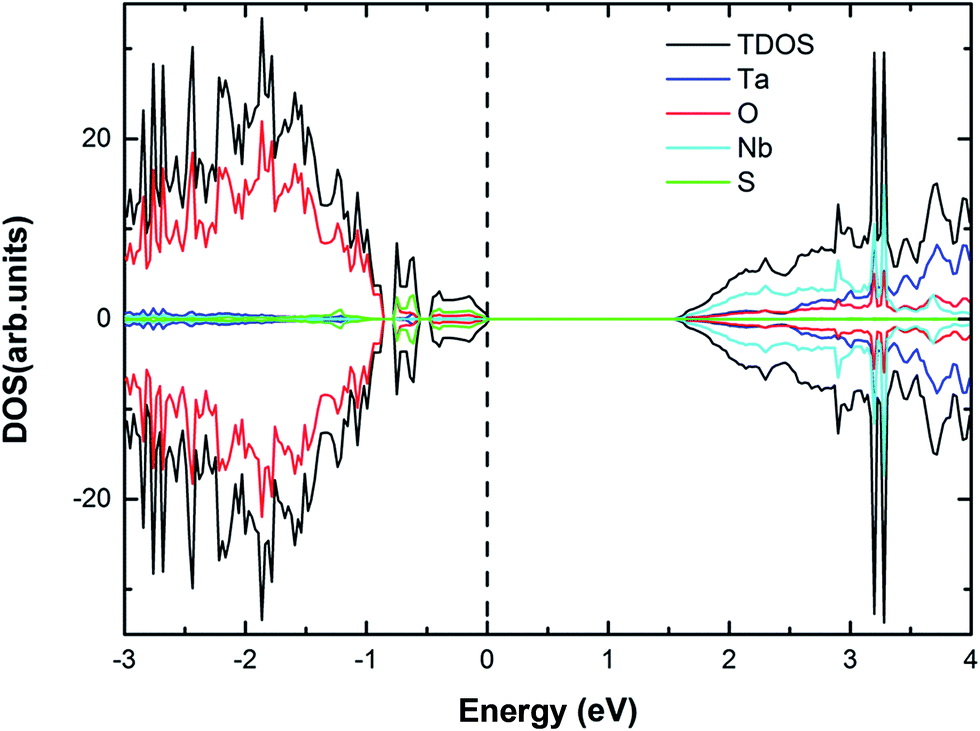
For (2S, 6Nb) co-doped Sr2Ta2O7, the VBM is moved upward by 0.74 eV and the CBM is shifted downward by 0.63 eV. According to the DOS and PDOS (Fig. 7), the impurity states of sulfur atoms are generated above the valence band edge while no impurity states of Nb appear near the CBM. The position of VBM, coincident with CBM, is tuned reasonably by (2S–2V) and (2S–6Nb) co-doping in Sr2Ta2O7 not only to prevent the recombination centers appearing but also to broaden the range of solar light absorption.
3.5. The formation energy and the relative binding energy of doped Sr2Ta2O7
The formation energy (ΔEform) for such doping concentration is being calculated using the following equation:26
| ΔEform = ET(D) − ET(H) + nμX − nμY |
here ET(D) and ET(H) are the total energies of doped and pure Sr2Ta2O7, respectively, and n is the number of the doping atoms. μX and μY are the atomic potential of the host and dopant atoms, respectively. The calculated (using GGA-PBE) formation energies for the doped Sr2Ta2O7 are listed in the tables ahead. In summary, the cationic V mono-doping is more favorable than others.
The relative stability between the co-doped and mono-doped systems is judged on the relative binding energy, the calculation formula of which is as follow:26
| ΔEb = E(A) + E(B) − E(A + B) − E(pure) |
In this equation, E(A), E(B) and E(A + B) are total energies of the anion mono-doped, cationic mono-doped and co-doped systems, respectively. E(pure) represents the total energy of the primitive Sr2Ta2O7. The relative binding energies of the (S, V), (S, 2V), (2S, V), (2S, 2V) and (2S, 6Nb) co-doped systems are 0.21, 0.02, −0.87, 0.41 and −0.50 eV (Table 5), respectively. The positive value indicates that co-doping is more favorable in comparison to the mono-doping in Sr2Ta2O7. Hence, the (2S, 2V) co-doped system is likely to be more stable than the others.
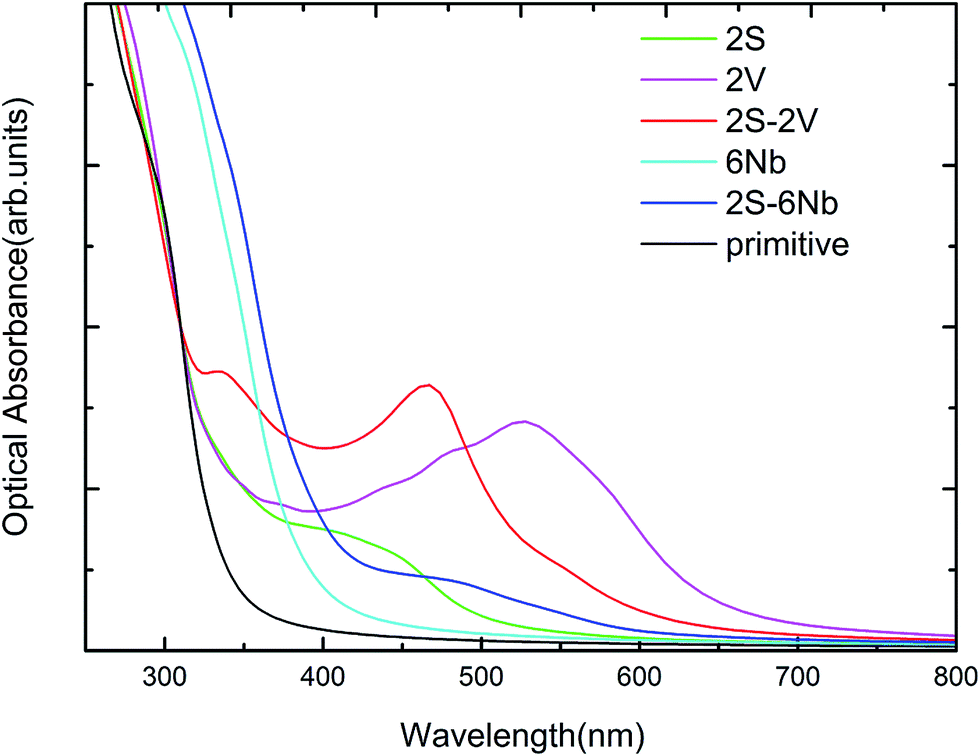
3.6. Absorption curves
We have studied the optical absorption spectra for the anionic (S) or cationic (V/Nb) mono-doping and co-doping of S and V/Nb with different concentrations using the PBE method, which is compared with the primitive Sr2Ta2O7 and presented in Fig. 8. It shows that 2V mono-doping, (2S–2V) co-doping could harvest longer wavelength of visible light spectrum as compared to the primitive Sr2Ta2O7 for efficient photocatalyst. The absorption peaks of these 2S-doped, 2V-doped, 6Nb-doped, (2S–2V) and (2S–6Nb) co-doped Sr2Ta2O7 are mainly attributed to the electrons transition from S 3p orbitals to the CBM, from the VBM to V 3d orbitals, from the VBM to Nb 4d orbitals, from S 3p to V 3d orbitals and from S 3p to Nb 4d orbitals, respectively.
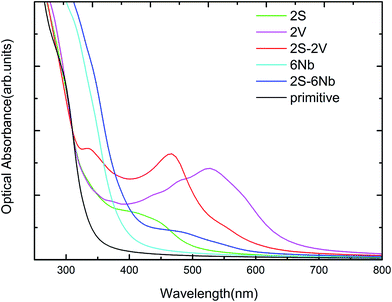 |
| | Fig. 8 The calculated optical absorption plots of anionic (S) or cationic (V/Nb) mono-doping with different concentrations and co-doping of S and V/Nb in comparison with pure Sr2Ta2O7. | |
4. Conclusion
The electronic structures of S and V/Nb mono- and (anionic–cationic) co-doped Sr2Ta2O7 have been studied on the band gap engineering and the shifts of the VBM and CBM for sufficiently utilizing visible light of the solar spectrum by GGA-PBE calculations. It is successful for the anionic (S) doped Sr2Ta2O7 to tune the location of the valence band edge with the S-doping concentration varied, thus moderately shifting the VBM upward by approximately 1 eV. Owing to no single electron or hole created, the occupied or unoccupied states of dopants are prevented in the band gap from becoming recombination centers. In the case of the (V) cationic doped systems, the significant shift-down of CBM is a result of the appearance of impurity states mixing between O 2p and V 3d. As the V-doping concentration increases, the extent of the CBM shift-down becomes more obvious (by 0.92 and 1.48 eV, respectively). Unlike the V-doped systems, Nb doping in Sr2Ta2O7 could shift mildly the CBM downward (only by 0.6–0.7 eV) without any impurity states appearing near the CBM. To simultaneously achieve the tuning of VBM and CBM, we have performed the S and V/Nb co-doped cases, from which the VBM is moved upward by 1.14 and 0.74 eV and the CBM is moved downward by 0.68 and 0.63 eV for (2S–2V) and (2S, 6Nb) co-doped Sr2Ta2O7, respectively. Both systems still remain “clean” for the band gap and capable of catalyzing water into hydrogen and oxygen.
Conflicts of interest
There are no conflicts to declare.
Acknowledgements
This work was supported by the National Science Foundation of China (No. 21673240 and 21501177), the NSF of Fujian Province (No. 2017J05033) and the Foreign Cooperation Project of Fujian Province (No. 2017I0019). The authors gratefully acknowledge the Supercomputing Center of CNIC for providing the computing resources.
References
- B. C. Wang, et al., Band gap engineering in BiNbO4 for visible-light photocatalysis, Appl. Phys. Lett., 2012, 100(18), 182102 CrossRef.
- A. Kudo, H. Kato and S. Nakagawa, Water splitting into H-2 and O-2 on new Sr2M2O7 (M = Nb and Ta) photocatalysts with layered perovskite structures: factors affecting the photocatalytic activity, J. Phys. Chem. B, 2000, 104(3), 571–575 CrossRef CAS.
- Y.-M. Song, J.-Q. Dai and H. Zhang, Hybrid functional study on optical properties of Sr2M2O7−xNx (M = Nb, Ta) photocatalysts with perovskite-slab structures, Curr. Appl. Phys., 2016, 16(1), 1–7 CrossRef.
- X. B. Chen, et al., Semiconductor-based photocatalytic hydrogen generation, Chem. Rev., 2010, 110(11), 6503–6570 CrossRef CAS PubMed.
- H. Kato and A. Kudo, Water splitting into H-2 and O-2 on alkali tantalate photocatalysts ATaO(3) (A = Li, Na, and K), J. Phys. Chem. B, 2001, 105(19), 4285–4292 CrossRef CAS.
- K. Yoshioka, et al., The relationship between photocatalytic activity and crystal structure in strontium tantalates, J. Catal., 2005, 232(1), 102–107 CrossRef CAS.
- A. Kudo and Y. Miseki, Heterogeneous photocatalyst materials for water splitting, Chem. Soc. Rev., 2009, 38(1), 253–278 RSC.
- P. Kanhere, et al., Mono- and co-doped NaTaO3 for visible light photocatalysis, Phys. Chem. Chem. Phys., 2014, 16(30), 16085–16094 RSC.
- P. Liu, et al., Anion–anion mediated coupling in layered perovskite La2Ti2O7 for visible light photocatalysis, J. Phys. Chem. C, 2013, 117(27), 13845–13852 CAS.
- Z. Ma, et al., Mechanism of enhanced photocatalytic activities on N-doped La2Ti2O7: an insight from density-functional calculations, Int. J. Hydrogen Energy, 2015, 40(2), 980–989 CrossRef CAS.
- J. Nisar, et al., Hole mediated coupling in Sr2Nb2O7 for visible light photocatalysis, Phys. Chem. Chem. Phys., 2012, 14(14), 4891–4897 RSC.
- A. Mukherji, et al., Nitrogen doped Sr2Ta2O7 coupled with graphene sheets as photocatalysts for increased photocatalytic hydrogen production, ACS Nano, 2011, 5(5), 3483–3492 CrossRef CAS PubMed.
- P. Liu, et al., Layered perovskite Sr2Ta2O7 for visible light photocatalysis: a first principles study, J. Phys. Chem. C, 2013, 117(10), 5043–5050 CAS.
- J. Nisar, et al., Mo- and N-doped BiNbO4 for photocatalysis applications, Appl. Phys. Lett., 2011, 99(5), 3 CrossRef.
- P. E. Blochl, Projector augmented-wave method, Phys. Rev. B, 1994, 50(24), 17953–17979 CrossRef.
- G. Kresse and D. Joubert, From ultrasoft pseudopotentials to the projector augmented-wave method, Phys. Rev. B, 1999, 59(3), 1758–1775 CrossRef CAS.
- J. P. Perdew, K. Burke and M. Ernzerhof, Generalized gradient approximation made simple, Phys. Rev. Lett., 1996, 77(18), 3865–3868 CrossRef CAS PubMed.
- J. D. Pack and H. J. Monkhorst, Special points for Brillouin-zone integrations, Phys. Rev. B, 1976, 13(12), 5188–5192 CrossRef.
- N. Ishizawa, et al., Compounds with perovskite-type slabs.2. crystal-structure of Sr2Ta2O7, Acta Crystallogr., Sect. B: Struct. Sci., 1976, 32, 2564–2566 CrossRef.
- R. W. Godby, M. Schluter and L. J. Sham, Accurate exchange–correlation potential for silicon and its discontinuity on addition of an electron, Phys. Rev. Lett., 1986, 56(22), 2415–2418 CrossRef CAS PubMed.
- W.-J. Yin, et al., Band structure engineering of semiconductors for enhanced photoelectrochemical water splitting: the case of TiO2, Phys. Rev. B, 2010, 82(4), 045106 CrossRef.
- A. Bokare, M. Pai and A. A. Athawale, Surface modified Nd doped TiO2 nanoparticles as photocatalysts in UV and solar light irradiation, Sol. Energy, 2013, 91, 111–119 CrossRef CAS.
- E. Garskaite, et al., The study of preparation and photoelectrical properties of chemical bath deposited Zn, Sb and Ni-doped CuInS2 films for hydrogen production, Sol. Energy, 2012, 86(9), 2584–2591 CrossRef CAS.
- S.-H. Wei, H. Krakauer and M. Weinert, Linearized augmented-plane-wave calculation of the electronic structure and total energy of tungsten, Phys. Rev. B, 1985, 32(12), 7792–7797 CrossRef CAS.
- M. Yoshino and M. Kakihana, Polymerizable complex synthesis of pure Sr2NbxTa2−xO7 solid solutions with high photocatalytic activities for water decomposition into H-2 and O-2, Chem. Mater., 2002, 14(8), 3369–3376 CrossRef CAS.
- W. J. Yin, et al., Double-hole-mediated coupling of dopants and its impact on band gap engineering in TiO2, Phys. Rev. Lett., 2011, 106(6), 066801 CrossRef PubMed.
Footnote |
| † These authors have contributed equally. |
|
| This journal is © The Royal Society of Chemistry 2017 |
Click here to see how this site uses Cookies. View our privacy policy here. 
 Open Access Article
 This Open Access Article is licensed under a
  ab,
Zuju Ma†
ab,
Zuju Ma†