 Open Access Article
Creative Commons Attribution 3.0 Unported Licence
Chemically controlled micro-pores and nano-filters for separation tasks in 2D and 3D microfluidic systems†
Sebastian Haefner a,
Philipp Frankab,
Enrico Langera,
Denise Grunera,
Ulrike Schmidtc,
Martin Elstnera,
Gerald Gerlachc and
Andreas Richter*ab
aInstitute for Semiconductors and Microsystems, Department of Electrical and Computer Engineering, Technische Universität Dresden, 01062 Dresden, Germany. E-mail: andreas.richter7@tu-dresden.de
bCenter for Advancing Electronics Dresden, 01062 Dresden, Saxony, Germany
cInstitute of Solid State Electronics, Department of Electrical and Computer Engineering, Technische Universität Dresden, 01062 Dresden, Saxony, Germany
First published on 23rd October 2017
Abstract
Molecule filtering or particle separation is a complex task in microfluidics. Passive structures or polymer based systems like hydrogels are normally used elements. PNIPAAm (poly-N-isopropylacrylamide) hydrogels are known for their capability to work as nano-filters to separate small molecules from their environment and protect them from degrading enzymes by the polymer network. PNIPAAm based active micro-pores were also demonstrated for particle separation. Normally, changes in temperature are used to alter the permeation properties of such hydrogel elements. To handle limiting factors such as separate temperature control for each element, chemical signals can be used to alter the permeation. Here, we present a new way to adapt the size exclusion functionality of PNIPAAm-based nano-filters or micro-pores. PNIPAAm hydrogels respond to organic solvent concentrations by shrinking or swelling. We use this responsiveness to alter the hydrogel mesh size or to adjust the size of a micro-pore. We show the filter functionality for two model molecules: the enzyme horse radish peroxidase and the fluorescence molecule fluorescein. Furthermore, the adjustment of the size of a micro-pore in a continuous way is demonstrated, so that pore sizes between the closed and open state can be addressed and kept permanently.
1 Introduction
Filtering and separation of cells or biomarkers from complex media like blood are critical problems in the life sciences.1 These tasks are important to isolate e.g. tumor cells or tumor markers for diagnostic or therapeutic purposes.2,3The most common technique for cell sorting and separation is fluorescence activated cell sorting (FACS).4 Here, cells can be operated using specific fluorescence labels and morphological characteristics. The integration of cell sorting or separation techniques in microfluidic systems is of high interest.5 A combination of cell sorting and analysis is a powerful method for the investigation or treatment of diseases such as cancer.6
Biomarkers are important molecules for diagnostics. In this way, their filtration and degradation protection is of high importance for biomedical assays.7 Here, microfluidic systems can support the diagnostic process by speeding up such assays.8 Especially for portable devices, biomarker harvesters need to be integrated in the diagnostic device. Hence, the diagnostic device becomes more powerful, because it can perform probe pre-treatment (separation and filtration) so that it lowers the diagnosis time.
For the discussed tasks of biomarker harvesting and cell separation, approaches based on stimuli-sensitive hydrogels have already been demonstrated. Hydrogels are three dimensional polymeric networks with the capability to swell in water and therefore change their size. Certain hydrogel types are also able to alter their size by reacting to changes in their environmental conditions such as pH value, temperature or organic solvent concentration.9–12 These types of hydrogel are stimuli-responsive and can be integrated in microfluidic systems by common techniques such as photo-patterning13,14 or inkjet printing,15 and so they are also capable of down scaling and high integration which makes them attractive for microsystem engineering and microfluidics. Hydrogels are a promising class of material for solving many microfluidic tasks on a chip. Hydrogels were used several times for valves,16–21 pores,22–27 filters28,29 or chemical storing.30–32
In previous studies it was shown that smart hydrogels can be used to fabricate micro-pores,27 chemically tuned filters for biomolecule size exclusion as well as biomarker harvesting28,29 and membranes with temperature dependent permeation properties.26,33–42
To alter the separation features of hydrogel based micro-pores or biomarker harvesters the hydrogels can be chemically or physically modified. Hydrogels based on poly-N-isopropylacrylamide (PNIPAAm) are stimuli-responsive gels with the capability to shrink when the temperature is increased to the lower critical solution temperature (LCST). Therefore, the permeability of micro-pores consisting of PNIPAAm27 or membranes with PNIPAAm crafted pores can be switched on and off by temperature. Biomarker harvesters based on PNIPAAm can be tuned regarding their filtering properties by altering the cross-linking density in the fabrication process.
However, temperature based micro-pores that control or adapt the filter properties of harvesters in the fabrication process increase the complexities of fabrication and control of a microfluidic system.
A temperature controlled degree of swelling requires a precise control system which faces technological problems, especially when the micro-pores or membranes are used in microfluidic systems. For example, when separation tasks with more than one micro-pore are performed on a microfluidic chip, a temperature control system directly linked to each pore is required. In this way each micro-pore can be opened and closed separately. From a technological point of view, especially for 3D microfluidic systems, a precise temperature control for each pore is a complex task. To overcome the individual temperature regulation (micro-pore) or chemical modification (nano-filters) requirements we use another stimulus to control the hydrogel based elements.
Besides temperature, PNIPAAm hydrogels can also be controlled by organic solvent concentrations in a reliable and simultaneous way.9,10 In previous studies it was shown that PNIPAAm hydrogels can be altered regarding their degree of swelling by mixtures of water and organic solvent such as ethanol, isopropanol or methanol. With an increasing solvent concentration the hydrogel shrinks to a certain size. This feature is used as the basis for chemofluidic transistors, chemofluidic oscillators or circuits.18,19,43,44
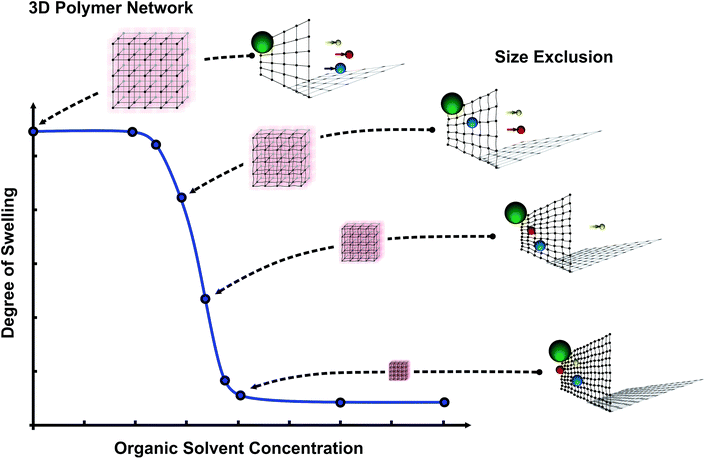
The idea is that within the shrinking process, due to the organic solvents, the mesh size of the hydrogels decreases which leads to an adaptable mesh size for separation tasks on the molecular level (see Fig. 1). Furthermore, with changes in the organic solvent concentration the permeability of a micro-pore based on PNIPAAm can also be altered due to the hydrogel shrinking process.
In this article, we present the adaptability of separation functionalities in the micro- and nano-meter range by organic solvent concentrations. We show in the first part of the paper the dependency of the degree of swelling and the hydrogel morphology on organic solvent/water mixtures. In the second part we demonstrate filter modulation in the nanometer range for two model compounds (a dye and an enzyme). Furthermore, we show in the third part the dependency of the micro-pore size exclusion property on various water/ethanol mixtures.
The presented control principle for PNIPAAm based nano-filters or micro-sieves demonstrates a reliable and easy way to adjust the filter or sieve properties simultaneously for various hydrogels. Smart hydrogels show a scalability over a wide range and therefore size exclusion properties for micro-pores can be adjusted over several magnitudes. Furthermore, the demonstrated principle allows the control of micro-pore sizes in a continuous way compared to the literature (only open or closed state).27 It is possible to open and close micro-pores but also to address pore sizes in between and keep these sizes permanently. Using chemical signals to control the size exclusion properties, we overcome the technological problem of an individual temperature controlling system for each pore.
2 Experimentals
2.1 Chemicals
N-Isopropylacrylamide (NIPAAm), N,N′-methylene-bis-acrylamide (BIS), photoinitiator Irgacure® 2959, N,N,N′,N′-tetramethylethylenediamine, potassium persulfate (KPS), fluorescein sodium salt, 3-(trimethoxysilyl)propyl methacrylate, sodium acrylate (SA), horse radish peroxidase and 2,2-azino-bis(3-ethylbenzothiazoline-6-sulfonic acid) diammonium salt (ABTS) were purchased from Sigma-Aldrich (St. Louis, USA). NIPAAm was recrystallised from n-hexane (VWR International GmbH, Darmstadt, Germany) and other chemicals were used as received. All experiments were conducted in deionised water with an electrical conductivity of 0.056 μS cm−1 (Barnstead GENPURE PRO, Thermo Scientific, Langenselbold, Germany) generated by ion exchange. Organic solvents (isopropanol, absolute ethanol and acetone) of chromatography grade were used (HiPerSolv CHROMANORM®, VWR Chemicals, Fontenay-sous-Bois, France).2.2 Thermal polymerisation
For the nano-filter experiments PNIPAAm hydrogels were fabricated by thermal-induced free radical polymerisation. The polymerisation solution was prepared by dissolving 0.57 g NIPAAm, 0.028 g BIS and 4 μl TEMED in 4 ml water. The solution was rinsed for 1 h with argon to remove oxygen, and afterwards sealed with a septum and brought into a glove box (mBraun, LAB Star, Garching, Germany). The oxygen content in the glove box was less than 0.5 ppm. 0.0015 g KPS was dissolved in 1 ml deionised water, rinsed with argon for 1 h and also brought into the argon filled glove box. The KPS solution was added to the polymerisation solution, and this was mixed and inserted into NMR tubes (Deutero GmbH, Kastellaun, Germany). The polymerisation reaction was carried out overnight inside of the glove box. In fact, the polymerisation was finished faster and overnight incubation was not necessary, but the long polymerisation time does not affect the synthesis.2.3 Hydrogel conditioning and drying
To wash out the non-polymerised parts of the hydrogels, the following procedure including 3 steps was repeated 5 times. First the hydrogels were swollen in water for 24 h (step 1). After incubation in water the hydrogels were shrunk at 60 °C for 2 h in a convection oven (Venti-Line, VWR International GmbH, Darmstadt, Germany) (step 2). Following the shrinking process the water was exchanged with fresh water (step 3) and incubation was again carried out for 24 h (step 1). After the fifth cycle the hydrogels were again deswollen, the water was decanted and the hydrogels were dried for 24 h at 60 °C in a convection oven. The lingering water content was removed by drying the hydrogels for 60 h at 60 °C in a vacuum oven (Heraeus, Thermo Scientific, Langenselbold, Germany).2.4 Hydrogel lyophilisation and scanning electron microscopy
Microstructured PNIPAAm hydrogels were fabricated by photo-polymerisation and covalently attached to the surface of a cover slip (VWR International GmbH, Darmstadt, Germany) following a previous publication.14 The hydrogels were incubated in different water/ethanol mixtures at room temperature for 30 min followed by shock freezing in liquid nitrogen for 20 s. Afterwards the solvent was removed by sublimation under vacuum for 2 h. The gels were directly brought into the vacuum chamber of a Scanning Electron Microscope (SEM) for micro-architecture and porosity investigations.Scanning electron microscopy was performed with a variable pressure scanning electron microscope (JEOL JSM-6610LV, JEOL, USA) in the low-pressure mode to avoid sputter-coating of the probes.
2.5 Degree of swelling determination
Weight measurements were conducted with a precision balance (BP 210 S, Sartorius, Goettingen, Germany). To determine the degree of swelling the hydrogels were weighed after drying and consecutively incubated for 24 h in water or water/organic solvent mixture to calculate the degree of swelling (Qm) following eqn (1):
 | (1) |
2.6 Static fluorescein diffusion experiments
For the fluorescein diffusion tests, fluorescein was dissolved in a water/organic solvent mixture (fluorescein concentration 0.083 g l−1). After solution preparation the tubes were stored for 2 h at 7 °C. Afterwards dried hydrogels were added followed by incubation for 2 h at 7 °C. Finally, the hydrogels were rinsed with water and dried on a tissue.2.7 Time-resolved fluorescein diffusion experiments
For the time-resolved diffusion test, the dried hydrogels were pre-conditioned in water/ethanol mixture overnight at room temperature. Afterwards water/ethanol mixtures with a constant fluorescein concentration (0.083 g l−1) were prepared. The pre-conditioned hydrogels were added to the different solutions and removed after various incubation times. The hydrogels were quickly washed in de-ionised water, shortly dried on a tissue and stored in dark-coloured tubes. Deionised water (1.5 ml) was added to each tube so that the fluorescein which was diffusing into the gels during the incubation diffused into the water. This procedure was conducted for 12 h. After incubation the tubes were stored in an oven at 45 °C for 2 h to deswell the gels and expel the remaining fluorescein. The dyed water was measured in an UV/Vis spectrometer to determine the fluorescein content. For the comparison between the different water/ethanol mixtures, the following normalisation was performed for each absorption I485 nm:
 | (2) |
2.8 Enzyme filtration
For the enzyme diffusion test, a biochemical reaction based on hydrogen peroxide and ABTS was used. 20 nM ABTS and 3 mg ml−1 HRP were dissolved in water and mixed with ethanol to reach the working concentrations and were stored at 7 °C or 21 °C for 2 h. After that, the dried hydrogels were added and incubated for 12 h at two different temperatures. After incubation the hydrogels were washed in water and placed in a water solution containing 0.3 w/v% hydrogen peroxide.For testing the effect of the water/ethanol mixtures on the HRP, 100 μl of a 0.3 w/v% hydrogen peroxide solution was added to the HRP-ABTS-water/ethanol mixture.
2.9 Micro-pore preparation
Micro-pore preparation was conducted by photo-polymerising PNIPAAm-co-SA (poly-N-isopropylacrylamide-acrylate-copolymer) hydrogels in a desired geometry on top of a scaffold material. For that, a polymerisation solution was prepared and a glass slide (26 mm × 76 mm × 1 mm, Menzel-Gläser, Gerhard Menzel GmbH, Braunschweig, Germany) or a poly-ethylenterephthalat foil (PET, thickness 100 μm) acted later on as scaffolds for the polymer pores.Polymerisation solution was prepared by dissolving 2.014 g NIPAAm, 0.043 g BIS and 0.09 g sodium acrylate in 15 ml water. The solution was flushed for 1 h with argon to remove oxygen, and afterwards sealed with a septum and brought into a glove box. 0.042 g photoinitiator was added and the solution was thoroughly mixed.
For the scaffold preparation, holes were drilled in a glass slide (radius 1 mm) or punched in a PET foil with dispensing tips (PK Elektronik Vertrieb GmbH, Ettlingen, Germany). The glass slide and foil were cleaned in absolute ethanol and deionised water in an ultrasonic bath for 20 min, respectively. After that the scaffolds were dried by a stream of nitrogen. Surface silanisation was conducted by placing the scaffolds under an UV/ozone lamp for 1 h followed by incubating the scaffolds in absolute ethanol containing 2% (v/v) methacrylate silane for 2 h. After functionalisation the scaffolds were rinsed with ethanol and water and dried under a stream of nitrogen.
For the photo-polymerisation process a chamber system was assembled consisting of a glass slide, a photo-mask, two spacers (height 100 μm) and a scaffold (see Fig. 2A). After assembly the polymerisation solution was filled in the chamber, followed by chamber closing by a sheet of black PET and clamping. The chamber was exposed to UV light (1000 W Hg(Xe), L.O.T.-Oriel Group Europe, Darmstadt, Germany) for 30 s or 60 s (only for the miniaturised cross geometry in Fig. 12) and cooled by an ice bath to avoid thermal effects (Fig. 2B). After the exposing step the chamber was disassembled (Fig. 2C) and the scaffolds with the polymer pores were stored in deionised water to wash out the non-polymerised part.
2.10 Micro-pore size adjustment investigations
For experiments on the static pore size, the scaffolds with pores were immersed in water/ethanol mixtures, incubated overnight at 21 °C and observed under a microscope (WILD HEERBRUGG M420, Heerbrugg, Switzerland). This procedure was conducted for various ethanol concentrations. From the recorded images the pore area was calculated using ImageJ software and the measured areas were normalised to the pore area at 30% (v/v) water/ethanol mixture.For dynamic pore opening investigations the scaffolds with the pores were incubated overnight in deionised water at room temperature. The scaffolds were immersed in a 30% (v/v) water/ethanol mixture and microscopic images were recorded every minute (duration of 60 min). The pore area was calculated from these images using ImageJ software. The area was normalised to the pore area calculated from images recorded after 60 min of incubation.
3 Results
Stimuli-responsive hydrogels act on changing environmental conditions like organic solvent concentrations by changing their degree of swelling. By changing the degree of swelling the polymer network will also be affected. In the shrinking process the network becomes denser, the mesh size decreases and the hydrogel shrinks.Firstly, this phenomenon can be used to build adaptable filters or diffusion barriers for molecules. Molecules which are larger than the mesh size are prevented from entering the hydrogel matrix. Following this behaviour, smart hydrogels act as adaptable molecular filters. Molecules which are still able to enter the matrix due to their smaller size are influenced in their diffusion because of different interaction ranges with the polymer network (adaptable diffusion barrier). Therefore, the change in the degree of swelling affects molecules due to their size. It can keep molecules out of the gel or change their time scale for diffusion into the polymer matrix.
Secondly, the change in the degree of swelling by organic solvent concentrations can be used to build adaptable pores for particle filtration.
To show the adaptability of smart hydrogels as molecular filters and pores, first investigations were conducted regarding the altering of the degree of swelling by organic solvent concentration. The dependency of the degree of swelling on organic solvent concentrations was already described and also used in various reports.9,10 Because this sensitivity is elementary for the principles shown here, we will first focus on the degree of swelling alternation by different water/organic solvent mixtures (acetone, ethanol and isopropanol) under different incubation temperatures (Section 3.1). Furthermore, we will discuss the water/organic solvent mixture effect on two different hydrogel compositions (PNIPAAm and PNIPAAm-co-SA gels) as well as the effect of various ethanol concentrations on the morphology of PNIPAAm hydrogels.
In Section 3.2 we demonstrate the usage of PNIPAAm hydrogels as adaptable diffusion barriers for fluorescein molecules and as adaptable molecular filters for the enzyme HRP. Furthermore, we show in Section 3.3 the effect of various ethanol concentrations on the size of pores made of PNIPAAm-co-SA (poly-N-isopropylacrylamide-acrylate-copolymer) hydrogels.
3.1 Degree of swelling adaption
As the basis for our studies the degree of swelling dependency on the type of organic solvent, concentration of the solvent, temperature and hydrogel composition was investigated.Organic solvents (acetone, ethanol and isopropanol) were chosen because of their wide availability in chemistry and biology laboratories. The resulting degrees of swelling are summarised in Fig. 3. It can be seen that for ethanol and isopropanol, the degree of swelling decreases with an increasing solvent concentration, followed by a plateau phase and an increase for high organic solvent concentrations. This transition behaviour from swollen state to shrunken state then to the swollen state was already described by Richter and colleagues.9 They also mentioned that the curve shifts depending on the temperature, and the required solvent concentration for inducing the shrinking process increases if the temperature decreases, as in the demonstrated results.
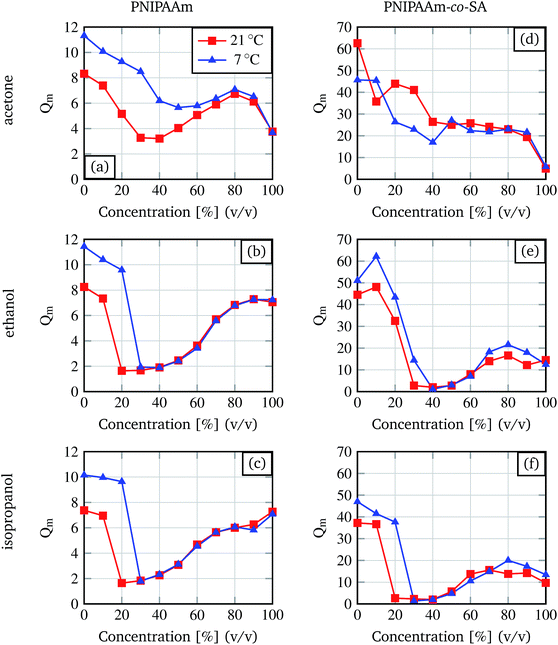 | ||
| Fig. 3 Degree of swelling for different organic solvent concentrations determined for pure PNIPAAm and PNIPAAm-co-SA hydrogels at 7 °C and room temperature (21 °C). | ||
The curves for acetone differ from the curves for ethanol and isopropanol. For the PNIPAAm hydrogels, the graph shows a behaviour similar to the curves for ethanol and isopropanol with a less strong shrinkage. For the PNIPAAm-co-SA gels no plateau phase or increase at higher organic solvent concentrations is observed.
Comparing the two different hydrogel types, PNIPAAm and PNIPAAm-co-SA, it is demonstrated that the degree of swelling for the copolymer gel is nearly three times higher (for pure water) than the degree of swelling for the PNIPAAm gel. Nevertheless, the minimum in the degree of swelling for the ethanol and isopropanol solvents is comparable for both hydrogel types. For later experiments only the first part of each curve for ethanol and isopropanol is of interest because here the degree of swelling alters significantly with the change of concentration. For PNIPAAm the region of interest lies between 0% and 20% (v/v) at 21 °C and between 0% and 30% (v/v) at 7 °C. For PNIPAAm-co-SA differences between isopropanol and ethanol are observable. For ethanol the region of interest lies between 0% and 30% (v/v) at 21 °C and between 0% and 40% (v/v) at 7 °C. For isopropanol the region of interest lies between 0% up to 20% (v/v) at 21 °C and between 0% up to 30% (v/v) at 7 °C.
To visualise the altering of the polymer network and therefore the gel porosity and micro-architecture (morphology) by water/ethanol mixtures we performed scanning electron microscopy studies on freeze-dried PNIPAAm hydrogels. The gels were pre-conditioned in water or a water/ethanol mixture and afterwards freeze-dried. The resulting SEM micrographs are shown in Fig. 4.
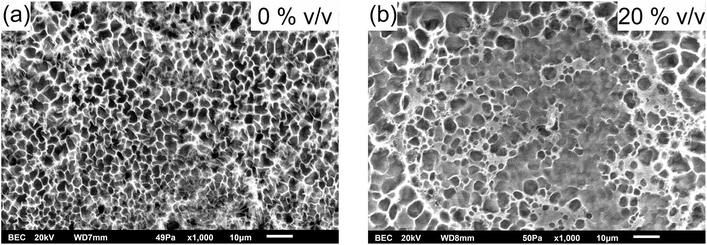 | ||
| Fig. 4 Organic solvent concentration (% (v/v)) dependent hydrogel morphology studied with SEM of the freeze-dried PNIPAAm hydrogels. | ||
Ethanol alters the morphology of the PNIPAAm hydrogels as demonstrated in Fig. 4. Here, the change of the morphology from a porous material (Fig. 4a) to a more dense-like structure (Fig. 4b) is shown. Due to the organic solvent the hydrogel shrinks to a defined and reproducible degree of swelling, and the polymer network becomes denser and therefore affects the morphology.
3.2 Adapting fluorescein diffusion and HRP filtration
As a proof of concept, solutions containing fluorescein and different concentrations of organic solvent were mixed in tubes and incubated at 7 °C followed by hydrogel addition and a further incubation step. The results after washing the hydrogels in deionised water are shown in Fig. 5. It is demonstrated that acetone is not suitable as a solvent for adaptable diffusion altering. 30% (v/v) and 35% (v/v) ethanol or isopropanol are appropriate concentrations to adapt fluorescein diffusion in a significant amount. Here the hydrogels show no yellow colouring by fluorescein.Because acetone is not suitable for adjusting the filtering behaviour properly it was not investigated any further. For ongoing experiments ethanol was the organic solvent of choice.
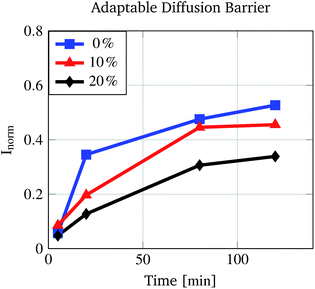
To demonstrate the altered diffusion of fluorescein into the polymer matrix at various water/ethanol mixtures, pre-conditioned PNIPAAm hydrogels were incubated for different times in water/ethanol mixtures dyed with fluorescein. Due to the altered matrix–fluorescein interactions at different concentrations, less fluorescein molecules are able to enter the polymer matrix at e.g. 20% (v/v) than at 0% (v/v) ethanol concentration in the same time. Fig. 6 proves this assumption. The rise of the normalised absorption Inorm differs for the three different ethanol concentrations. As expected for a 20% (v/v) ethanol solution the increase is the lowest and for 0% (v/v) the increase is the highest.
As a second test molecule an enzyme was chosen because they have strong relevance in biochemistry and molecular biology investigations and also in medical diagnoses. The selected enzyme was HRP, one that is often used for biochemical assays. The hydrogels were incubated in different ethanol solutions containing the dye for the detection reaction (ABTS) and the enzyme. If the enzyme is able to diffuse into the gel matrix, the dye will also be able to do so because the dye molecule is much smaller. After incubation the gels were washed and stored in a water/hydrogen peroxide mixture. The enzymatic reaction starts, which results in ABTS turning from colourless to green. This leads to green coloured hydrogels if the enzyme was able to diffuse into the gels.
 | (3) |
The results for different temperatures and ethanol concentrations are demonstrated in Fig. 7. It is shown that the enzyme cannot diffuse into a hydrogel incubated in 20% (v/v) solution at 21 °C or 30% (v/v) solution at 7 °C. The most remarkable result is demonstrated by comparing the results for 20% at 7 °C and 21 °C. At the lower temperature the mesh size of the hydrogel is still big enough to not exclude the enzyme from diffusing into the gel. At 21 °C the mesh size is too small and the enzyme remains outside.
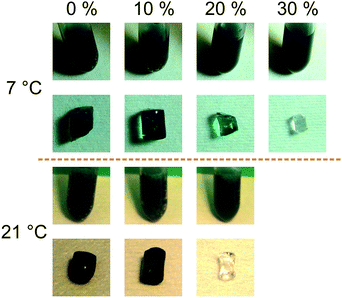 | ||
| Fig. 7 HRP diffusion at 7 °C and 21 °C at various ethanol concentrations (% (v/v)). The results for the filter process are shown together with the activity tests. | ||
To prove that the ethanol concentration does not inhibit the enzymatic reaction, hydrogen peroxide was added to the HRP-ABTS-water/organic solvent mixture in which the hydrogels were incubated. As shown in the pictures of the tubes (see Fig. 7) the enzymatic reaction is not significantly inhibited by ethanol.
3.3 Micro-pore size adjustment
Particle size exclusion in the micrometer range inside microfluidic systems is a challenging task. For size selection in this range sieve materials or structures have to be incorporated in the microfluidic chip. The sieving device will perform size exclusion of particles by its pre-defined dimensions and so the sieving properties cannot be altered and the sieve becomes a passive element.45–49 Therefore, different concepts for sieve design and preparation are required to perform multi-sieving steps in a microfluidic chip.By fabricating pores out of smart hydrogels, the pore area can be altered by environment conditions. Different conditions like temperature will alter the degree of swelling and therefore the pore area. To reduce the complexity of the chip, the condition for pore area adjustment (size exclusion property) was chosen as ethanol concentration and not temperature. Precise temperature control for each hydrogel in microfluidic channels with various temperatures is a complex task. Controlling the degree of swelling by organic solvent concentrations is easier, especially inside microfluidic networks.
Micro-pores based on PNIPAAm-co-SA were fabricated as described and incubated overnight in various ethanol concentrations. PNIPAAm-co-SA was chosen because of its higher degree of swelling compared to PNIPAAm. For the micro-pore preparation method (see Fig. 2) a higher degree of swelling is necessary to properly close the micro-pore. Microscopic images were taken of the different pore geometries after incubation.
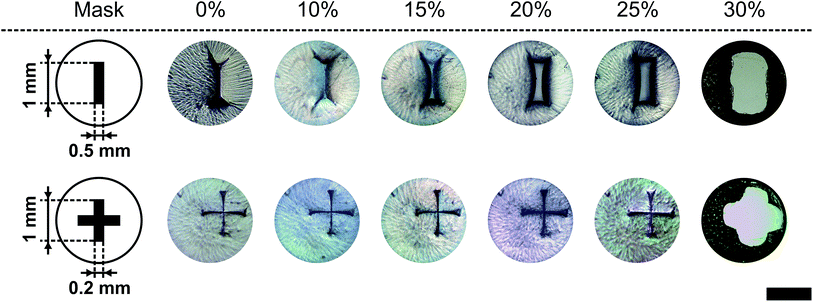
In Fig. 8 two pore geometries (rectangle and cross) are shown at different ethanol concentrations. It is demonstrated that the pore area can be adjusted depending on the ethanol concentration and the pre-defined geometry (see Fig. 9). Due to the shrinking process the polymer shrinks and opens the structure defined by the photo-lithographic process. Therefore, different ethanol concentrations can be used to alter the pore area and keep this constant at defined conditions. Fig. 9 demonstrates the dependency of the pore area on the applied ethanol concentration and structure dimensions. Rectangular structures with a low aspect ratio (rectangle height to rectangle width ratio, see Table 1) of the designed structure start opening at lower ethanol concentrations (see Fig. 9, rect2) compared to structures with higher aspect ratios (see Fig. 9, rect5). This behaviour is summarised in Fig. 10. With an increasing aspect ratio the threshold concentration, which demonstrates the ethanol concentration required to open the pore, rises also. That leads to the conclusion that pores with a lower aspect ratio of the designed structure can be operated over a wider concentration range compared to pores with a higher aspect ratio. Furthermore, Fig. 10 shows the dependency of the maximum pore area on the aspect ratio. With an increasing aspect ratio the maximum pore area decreases. This relationship is expected because a higher aspect ratio means a smaller pre-defined pore area in the fabrication process and therefore the pore in the open state should be smaller.
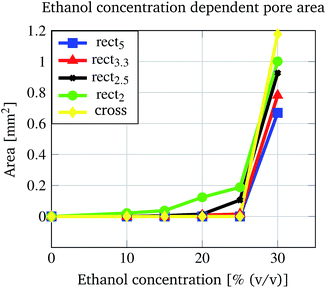 | ||
| Fig. 9 Dependency of the open pore area on the applied ethanol concentration and the pore structure. | ||
| Structure name | Height [mm] | Width [mm] | Aspect ratio |
|---|---|---|---|
| rect5 | 1 | 0.2 | 5 |
| rect3.3 | 1 | 0.3 | 3.3 |
| rect2.5 | 1 | 0.4 | 2.5 |
| rect2 | 1 | 0.5 | 2 |
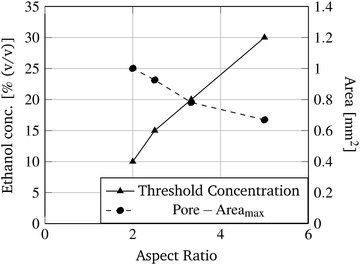 | ||
| Fig. 10 Threshold ethanol concentration and the maximum pore area dependence on the aspect ratio of rectangular structures (see Table 1) are demonstrated. | ||
3.4 Micro-pore opening kinetics
For performance investigations regarding the opening kinetics, time lapse images were recorded while the pores were incubated in 30% (v/v) ethanol/water mixture. 30% (v/v) was chosen because at this concentration every investigated micro-pore demonstrates an open state (Fig. 8). For the cross structure and two rectangular structures the results are shown in Fig. 11 (see also ESI S1 and S2†). The values were normalised to the pore area measured after 60 min. It can be seen that the cross structured pore opens faster than the rectangular pores and that the rectangular pore with a higher aspect ratio opens slower than the pore with a smaller aspect ratio. Because the hydrogel type and the scaffold (glass slide with drilled holes) are the same for every pore, the reasons for this behaviour have to lie in the pore structure and in the polymer mass which is forming the pores.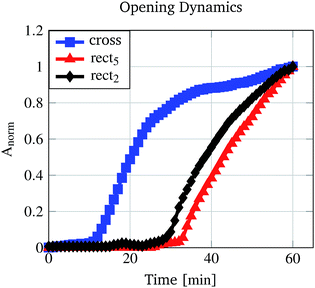 | ||
| Fig. 11 Pore opening kinetics measured by recording images for 60 min with one image per minute. The calculated areas were normalised to the measured area after 60 min. | ||
Table 2 summarises the volume of the polymer mass which is forming the pore and the volume of the pre-defined structure as well as their ratios. For the pore structures, the rect5 and rect2 ratios differ by approximately 3 times. The hydrogel shrinking process is initiated immediately when the pore is immersed in the water/ethanol mixture and for all kinetic investigations the ethanol concentration was equal. Therefore, the trigger signal for the shrinking process was the same for all pores. Nevertheless, for opening the rect5 pore, much more hydrogel material needs to shrink to a certain degree of swelling. This required degree of swelling is smaller for rect5 than for rect2. The hydrogel swelling and shrinking process can be compared with the loading or discharge process of a capacitor where the degree of swelling is the voltage analogue. For example, the discharging of a loaded capacitor (swollen hydrogel) to 10% (required degree of swelling for rect5 opening) requires a longer time than that for discharge to 50% (required degree of swelling for rect2 opening). As a result, rect2 opens faster than rect5 because of their different aspect ratios.
| Name | Structure volume | Polymer volume | Ratio |
|---|---|---|---|
| rect5 | 0.2 mm3 | 2.94 mm3 | 0.07 |
| rect2 | 0.5 mm3 | 2.64 mm3 | 0.19 |
| Cross | 0.4 mm3 | 2.74 mm3 | 0.15 |
The fastest opening kinetics was measured for the cross structure (Fig. 11). The reason for this is also due to the structure. The rectangular structures preferably open horizontally as can be seen in Fig. 11. The height of the rectangular pores does not change during the opening process, leading to the assumption that the material is restricted in this direction. The cross structure shows the largest pore area (Fig. 9) but does not have the largest pre-defined structure volume (Table 2). Therefore, the cross structure is less restricted than the rectangular structure so that the opening process requires less degree of swelling changes (and therefore less incubation time) than the rectangular structures.
3.5 Micro-pore down-scaling
To show that the presented method for micro-pore preparation (see Section 2.9) allows the fabrication of pore areas in the range of human cells, the rectangular and cross structures were down scaled and a polymer foil was used as a scaffold material instead of the glass slide. Fig. 12 shows two miniaturised pores in their closed state (0% (v/v)) and their opening state at 25% (v/v). Therefore, the presented method for pore fabrication also allows scaling of the pore geometry.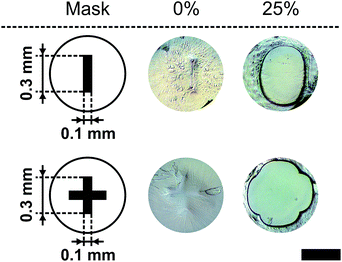 | ||
| Fig. 12 Miniaturisation for the rectangular and cross geometry from Fig. 8. The closed (0% (v/v)) and totally open states (25% (v/v)) are shown at 21 °C (black bar = 500 μm). | ||
4 Outlook
Filtering is a task which is required for e.g. biochemical assays with human blood. Here, cells (leukocytes, erythrocytes, thrombocytes and pathogens) often have to be separated from the plasma. To perform assays with blood plasma on a microfluidic chip a centrifugation step is necessary to separate the cells from the plasma. Alternatively, cells can be separated by filtration/size exclusion.To perform biochemical assays with blood plasma for cancer diagnostics, interesting biomarkers have to be harvested from blood plasma and protected from degradation. For this task hydrogels are of high interest because they are capable of being size selective and keeping biomolecules in their native state.
For both topics, micrometer range size selection (cell separation) and nanometer range size selection (small molecule harvesting), we show in the presented study approaches to use smart hydrogels. With the capability to adapt their size exclusion properties by easily altering their degree of swelling by chemical concentrations, powerful microfluidic devices can be fabricated without the need to define the gel properties prior to device usage. Moreover, complex temperature controlling systems for each hydrogel can be avoided, resulting in a concept which allows high integration densities of the demonstrated active components in 2D microfluidic systems and even in 3D microfluidic systems.
5 Discussion
In this paper we show a new principle for using stimuli responsive hydrogels and their organic solvent dependent degree of swelling. The hydrogels were used as adaptable molecular filters/diffusion barriers and as active pores in the micrometer range. Based on the stimuli responsiveness to water/organic solvent mixtures the mesh size can be altered. Therefore, molecules larger than the mesh size were excluded from diffusing into the gel, and the diffusion time for smaller molecules was increased. Furthermore, we have shown that the size of micro-pores made of PNIPAAm-co-SA can be continuously altered and kept constant by the ethanol concentration of the surrounding media (see ESI S3†). Besides, the demonstrated preparation method allows size scaling of the pore geometry.The fabrication of the described devices can be sped up by reducing the gel size. In the experiments, incubation times varied from minutes to hours. By reducing the dimensions of the hydrogels, they react faster to changes in their environmental conditions so that the incubation time especially for adjusting the pore area can be reduced to minutes or even seconds.
Because ethanol and other organic solvents hinder the final applications of the demonstrated concept, investigations focusing on the development of smart hydrogels which are sensitive to more biotechnologically applicable substances are ongoing. Here, previous publications show that phenylboronic-acid-based hydrogels are stimuli-sensitive to sugar (e.g. glucose50–54) concentrations which makes this material the material of choice for further investigations and applications.
Conflicts of interest
There are no conflicts of interest to declare.Acknowledgements
The authors thank Gerald Hielscher (Electronic Packaging Laboratory, Technische Universität Dresden) for preparing the photomasks. Further, the authors thank the Deutsche Forschungsgemeinschaft (Research Training Group 1865 ‘Hydrogel-based Microsystems’) and the Center for Advancing Electronics Dresden (cfaed) for financial support.References
- D. R. Gossett, W. M. Weaver, A. J. Mach, S. C. Hur, H. T. K. Tse, W. Lee, H. Amini and D. Di Carlo, Anal. Bioanal. Chem., 2010, 397, 3249–3267 CrossRef CAS PubMed.
- Z. J. Sahab, S. M. Semaan and Q.-X. A. Sang, Biomarker Insights, 2007, 2, 21–43 CrossRef PubMed.
- E. Ng, K. Chen, A. Hang, A. Syed and J. X. J. Zhang, Ann. Biomed. Eng., 2015, 44, 847–862 CrossRef PubMed.
- C. Wyatt Shields IV, C. D. Reyes and G. P. Lopez, Lab Chip, 2015, 15, 1230–1249 RSC.
- M. M. Wang, E. Tu, D. E. Raymond, J. M. Yang, H. Zhang, N. Hagen, B. Dees, E. M. Mercer, A. H. Forster, I. Kariv, P. J. Marchand and W. F. Butler, Nat. Biotechnol., 2005, 23, 83–87 CrossRef CAS PubMed.
- Y. Chen, P. Li, P.-H. Huang, Y. Xie, J. D. Mai, L. Wang, N.-T. Nguyen and T. J. Huang, Lab Chip, 2014, 14, 626–645 RSC.
- W. S. Mielczarek, E. A. Obaje, T. T. Bachmann and M. Kersaudy-Kerhoas, Lab Chip, 2016, 16, 3441–3448 RSC.
- M. Sonker, V. Sahore and A. T. Woolley, Anal. Chim. Acta, 2017, 986, 1–11 CrossRef CAS PubMed.
- A. Richter, J. Wenzel and K. Kretschmer, Sens. Actuators, B, 2007, 125, 569–573 CrossRef CAS.
- A. Richter, A. Türke and A. Pich, Adv. Mater., 2007, 19, 1109–1112 CrossRef CAS.
- A. Richter, A. Bund, M. Keller and K. F. Arndt, Sens. Actuators, B, 2004, 99, 579–585 CrossRef CAS.
- G. Gerlach, M. Guenther, J. Sorber, G. Suchaneck, K. F. Arndt and A. Richter, Sens. Actuators, B, 2005, 111–112, 555–561 CrossRef CAS.
- J. Hoffmann, M. Plötner, D. Kuckling and W. J. Fischer, Sens. Actuators, A, 1999, 77, 139–144 CrossRef CAS.
- S. Haefner, M. Rohn, P. Frank, G. Paschew, M. Elstner and A. Richter, Gels, 2016, 2, 10 CrossRef.
- Y.-C. Li, Y. S. Zhang, A. Akpek, S. R. Shin and A. Khademhosseini, Biofabrication, 2016, 9, 012001 CrossRef PubMed.
- D. J. Beebe, J. S. Moore, J. M. Bauer, Q. Yu, R. H. Liu, C. Devadoss and B. H. Jo, Nature, 2000, 404, 588–590 CrossRef CAS PubMed.
- D. T. Eddington and D. J. Beebe, Adv. Drug Delivery Rev., 2004, 56, 199–210 CrossRef CAS PubMed.
- P. Frank, J. Schreiter, S. Haefner, G. Paschew, A. Voigt and A. Richter, PLoS One, 2016, 11, 1–17 Search PubMed.
- R. Greiner, M. Allerdissen, A. Voigt and A. Richter, Lab Chip, 2012, 12, 5034–5044 RSC.
- A. Richter, S. Howitz, D. Kuckling, K. Kretschmer and K. F. Arndt, Macromol. Symp., 2004, 210, 447–456 CrossRef CAS.
- A. Richter, D. Kuckling, S. Howitz, T. Gehring and K. F. Arndt, J. Microelectromech. Syst., 2003, 12, 748–753 CrossRef.
- M. A. C. Stuart, W. T. S. Huck, J. Genzer, M. Müller, C. Ober, M. Stamm, G. B. Sukhorukov, I. Szleifer, V. V. Tsukruk, M. Urban, F. Winnik, S. Zauscher, I. Luzinov and S. Minko, Nat. Mater., 2010, 9, 101–113 CrossRef PubMed.
- X. Lin, R. Huang and M. Ulbricht, J. Mater. Chem. B, 2015, 4, 867–879 RSC.
- Y. Park, M. P. Gutierrez and L. P. Lee, Sci. Rep., 2016, 6, 39402 CrossRef PubMed.
- A. Gargava, C. Arya and S. R. Raghavan, ACS Appl. Mater. Interfaces, 2016, 8, 18430–18438 CAS.
- T. Meng, R. Xie, Y. C. Chen, C. J. Cheng, P. F. Li, X. J. Ju and L. Y. Chu, J. Membr. Sci., 2010, 349, 258–267 CrossRef CAS.
- A. Ehrenhofer, G. Bingel, G. Paschew, M. Tietze, R. Schröder, A. Richter and T. Wallmersperger, Sens. Actuators, B, 2016, 232, 499–505 CrossRef CAS.
- A. Patanarut, E. H. Williams, E. Petricoin, L. A. Liotta and B. Bishop, Polymers, 2011, 3, 1181–1198 CrossRef CAS.
- A. Luchini, D. H. Geho, B. Bishops, D. Tran, C. Xia, R. L. Dufour, C. D. Jones, V. Espina, A. Patanarut, W. Zhou, M. M. Ross, A. Tessitore, E. F. Petricoin and L. A. Liotta, Nano Lett., 2008, 8, 350–361 CrossRef CAS PubMed.
- R. R. Niedl and C. Beta, Lab Chip, 2015, 15, 2452–2459 RSC.
- H. T. Mitchell, S. A. Schultz, P. J. Costanzo, A. W. Martinez and C. D. Garcia, Chromatography, 2015, 2, 436–451 CrossRef CAS.
- S. Haefner, P. Frank, M. Elstner, J. Nowak, S. Odenbach and A. Richter, Lab Chip, 2016, 16, 3977–3989 RSC.
- S. Frost and M. Ulbricht, J. Membr. Sci., 2013, 448, 1–11 CrossRef CAS.
- M. A. M. E. Vertommen, H.-J. L. Cornelissen, C. H. J. T. Dietz, R. Hoogenboom, M. F. Kemmere and J. T. F. Keurentjes, J. Membr. Sci., 2008, 322, 243–248 CrossRef CAS.
- R. Xie, L.-Y. Chu, W.-M. Chen, W. Xiao, H.-D. Wang and J.-B. Qu, J. Membr. Sci., 2005, 258, 157–166 CrossRef CAS.
- C. A. Naini, S. Franzka, S. Frost, M. Ulbricht and N. Hartmann, Angew. Chem., Int. Ed., 2011, 50, 4513–4516 CrossRef CAS PubMed.
- A. Friebe and M. Ulbricht, Langmuir, 2007, 23, 10316–10322 CrossRef CAS PubMed.
- C. Geismann, A. Yaroshchuk and M. Ulbricht, Langmuir, 2007, 23, 76–83 CrossRef CAS PubMed.
- C. Geismann and M. Ulbricht, Macromol. Chem. Phys., 2005, 206, 268–281 CrossRef CAS.
- Y. Cui, C. Tao, S. Zheng, Q. He, S. Ai and J. Li, Macromol. Rapid Commun., 2005, 26, 1552–1556 CrossRef CAS.
- Y.-C. Chen, R. Xie, M. Yang, P.-F. Li, X.-L. Zhu and L.-Y. Chu, Chem. Eng. Technol., 2009, 32, 622–631 CrossRef CAS.
- N. Adrus and M. Ulbricht, J. Mater. Chem., 2012, 22, 3088–3098 RSC.
- G. Paschew, J. Schreiter, A. Voigt, C. Pini, J. P. Chávez, M. Allerdißen, U. Marschner, S. Siegmund, R. Schüffny, F. Jülicher and A. Richter, Adv. Mater. Technol., 2016, 1, 1–6 Search PubMed.
- P. Frank, D. Gräfe, C. Probst, S. Haefner, M. Elstner, D. Appelhans, D. Kohlheyer, B. Voit and A. Richter, Adv. Funct. Mater., 2017, 27, 1700430 CrossRef.
- Y. Yoon, S. Kim, J. Lee, J. Choi, R.-K. Kim, S.-J. Lee, O. Sul and S.-B. Lee, Sci. Rep., 2016, 6, 26531 CrossRef CAS PubMed.
- X. Fan, C. Jia, J. Yang, G. Li, H. Mao, Q. Jin and J. Zhao, Biosens. Bioelectron., 2015, 71, 380–386 CrossRef CAS PubMed.
- R. D. Sochol, D. Corbett, S. Hesse, W. E. R. Krieger, K. T. Wolf, M. Kim, K. Iwai, S. Li, L. P. Lee and L. Lin, Lab Chip, 2014, 14, 1405–1409 RSC.
- L. S. Lim, M. Hu, M. C. Huang, W. C. Cheong, A. T. L. Gan, X. L. Looi, S. M. Leong, E. S.-C. Koay and M.-H. Li, Lab Chip, 2012, 12, 4388–4396 RSC.
- L. R. Huang, Science, 2004, 304, 987–990 CrossRef CAS PubMed.
- A. Baldi, P. Loftness, R. Siegel and B. Ziaie, J. Microelectromech. Syst., 2003, 12, 613–621 CrossRef.
- L. Zhao, Q. Huang, Y. Liu, Q. Wang, L. Wang and S. Xiao, Materials, 2014, 10, 1–14 Search PubMed.
- G. Vancoillie and R. Hoogenboom, Sensors, 2016, 16, 1736–1754 CrossRef PubMed.
- A. Kim, S. K. Mujumdar and R. A. Siegel, Chemosensors, 2014, 2, 1–12 CrossRef.
- Y. Egawa, R. Miki and T. Seki, Materials, 2014, 7, 1201–1220 CrossRef PubMed.
Footnote |
| † Electronic supplementary information (ESI) available: Three videos showing the pore opening procedure for a rectangular pore (aspect ratio rect5) in video S1 and the opening procedure for a cross structured pore (video S2). In video S3 the filtering of two different sized particles is shown. The first particle (blue, diameter ≈ 0.5 mm) passes the pore structure. The second particle blocks the pore due to its larger size (white particle, diameter ≈ 1 mm). See DOI: 10.1039/c7ra07016k |
| This journal is © The Royal Society of Chemistry 2017 |

