 Open Access Article
The effects of PVP-modified SiO2 on the catalytic performance of CO hydrogenation over Rh–Mn–Li/SiO2 catalysts
Dan Ding,
Jun Yu *,
Qiangsheng Guo,
Xiaoming Guo,
Xiuzhen Xiao,
Dongsen Mao
 * and
Guanzhong Lu
Research Institute of Applied Catalysis, School of Chemical and Environmental Engineering, Shanghai Institute of Technology, Shanghai 201418, P. R. China. E-mail: yujun@sit.edu.cn; dsmao@sit.edu.cn; Fax: +86-21-60877231
First published on 16th October 2017
Abstract
Rh–Mn–Li catalysts supported on SiO2 prepared by PVP-modified Stöber method were used for the synthesis of C2+ oxygenates from CO hydrogenation. The catalysts were characterized by TG, XRD, N2-adsorption–desorption, TEM, H2-TPR, in situ FT-IR, TPSR, and XPS. Activity testing results showed that the Rh–Mn–Li catalyst supported on the SiO2 modified by 1 g PVP exhibited the highest CO conversion and selectivity of C2+ oxygenates compared with other catalysts. Characterization results indicated that the addition of an appropriate amount of PVP is beneficial to the formation of weakly H-bonded hydroxyl groups on the surface of SiO2, which promotes Rh dispersion and weakens the Rh–Mn interaction. Furthermore, the higher Rh dispersion and the weaker Rh–Mn interaction promote CO absorption, enhance the CO dissociation ability and restrain the hydrogenation activity, which are favorable for the CO insertion into the metal–CHX band, finally resulting in excellent catalytic performance for C2+ oxygenates synthesis.
1. Introduction
The search for processes to provide an alternative feedstock for chemicals and fuels has been promoted by the increasing concern about depletion of fossil fuel resources. Ethanol and other C2 oxygenates (e.g. acetaldehyde and acetic acid) are important raw chemicals and, among other possibilities, can be used as fuel additives.1,2 Thus, direct catalytic synthesis of C2 oxygenates from syngas, which can be conveniently manufactured from natural gas, coal and biomass, is one of the most promising technologies for societal development.3–5 The Rh-based catalysts have been found to display unique efficiency and selectivity in C2 oxygenates synthesis from CO hydrogenation.6–10 However, single Rh component exhibits a poor performance and primarily leads to formation of hydrocarbon products.11 Therefore, main efforts center on improving the efficiency of Rh and oxygenated compound selectivity by the modification of Rh with promoters and supports.7,12–18SiO2 is one of the most extensively used supports for Rh-based catalysts, and its properties play an important role in determining the catalytic properties.14,15,19 Solymosi et al.20 proposed that surface hydroxyl groups on silica play an important role in the change in the oxidation state of the metal, and the active sites of Rh+ can be formed via an oxidation of the Rh0 clusters by the surface OH groups of SiO2. Chen et al.21 observed that the Rh particles were more homogeneously dispersed when 14–20 mesh silica was used instead of 20–40 mesh as a support for Rh–Mn–Li catalyst. As a result, the space time yield and selectivity of C2+ oxygenates were significantly increased from 338.6 g kg−1 h−1 and 49.2% to 618.4 g kg−1 h−1 and 54.6%, respectively (T = 300 °C, P = 3 MPa, SV = 12![[thin space (1/6-em)]](https://www.rsc.org/images/entities/char_2009.gif) 500 h−1). In our previous studies, it was found that the activity of the Rh–Mn–Li/SiO2 catalyst for the synthesis of C2 oxygenates from syngas was enhanced greatly when a commercial SiO2 was replaced by a monodispersed SiO2 prepared by the Stöber method.22 It was also proved that the hydroxyl–metal interaction over the Rh–Mn–Li catalyst supported on different silica resulted in a change in the CO adsorption on Rh particles, leading to significantly different catalytic activities.23
500 h−1). In our previous studies, it was found that the activity of the Rh–Mn–Li/SiO2 catalyst for the synthesis of C2 oxygenates from syngas was enhanced greatly when a commercial SiO2 was replaced by a monodispersed SiO2 prepared by the Stöber method.22 It was also proved that the hydroxyl–metal interaction over the Rh–Mn–Li catalyst supported on different silica resulted in a change in the CO adsorption on Rh particles, leading to significantly different catalytic activities.23
Latterly, Li et al.24 designed a PVP-modified Stöber method for SiO2 synthesis, and the porosity of the SiO2 was expected to change. Based on such a strategy, they further prepared core–shell structured Ni@SiO2 catalysts and used in partial oxidation of methane to syngas. It was found that the catalytic activity was essentially determined by the size of the Ni cores, and also somewhat by the porosity of SiO2 shells. Based on these results, it is supposed that the properties of SiO2 can be changed by the PVP-modified Stöber method, which may influence on the catalytic activity of Rh–Mn–Li catalysts supported on PVP-modified SiO2 for CO hydrogenation. Thus, the effects of properties of the monodispersed SiO2 prepared by the PVP-modified Stöber method on the catalytic performance of Rh–Mn–Li/SiO2 catalysts were investigated in this work. Then, CO hydrogenation performance of the catalysts was correlated with the interaction extents among Rh, Mn and SiO2.
2. Experimental section
2.1. Catalyst preparation
SiO2 with different contents of polyvinyl pyrrolidone (PVP) was prepared by a modified Stöber method.25 In a typical synthesis, the solution A was prepared by mixing 21 ml tetraethylorthosilicate (TEOS) (99.5%, SCRC) with 50 ml anhydrous ethanol (99.7%, SCRC); the solution B was a mixture of 76 ml NH3·H2O (26 vol%, SCRC) and 200 ml anhydrous ethanol and weighed PVP (99.7%, SCRC). Secondly, the solution A was added slowly into the solution B in a flask under rapid stirring at 25 °C and reacted for 4 h. The white solid product was separated centrifugally at 7000 rpm for 5 minutes, washed with ethanol for three times and then dried at 90 °C for 12 h. The weight of PVP dissolved in solution B was 0 g, 0.5 g, 1.0 g and 3.0 g, respectively, and the corresponding products were denoted as SiO2, SiO2(0.5), SiO2(1) and SiO2(3). Before being used, they were calcined in air at 600 °C for 4 h.RhCl3 hydrate (Rh ∼ 39 wt%, Fluka), Mn(NO3)2·6H2O (99.99%, SCRC), LiNO3 (99.95%, SCRC) and the supports mentioned above were used in catalyst preparation. All the catalysts were prepared by the incipient wetness impregnation method, and Rh loading was 1.5 wt% based on the weight of support, and the weight ratio of Rh![[thin space (1/6-em)]](https://www.rsc.org/images/entities/char_2009.gif) :
:![[thin space (1/6-em)]](https://www.rsc.org/images/entities/char_2009.gif) Mn
Mn![[thin space (1/6-em)]](https://www.rsc.org/images/entities/char_2009.gif) :
:![[thin space (1/6-em)]](https://www.rsc.org/images/entities/char_2009.gif) Li = 1.5
Li = 1.5![[thin space (1/6-em)]](https://www.rsc.org/images/entities/char_2009.gif) :
:![[thin space (1/6-em)]](https://www.rsc.org/images/entities/char_2009.gif) 1.5
1.5![[thin space (1/6-em)]](https://www.rsc.org/images/entities/char_2009.gif) :
:![[thin space (1/6-em)]](https://www.rsc.org/images/entities/char_2009.gif) 0.07. Impregnated catalysts were dried at 90 °C for 4 h, and then at 110 °C overnight before calcined in air at 350 °C for 4 h. The obtained catalysts were denoted as RML/SiO2, RML/SiO2(0.5), RML/SiO2(1), and RML/SiO2(3), respectively. Elemental analysis by inductively coupled plasma (ICP) revealed good agreement between the expected and experimental values.
0.07. Impregnated catalysts were dried at 90 °C for 4 h, and then at 110 °C overnight before calcined in air at 350 °C for 4 h. The obtained catalysts were denoted as RML/SiO2, RML/SiO2(0.5), RML/SiO2(1), and RML/SiO2(3), respectively. Elemental analysis by inductively coupled plasma (ICP) revealed good agreement between the expected and experimental values.
2.2. Testing of the catalytic activity
CO hydrogenation was performed in a fixed-bed micro-reactor with length ∼350 mm and internal diameter ∼5 mm. The catalyst (0.3 g) diluted with inert α-alumina (1.2 g) was loaded between quartz wool and axially centered in the reactor tube, with the temperature monitored by a thermocouple close to the catalyst bed. Prior to reaction, the catalyst was heated to 400 °C (heating rate ∼3 °C min−1) and reduced with H2/N2 (molar ratio of H2/N2 = 1/9, total flow rate = 50 ml min−1) for 2 h at atmospheric pressure. The catalyst was then cooled down to 300 °C and the reaction started as gas flow was switched to a H2/CO mixture (molar ratio of H2/CO = 2, total flow rate = 50 ml min−1) at 3 MPa. All post-reactor lines and valves were heated to 150 °C to prevent product condensation. The products were analyzed for both hydrocarbons and oxygenates on-line (FL GC 9720) using a HP-PLOT/Q column (30 m, 0.32 mm ID) with detection with a flame ionization detector (FID) and a TDX-01 column with a TCD. The CO conversion was calculated based on the fraction of CO that formed carbon-containing products and the selectivity of a certain product was calculated based on carbon efficiency.262.3. Catalyst characterization
The thermogravimetric (TG) analysis was tested on the thermal analyzer (STA 499 F3, NETZSCH) heated at a rate of 10° per minute under a continuous flow of air (50 ml min−1).The X-ray powder diffraction (XRD) experiments were carried out with a PANalytical X'Pert diffractometer operated at 40 kV and 40 mA using Ni β-filtered Cu Kα radiation. Two theta angles ranged from 10 to 80° with a speed of 6° per minute. Textural properties were obtained using N2 adsorption–desorption at −196 °C on a Micromeritics ASAP 2020 HD88 adsorption apparatus. Before the adsorption/desorption measurements, all samples were degassed at 200 °C for 10 h. The specific surface area and pore volume were calculated by BET and BJH models, respectively. Transmission electron microscopy (TEM) images were obtained by TECNAI T20 operated at 200 kV. The metal loadings of the catalysts were determined by ICP-OES (PerkinElmer Optima 7000DV).
The amount of hydrogen adsorption of various catalysts was calculated on the basis of H2-TPD profiles. For H2-TPD measurements, the catalyst (0.1 g) was reduced in situ for 2 h at 400 °C in 10% H2/N2, and then was held at 400 °C for another 30 min before being cooled down to room temperature in He flow. The next step was H2 adsorption at room temperature for 0.5 h, and then the gas was swept again with He for 3 h. Subsequently, the sample was heated in a flowing He stream (50 ml min−1) up to ∼500 °C at a rate of 10 °C min−1, while the desorbed species was detected with a TCD detector. The uptake of H2 was used to calculate Rh metal dispersion and particle size, assuming that each surface metal atom adsorbs one H atom, i.e. H/Resurface = 1.
H2 temperature-programmed reduction (TPR) of the catalysts were carried out in a quartz micro-reactor. 0.1 g of the sample was first pretreated at 350 °C in O2/N2 (molar ratio of O2/N2 = 1/4) for 1 h prior to a TPR measurement. During the TPR experiment, H2/N2 (molar ratio of H2/N2 = 1/9) mixture was used at 50 ml min−1 and the reduction temperature ramped from 50 °C to 500 °C (10 °C min−1) while the effluent gas was analyzed with a thermal conductivity detector (TCD).
CO adsorption was studied using a Nicolet 6700 FTIR spectrometer equipped with a diffuse reflectance infrared Fourier transform (DRIFT) cell with CaF2 windows. The sample in the cell was pretreated in H2/N2 (molar ratio of H2/N2 = 1/9) at 400 °C for 2 h, followed by N2 (50 ml min−1) flushing at 400 °C for 0.5 h. During cooling down to the room temperature in N2, a series of background spectra were taken at different temperatures. Then, 1% CO/N2 (50 ml min−1) was introduced into the cell and the IR spectra at the desired temperatures were recorded. After heating up to 300 °C in CO/N2 mixture for 60 min, a H2 flow (1 ml min−1) was added into the flowing CO/N2, and the IR spectra were recorded as a function of time. Ultrahigh-purity N2, H2 and CO used in the IR investigations were further purified by dehydration and deoxygenization. The spectral resolution was 4 cm−1 with 64 interferograms being added to obtain a satisfactory signal-to-noise ratio.
The temperature-programmed surface reaction (TPSR) experiments were carried out as follows: after the catalyst was reduced at 400 °C in H2/N2 (molar ratio of H2/N2 = 1/9) for 2 h, it was cooled down to room temperature and CO was introduced for adsorption for 0.5 h; afterwards, the H2/N2 mixture was swept again, and the temperature was increased at the rate of 10 °C min−1 with a quadrupole mass spectrometer (QMS, Balzers OmniStar 200) as the detector to monitor the signal of CH4 (m/z = 15).
XPS measurements were performed using a Kratos Axis Ultra DLD spectrometer equipped with an Al Kα (1486.6 eV) X-ray source. In these experiments, samples were reduced in situ at 400 °C for 1 h under 200 mbar H2 pressure. The binding energies were calibrated relative to the C 1s peak from carbon contamination of the samples at 284.9 eV to correct for contact potential differences between the sample and the spectrometer.
3. Results and discussion
3.1. CO hydrogenation performance of the catalysts
The addition of different amounts of PVP modified the catalytic properties of the Rh–Mn–Li/SiO2 catalysts, as shown in Table 1. As observed, the CO conversion and selectivity of C2+ oxygenates increased first with the amounts of PVP doping, then reached a maximum at PVP amount of ca. 1.0 g, and decreased when the PVP addition reached 3.0 g. Moreover, the trend in turnover frequency (TOF) values of CO conversion over the catalysts was consistent with that of CO conversion. Interestingly, it is obvious that the selectivity of ethanol did not change obviously as the addition of PVP, while it indeed could accelerate the formation of acetaldehyde. On the other hand, the selectivity of hydrocarbons decreased noticeably over RML/SiO2(0.5) and RML/SiO2(1) catalysts, which indicated that the ability of hydrogenation can be inhibited on the catalysts modified by appropriate amount of PVP. Overall, it can be seen that the RML/SiO2(1) catalyst obtained the highest CO conversion and selectivity of C2+ oxygenates, and the yield of C2+ oxygenates reached the maximum of 290.4 g kg−1 h−1.| Catalyst | CO conv. (C%) | TOFd (s−1) | Selectivity of products (C%) | STY(C2+ Oxy) (g kg−1 h−1) | ||||||
|---|---|---|---|---|---|---|---|---|---|---|
| CO2 | CH4 | MeOH | AcH | EtOH | C2+ HCb | C2+ Oxyc | ||||
| a Reaction conditions: T = 300 °C, P = 3 MPa, catalyst: 0.3 g, and flow rate = 50 ml min−1 (H2/CO = 2), data taken after 15 h when steady state reached. Experimental error: ±5%.b C2+ HC denotes hydrocarbons containing two and more carbon atoms.c C2+ Oxy denotes oxygenates containing two and more carbon atoms.d TOF based on CO conversion and H2 chemisorption. | ||||||||||
| RML/SiO2 | 18.9 | 0.152 | 3.8 | 17.1 | 4.3 | 18.6 | 14.4 | 37.6 | 37.2 | 192.3 |
| RML/SiO2(0.5) | 22.3 | 0.169 | 3.4 | 13.8 | 3.0 | 22.1 | 14.4 | 36.4 | 43.4 | 262.5 |
| RML/SiO2(1) | 24.8 | 0.183 | 3.6 | 14.1 | 2.7 | 21.5 | 14.7 | 36.1 | 43.5 | 290.4 |
| RML/SiO2(3) | 19.8 | 0.154 | 2.9 | 14.4 | 2.5 | 21.0 | 13.6 | 39.3 | 40.9 | 222.2 |
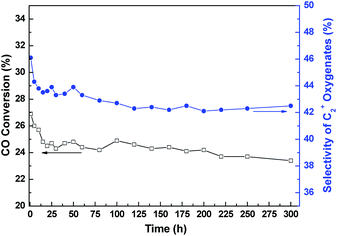
Typical time dependent changes of CO conversion and C2+ oxygenates selectivity over the representative RML/SiO2(1) catalyst are shown in Fig. 1. It can be seen that both the CO conversion and C2+ oxygenates selectivity decreased distinctly during the first 15 h on stream. However, the catalyst kept good stability after 15 h, and the catalytic activity was hardly reduced until 300 h.
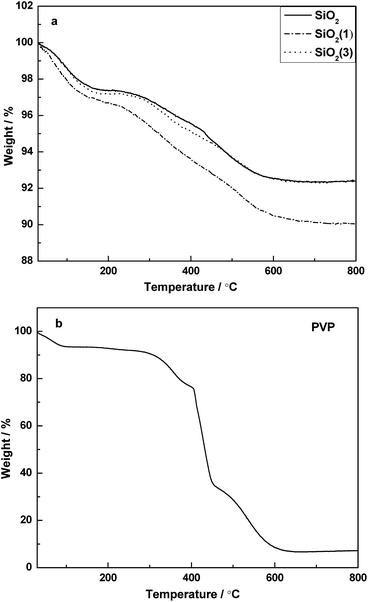
3.2. TG analysis
Fig. 2 shows the TG patterns of PVP and the corresponding supports before calcination. For the supports before calcination, it is clear that a continuous weight loss occurred from room temperature to about 600 °C. The process of weight loss can be divided mainly into two steps. The weight loss observed from room temperature to 150 °C should be attribute to the desorption of adsorbed water. Combined with the TG pattern of PVP (Fig. 2b), the second step of weight loss started from ∼250 °C to ∼600 °C, and it can be attributed to the combined effect from both of the PVP decomposition and partial de-hydroxylation being converted into oxides on the surface.Compared with the precursor of SiO2, the precursor of SiO2(1) lost more than 2.5% weight during the heating process, which suggested that the PVP was successfully doped into SiO2(1). However, it is curious that the TG pattern of SiO2(3) was similar to that of SiO2, which inferred that the PVP cannot be doped into the support if the amount of PVP provided is too high in the preparation process. Moreover, it is indicated that when the temperature > 600 °C, the PVP can be completely decomposed. Thus, the supports were designed to calcine at 600 °C.
3.3. Structural and textural properties of catalysts
XRD patterns of silica with different PVP contents (not shown) and the corresponding catalysts (Fig. 3) showed no crystalline phases, indicating that the SiO2 were XRD-amorphous and the metal particles were highly dispersed on the supports or below the detection limit of XRD due to the small content.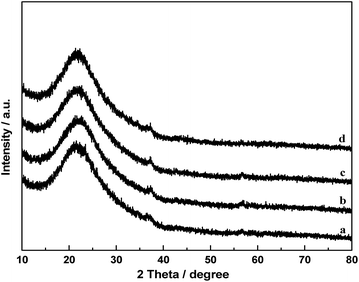 | ||
| Fig. 3 XRD patterns of the catalysts: (a) RML/SiO2, (b) RML/SiO2(0.5), (c) RML/SiO2(1), (d) RML/SiO2(3). | ||
N2 adsorption–desorption was used to characterize the texture of supports and the corresponding catalysts. As shown in Table 2, the specific surface area of supports were measured to be ca. 8.0 m2 g−1. Similar surface areas of SiO2 prepared by the Stöber method have been reported by Szekeres et al.25 and Hsu et al.27 Upon being loaded with metal components, there were a slight decrease in the surface area. With respect to the pore size, the pore diameter of SiO2 was 7.9 nm. Compared with the support of SiO2, the pore diameter of SiO2(0.5) and SiO2(1) increased slightly, which suggested that an appropriate amount of PVP can be doped into the silica during syntheses, and the decomposition of PVP in calcination slightly enlarged the pore size. Moreover, the amount of hydrogen adsorption of various catalysts calculated on the basis of their H2-TPD profiles is summarized in Table 2. It can be seen that the amount of hydrogen adsorption slightly increased first with the amounts of PVP doping, but decreased when the PVP addition reached 3.0 g.
| Sample | SBET (m2 g−1) | VP (cm3 g−1) | DP (nm) | H2 chemisorption (μmol g−1) |
|---|---|---|---|---|
| SiO2 | 8.0 | 0.050 | 7.9 | — |
| SiO2(0.5) | 8.2 | 0.061 | 9.0 | — |
| SiO2(1) | 8.5 | 0.062 | 8.9 | — |
| SiO2(3) | 7.9 | 0.054 | 8.1 | — |
| RML/SiO2 | 4.5 | 0.037 | 7.4 | 23.1 |
| RML/SiO2(0.5) | 4.6 | 0.041 | 8.4 | 24.6 |
| RML/SiO2(1) | 4.4 | 0.038 | 8.5 | 25.2 |
| RML/SiO2(3) | 4.3 | 0.042 | 7.7 | 23.9 |
In comparison, no significant difference was observed in the pore sizes after loaded probably due to the fact that the concentrations of Rh and promoters were relatively low in all the catalysts. Combined with the catalytic activity, it is supposed that the specific surface area and pore size of the catalyst are not directly related to the catalytic performance of the catalyst.
Fig. 4 shows the TEM micrographs and the corresponding Rh particle size distributions of catalysts. As shown in Fig. 4A, C and E, the particles of supports were monodispersed spherical with a mean size of 500 nm. According to the TEM micrographs of catalysts (Fig. 4B, D and F), it can be seen that the Rh particles loading on the support of SiO2(1) were more uniform, the mean size of Rh particles was 17 nm. However, compared with the RML/SiO2(1) catalyst, the distributions of Rh particles loading on SiO2 and SiO2(3) were wide, and the sizes of Rh particles became larger.
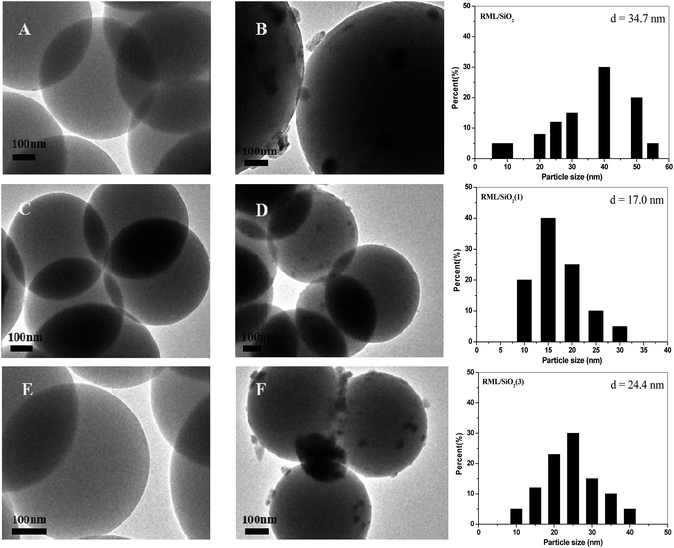 | ||
| Fig. 4 TEM images of SiO2 (A), RML/SiO2 (B), SiO2(1) (C), RML/SiO2(1) (D), SiO2(3) (E), RML/SiO2(3) (F) and Rh particle size distributions of different catalysts. | ||
Combined with the catalytic results, it is conceivable that the size of Rh particles has a remarkable influence on the activity and selectivity of Rh–Mn–Li/SiO2 for CO hydrogenation. The results showed that the Rh particles loading on the SiO2 modified by a moderate amount of PVP were smaller and more uniform, which, in turn, was reflected by the excellent catalytic activity along with the higher C2+ oxygenates selectivity over the catalyst of RML/SiO2(1).
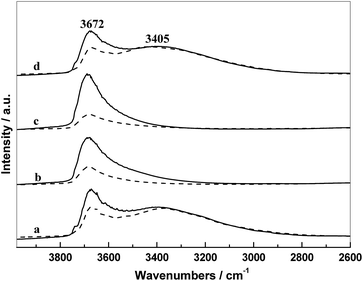
The IR spectra of supports and the corresponding catalysts in N2 atmosphere at 300 °C are presented in Fig. 5. In these IR spectra, there are two main absorption regions: the first band at 3672 cm−1 is assigned to the weakly H-bonded OH groups; and the second region in the range 3500–2750 cm−1 with a maximum at 3465 cm−1 originates from the absorption of H2O and strongly H-bonded OH groups.19,28
As shown in Fig. 5, there were different intensities of the hydroxyl groups on the different silica surface. Almost weakly H-bonded hydroxyls covered on the surface of SiO2(0.5) and SiO2(1), whereas the surface of SiO2 and SiO2(3) exhibited more strongly H-bonded hydroxyls accompanied by partial weakly H-bonded hydroxyls. It is indicated that the surface property of SiO2 and SiO2(3) were almost the same, suggesting that the PVP added with a high amount (3 g) cannot be doped into silica during the preparation, which is consistent with the result of TG. Furthermore, the intensity of the hydroxyl groups on supports changed obviously after supporting metal components. It can be seen that the weakly H-bonded hydroxyls decreased distinctly and the strongly H-bonded hydroxyls were almost unchanged, which can be attributed mainly to a strong interaction only occurred between the metal components and weakly H-bonded hydroxyls. Since the surface of SiO2(0.5) and SiO2(1) covered more weakly H-bonded hydroxyl groups compared with that of SiO2 and SiO2(3), more metal components can be interacted during the course of catalyst preparation, resulting that more decrease in the absorption intensity of hydroxyl groups of SiO2(0.5) and SiO2(1) after supporting.
By combining the activities of catalysts and the result of TEM, it can be further inferred that more hydroxyl–metal interaction occurred on the surface of SiO2(0.5) and SiO2(1), which is more conducive to the dispersion of Rh, finally resulting in the better catalytic performances of RML/SiO2(0.5) and RML/SiO2(1).
3.4. The reducibility of the catalysts
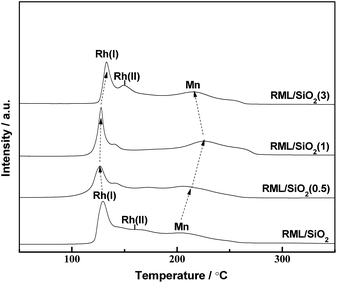
Fig. 6 shows the temperature-programmed reduction (TPR) profiles of the catalysts with different PVP doping. There were three distinct reduction peaks in the TPR profile of RML/SiO2. According to the literatures,7,29 the low temperature peak at 130 °C and the shoulder at 160 °C are ascribed to the reduction of Rh2O3 not intimately contacting with Mn species (denoted as Rh(I) species) and of Rh2O3 intimately contacting with Mn species (denoted as Rh(II) species), respectively. The high temperature peak at 200 °C can be ascribed to the reduction of MnO2 species.17,30As shown in Fig. 6, following the increase of PVP amount, the reduction peak of MnO2 moved to the higher temperature in company with the decrease of the reduction temperature of Rh2O3. Considering that the width of temperature region between Rh and Mn oxides reduction peaks can be a judge for the strength of Rh–Mn interaction, the larger width of temperature region between Rh and Mn oxides reduction peaks indicates a weaker Rh–Mn interaction. It is indicated that the surface properties of SiO2 modified with appropriate amount of PVP can weaken the Rh–Mn interaction. Combined with the hydroxyls information observed by FT-IR and the result of TEM, it is proposed that there were more weakly H-bonded hydroxyls on the surface of SiO2(0.5) and SiO2(1), and the more interaction between the metal components and weakly H-bonded hydroxyls increased the metal dispersion and weakened the Rh–Mn interaction.
However, the reduction temperatures of Rh2O3 and MnO2 species in the TPR profile of RML/SiO2(3) were similar with that of RML/SiO2, indicating that SiO2 and SiO2(3) had the similar surface properties, which is in line with the above IR study.
3.5. FT-IR study
A series of IR spectra of the in situ reduced catalysts with different PVP amounts after CO adsorption at 30 °C for 30 min are shown in Fig. 7. It can be seen that the IR spectrum was mainly composed by a doublet at 2100 and 2037 cm−1 and a band at around 2068 cm−1. According to the literatures,31,32 the 2068 cm−1 band can be ascribed to the linear adsorbed CO [CO(l)] and the doublet can be assigned to the symmetric and asymmetric carbonyl stretching of the gem-dicarbonyl Rh+(CO)2 [CO(gdc)]. It is widely accepted that the CO(gdc) is formed on the Rh+ sites and CO(l) is on the Rh0 sites.15,33 It is worthy to note that the intensity of CO adsorption increased in the order of RML/SiO2 < RML/SiO2(3) < RML/SiO2(0.5) < RML/SiO2(1), suggesting that high Rh dispersion and CO adsorption capacity were achieved by the assisting of hydroxyl–metal interaction, which is also consistent with the result of CO conversion.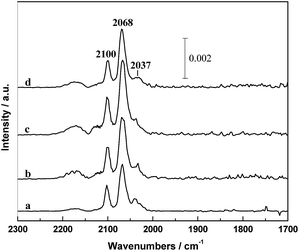 | ||
| Fig. 7 The infrared spectra of absorbed CO in the He flow at 30 °C: (a) RML/SiO2, (b) RML/SiO2(0.5), (c) RML/SiO2(1), (d) RML/SiO2(3). | ||
Fig. 8 shows the infrared spectra of absorbed CO on different catalysts at 300 °C and followed by flushing with 10% H2/N2. It can be seen that all the samples only appeared the peak of CO(l) at 300 °C and the intensity decreased as a function of time, which indicated that the CO(l) species is the mainly reactive species at the reaction temperature. The rates of decrease in the band for CO(l) on different catalysts followed the order as shown in Fig. 8: RML/SiO2(1) ≈ RML/SiO2(0.5) < RML/SiO2 ≈ RML/SiO2(3).
 | ||
| Fig. 8 The infrared spectra of absorbed CO on different catalysts at 300 °C and followed by hydrogenation with hydrogen: (a) RML/SiO2, (b) RML/SiO2(0.5), (c) RML/SiO2(1), (d) RML/SiO2(3). | ||
It is conceivable that, the more hydroxyl–metal interaction occurred on the surface of SiO2(0.5) and SiO2(1) weakened the Rh–Mn interaction. The weak Rh–Mn interaction might restrain the hydrogenation activity on Rh particles, then decreased the consuming of absorbed CO by hydrogenation, resulting in a low hydrogenation activity of RML/SiO2(0.5) and RML/SiO2(1).
3.6. TPSR
The temperature-programmed surface reaction (TPSR) is one of the most effective way to study the catalytic activity by the hydrogenation of adsorbed CO. Fig. 9 displays the TPSR profiles of the samples. It can be seen that on the profiles of RML/SiO2 and RML/SiO2(3), the peaks of CH4 formation were centered at 260–265 °C; however, the CH4 peak shifted to ca. 245 °C on RML/SiO2(0.5) and RML/SiO2(1) catalysts. In addition, the amount of CH4 produced by the catalysts were different, following the order as shown in Table 3: RML/SiO2 > RML/SiO2(3) > RML/SiO2(1) > RML/SiO2(0.5).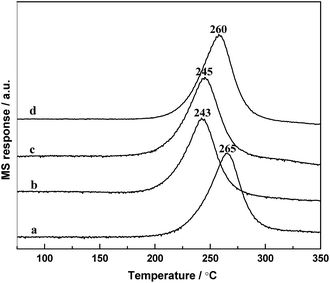 | ||
| Fig. 9 The TPSR profiles of the different catalysts: (a) RML/SiO2, (b) RML/SiO2(0.5), (c) RML/SiO2(1), (d) RML/SiO2(3). | ||
According to the literature,34 the temperature of CH4 formation can be used as a tool for determining the ability of CO dissociation, and the peak intensity of CH4 formation can reflect the number of active sites responsible for methane production. Based on the above results, it can be concluded that compared with the supports of SiO2 and SiO2(3), the metal components supported on SiO2(0.5) and SiO2(1) obtained a weaker Rh–Mn interaction due to the stronger hydroxyl–metal interaction, which may promote the ability of CO dissociation and decrease the temperature of CH4 formation. On the other hand, it is usually considered that the formation of hydrocarbons from CHX hydrogenation and the formation of C2 oxygenates from CO insertion are the couple of competitive reaction, and the relative reaction rate between them determines the activity and selectivity forwards C2+ oxygenates.35 Combined with the reactive performance, it is suggested that the good ability of CO dissociation in company with moderate hydrogenation activity exhibited on the catalysts modified by appropriate amount of PVP (0.5–1 g) are conducive to the formation of C2+ oxygenates.
3.7. XPS
The chemical states of Rh on catalyst surfaces before and after reduction at 400 °C have been studied by XPS. The 3d spectrum of Rh in all the fresh catalysts are presented in Fig. 10A, it can be seen that the binding energy of the Rh 3d5/2 peaks were centered at 309.8 eV, indicating that Rh species existed as Rh2O3. The Rh 3d core level spectrum of catalysts after in situ reduction are displayed in Fig. 10B. It is observed that the binding energy of the Rh 3d5/2 peaks were located at 306.8–307.0, indicating that Rh0 is the major Rh species on all the reduced catalysts. However, it is obvious that the binding energy of Rh 3d5/2 of RML/SiO2 and RML/SiO2(3) were shifted to higher values, suggesting that the electronic density on Rh particles decreased.31 It is inferred that some partially positively charged Rhδ+ species also co-exist with Rh0 on the surface of RML/SiO2 and RML/SiO2(3) catalysts after reduction. Considering that the electrons of rhodium atoms can be attracted by the electron-withdrawing property of Mn, the presence of Rhδ+ species can be attributed to the stronger Rh–Mn interaction obtained on the surfaces of SiO2 and SiO2(3), which is in good agreement with the result of H2-TPR.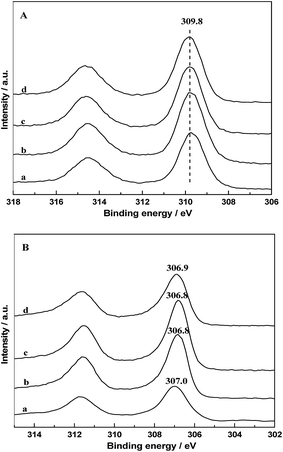 | ||
| Fig. 10 Rh 3d XPS patterns of fresh (A) and reduced (B) catalysts: (a) RML/SiO2, (b) RML/SiO2(0.5), (c) RML/SiO2(1), (d) RML/SiO2(3). | ||
4. Conclusions
The effects of the properties of PVP-modified SiO2 on the catalytic performance of Rh–Mn–Li/SiO2 catalysts for the synthesis of C2+ oxygenates from syngas were investigated. The results showed that the addition of PVP markedly influenced the catalytic performance of Rh–Mn–Li/SiO2 catalysts on CO hydrogenation, and the RML/SiO2(1) catalyst exhibited the highest CO conversion and selectivity of C2+ oxygenates compared with other catalysts.By combining the structural and textural properties of the samples with the result of TG, it is proved that only an appropriate amount of PVP can be doped successfully into the silica during the preparation process, and the addition of appropriate amount of PVP is beneficial to the formation of weakly H-bonded hydroxyls groups on the surface of SiO2. The result of TEM and H2-TPR further suggested that the interaction between metal components and weakly H-bonded hydroxyls can promote the Rh dispersion and weaken the Rh–Mn interaction. Moreover, based on the result of IR and TPSR, it is conceivable that the higher Rh dispersion and weaker Rh–Mn interaction promote the CO absorption, enhance the CO dissociation ability and restrain the hydrogenation activity, which are favorable for the CO insertion into metal–CHX band, finally resulting in the excellent catalytic performance of RML/SiO2(1) for C2+ oxygenates synthesis.
Conflicts of interest
There are no conflicts to declare.Acknowledgements
The authors gratefully acknowledge financial support from the Science and Technology Commission of Shanghai Municipality (08520513600), Leading Academic Discipline Project of Shanghai Education Committee (J51503) and Shanghai Municipal Science and Technology Commission (13ZR1461900).Notes and references
- J. J. Spivey and A. Egbebi, Chem. Soc. Rev., 2014, 36, 1514–1528 RSC.
- J. R. Rostrup-Nielsen, Science, 2005, 308, 1421–1422 CrossRef CAS PubMed.
- V. Subramani and S. K. Gangwal, Energy Fuels, 2008, 22, 814–839 CrossRef CAS.
- D. H. Mei, R. Rousseau, S. M. Kathmann, V. A. Glezakou, M. H. Engelhard, W. Jiang, C. Wang, M. A. Gerber, J. F. White and D. J. Stevens, J. Catal., 2010, 271, 325–342 CrossRef CAS.
- G. Chen, C. Y. Guo, X. Zhang, Z. Huang and G. Yuan, Fuel Process. Technol., 2011, 92, 456–461 CrossRef CAS.
- J. W. Magee, R. M. Palomino and M. G. White, Catal. Lett., 2016, 146, 1771–1779 CrossRef CAS.
- H. M. Yin, Y. J. Ding, H. Y. Luo, H. Z. Zhu, D. P. He, J. M. Xiong and L. W. Lin, Appl. Catal., A, 2003, 243, 155–164 CrossRef CAS.
- J. J. Liu, Z. Guo, D. Childers, N. Schweitzer, C. L. Marshall, R. F. Klie, J. T. Mille and R. J. Mey, J. Catal., 2014, 313, 149–158 CrossRef CAS.
- J. L. Gong, H. R. Yue, Y. J. Zhao, S. Zhao, L. Zhao, J. Lv, S. P. Wang and X. B. Ma, J. Am. Chem. Soc., 2012, 134, 13922–13925 CrossRef CAS PubMed.
- M. Haider, M. R. Gogate and R. J. Davis, J. Catal., 2009, 26, 9–16 CrossRef.
- J. Yu, D. S. Mao, D. Ding, X. M. Guo and G. Z. Lu, J. Mol. Catal. A: Chem., 2016, 423, 151–159 CrossRef CAS.
- Z. L. Fan, W. Chen, X. L. Pan and X. H. Bao, Catal. Today, 2009, 147, 86–93 CrossRef CAS.
- Y. F. Liu, F. Göeltl, I. Ro, M. R. Ball, C. Sener, I. B. Aragão, D. Zanchet, G. W. Huber, M. Mavrikakis and J. A. Dumesic, ACS Catal., 2017, 7, 4550–4563 CrossRef CAS.
- S. W. Ho and Y. S. Su, J. Catal., 1997, 168, 51–59 CrossRef CAS.
- D. H. Jiang, Y. J. Ding, Z. D. Pan, W. M. Chen and H. Y. Luo, Catal. Lett., 2008, 121, 241–246 CrossRef CAS.
- W. Liu, S. Wang and S. Wang, Appl. Catal., A, 2016, 510, 227–232 CrossRef CAS.
- H. Y. Luo, P. Z. Lin, S. B. Xie, H. W. Zhou, C. H. Xu, S. Y. Huang, L. W. Lin, D. B. Liang, P. L. Yin and Q. Xin, J. Mol. Catal. A: Chem., 1997, 122, 115–123 CrossRef CAS.
- X. H. Mo, J. Gao, N. Umnajkaseam and J. G. Goodwin Jr, J. Catal., 2009, 267, 167–176 CrossRef CAS.
- P. Basu, D. Panayotov and J. T. Yates, J. Am. Chem. Soc., 1988, 110, 2074–2081 CrossRef CAS.
- F. Solymosi, I. Tombacz and M. Kocsis, J. Catal., 1982, 75, 78–93 CrossRef CAS.
- W. M. Chen, Y. J. Ding, D. H. Jiang, Z. D. Pan and H. Y. Luo, Catal. Lett., 2005, 104, 177–180 CrossRef CAS.
- J. Yu, D. S. Mao, G. Z. Lu, Q. S. Guo and L. P. Han, Catal. Commun., 2012, 24, 25–29 CrossRef CAS.
- J. Yu, D. S. Mao, L. P. Han, Q. S. Guo and G. Z. Lu, J. Mol. Catal. A: Chem., 2013, 367, 38–45 CrossRef CAS.
- L. Li, S. C. He, Y. Y. Song, J. Zhao, W. J. Ji and C.-T. Au, J. Catal., 2012, 288, 54–64 CrossRef CAS.
- M. Szekeres, O. Kamalin, P. G. Grobet, R. A. Schoonheydt, K. Wostyn, K. Clays, A. Persoons and I. Dékány, Colloids Surf., A, 2003, 227, 77–83 CrossRef CAS.
- L. P. Han, D. S. Mao, J. Yu, Q. S. Guo and G. Z. Lu, Appl. Catal., A, 2013, 454, 81–87 CrossRef CAS.
- W. P. Hsu, R. Yu and E. Matijević, J. Colloid Interface Sci., 1993, 156, 56–65 CrossRef CAS.
- J. B. Peri, J. Phys. Chem., 1966, 70, 2937–2945 CrossRef CAS.
- D. H. Jiang, Y. J. Ding, Z. D. Pan, X. M. Li, G. P. Jiao, J. W. Li, W. M. Chen and H. Y. Luo, Appl. Catal., A, 2007, 331, 70–77 CrossRef CAS.
- T. Ioannides and X. Verykios, J. Catal., 1993, 140, 353–369 CrossRef CAS.
- J. Raskó and J. Bontovics, Catal. Lett., 1999, 58, 27–32 CrossRef.
- P. Basu, D. Panayotov and J. T. Yates, J. Phys. Chem., 1987, 91, 3133–3136 CrossRef CAS.
- F. Solymosi and M. Pasztor, J. Phys. Chem., 1986, 90, 5312–5317 CrossRef CAS.
- M. Ojeda, M. L. Granados, S. Rojas, P. Terreros, F. J. Garcia-Garcia and J. L. J. Fierro, Appl. Catal., A, 2004, 261, 47–55 CrossRef CAS.
- Y. M. Choi and P. Liu, J. Am. Chem. Soc., 2009, 131, 13054–13061 CrossRef CAS PubMed.
| This journal is © The Royal Society of Chemistry 2017 |

