 Open Access Article
Folic acid-conjugated carbon dots as green fluorescent probes based on cellular targeting imaging for recognizing cancer cells†
Xuewei Zhaoa,
Junli Zhanga,
Lihong Shi a,
Ming Xianb,
Chuan Dong
 a and
Shaomin Shuang
 *a
*a
aDepartment of Chemistry and Chemical Engineering, Center of Environmental Science and Engineering Research, Shanxi University, Taiyuan, 030006, China. E-mail: smshuang@sxu.edu.cn; Fax: +86-351-7011688; Tel: +86-351-7018842
bDepartment of Chemistry, Washington State University, Pullman, WA 99164, USA
First published on 30th August 2017
Abstract
Implementing visual detection of cancer cells has the potential to contribute greatly to basic biological research; early diagnosis of cancer is still a challenging issue. In this work, we designed and fabricated folic acid-conjugated fluorescent carbon dots (FA-CDs) for targeted imaging of cancer cells. The green fluorescent CDs were prepared by a facile hydrothermal treatment of dandelion as the carbon source and ethanediamine (EDA). The surfaces of the CDs possessed active amino groups for further covalent conjugation with FA. The uptake of FA-CDs into HepG-2 cells occurs via receptor-mediated endocytosis; this was confirmed by a comparative experiment using FR-negative (FR−) PC-12 cells as revealed by confocal laser scanning microscopy. Intracellular experiments demonstrated that the FA-CDs could accurately recognize positive FR (FR++/FR+) cancer cells in different cell mixtures of MCF-7/HepG-2 cells and HepG-2/PC-12 cells and could distinctly indicate the expression level of FR on the membranes of the cancer cells. The FA-CDs show excellent biocompatibility and low toxicity and may have great potential as an effective tool for accurately differentiating cancer cells from normal cells, in addition to cancer detection, prognosis, and individualized treatment.
1 Introduction
Implementing the visual detection of cancer cells may contribute greatly to basic biological research and early diagnosis of cancer. The combination of fluorescence spectroscopy with confocal laser scanning microscopy provides an effective analytical tool for biomolecule detection, non-invasive single-cell analysis and biomedical imaging1,2 due to its high sensitivity and spatiotemporal resolution.3,4 Fluorescence imaging can visualize the expression and activity of specific molecules as well as cells and biological processes that influence tumour behaviour and/or response to therapeutic drugs.5 In recent years, numerous cancer biomarkers have provided tremendous opportunities for improving the management of cancer patients by enhancing the efficiency of detection and the efficacy of treatment.6 For visualizing cancer biomarkers, targeting ligands, including transferrin,7 folic acid (FA),8 and peptides,9 are generally coupled with fluorescent nanoparticles that bind to the corresponding biomarker that is overexpressed on cancer cells.Among targeting ligands, folic acid (FA), a low-molecular-weight vitamin, plays an essential role in cell survival and binds with high affinity (Kd: 0.1–1 nmol L−1) to the folate receptor (FR), a membrane-anchored protein that is a cancer biomarker.10,11 Meanwhile, FR levels are high in specific malignant tumours of epithelial origin compared to normal cells, including ovarian, endometrial, kidney and breast, and are positively associated with tumour stage and grade.12,13 Moreover, FA, folate analogues, or folate complex can specifically bind with FRs on the surface of cancer cell membranes and then enter into cells via receptor-mediated endocytosis with non-immunogenicity.14,15 Due to its different levels of expression between cancer and normal cells, it is possible to distinguish cancer cells by means of detecting the expression level of FR. As a consequence, FA may serve as a promising ligand for specific FR detection and cancer diagnosis.
Recently, numerous studies have investigated nanomaterials for bio-sensing, biological imaging and diagnostics applications. To date, commonly used nanomaterials include gold nanoparticles,16 silver nanoclusters,17 magnetic nanoparticles18 and quantum dots.19,20 Among the applications of nanomaterials, grafting nanomaterials with FA for targeted fluorescence imaging of cancer cells has attracted much attention. The matrix-materials provide a platform for visual detection in the prognosis of cancer. However, some of these materials are expensive, involve complicated preparation methods or have potentially toxic effects; furthermore, multi-functionalization steps for covalent conjugation of folic acid on fluorescent nanomaterials may negatively affect the fluorescence intensity of the nanomaterials and/or the suspension stability of the particulate system.21 Thus, the development of cost-effective, readily fabricated and non-cytotoxic nanomaterials for targeted fluorescence imaging of cancer cells is highly desirable.
Fluorescent carbon dots (CDs) are excellent fluorescent carbon nanomaterials that have attracted much attention because of their fascinating photoluminescence properties, excellent photostability, and remarkable biocompatibility.22–25 Ma et al.26 firstly developed fluorescent CDs covalently conjugated with folic acid to target human cervical carcinoma cells. This research opened a new route for targeted fluorescence imaging of cancer cells. Ouyang et al.27 designed a turn-on fluorescence probe using folic acid to functionalize fluorescent CDs by hydrogen-bond interactions for targeted imaging of cancer cells in different cell mixtures with a negligible fluorescence background. Zhang et al.28 embellished blue fluorescent CDs with folic acid through electrostatic interactions for effective targeted imaging of FR-positive HeLa and HepG-2 cancer cells. Recently, Kushwaha et al.29 demonstrated the dual targeting ability of a fluorescence nanoprobe using fluorescent CDs covalently conjugated with folic acid; these CDs displayed excellent MCF-7 breast cancer cell cytoplasm and nucleus targeting performance. To our knowledge, the quantum yields of current folate receptor-targeted fluorescent CDs are less than 10%. The development of targeted fluorescence CDs with facile preparation and good luminescence behaviour remains a challenge.
Herein, we first synthesized CDs from a natural product as a carbon source and successfully developed the fabrication of folate receptor-targeted green fluorescent CDs conjugated with folic acid on their surfaces for specific anchoring to the nucleus of MCF-7 cancer cells and the cytoplasm of HepG-2 cancer cells, respectively. The green fluorescent CDs with free –NH2 groups were first obtained by carbonization of the natural carbon source dandelion and the nitrogen source ethylenediamine (EDA) via a one-step hydrothermal process. The green fluorescent CDs exhibited a high fluorescent quantum yield of 13.9%, and their surfaces possessed active amino groups without requiring further functionalization for covalent conjugation with FA (FA-CDs) (Scheme 1). Notably, the FA-CDs show excellent stability, biocompatibility, and non-immunogenicity; thus, it is possible to efficiently differentiate FR-positive (FR+) HepG-2 cells from normal cells and distinctly indicate the expression level of FR on the cancer cytomembrane. The FA-CDs not only possess targeting ability for the cytoplasm and nucleus of cancer cells but also possess excellent photostability for fluorescence imaging. Furthermore, the FA-CDs may have great potential as an effective tool for cancer cell recognition, in addition to cancer detection, diagnosis, and individualized treatment.
 | ||
| Scheme 1 Schematic of (A) the synthesis of the carbon dots from dandelion and EDA, and (B) the covalent conjugation of folic acid to the green fluorescent carbon dots. | ||
2 Experimental
2.1 Materials and apparatus
1,2-Ethylenediamine (EDA) was obtained from Aldrich Reagents Company (Milwaukee, WI, U.S.A.). N-Hydroxysuccinimide (NHS), 1-(3-dimethylaminopropyl)-3-ethylcarbodiimide hydrochloride (EDC), folic acid, Na2HPO4, NaH2PO4, KCl, H3PO4, NaOH and NaCl were obtained from Aladdin Reagents Company (China, Shanghai). Dulbecco's modified Eagle's medium (DMEM) was purchased from Thermo Fisher Biological and Chemical Products (Beijing, China). Dimethyl sulfoxide (DMSO) and fetal bovine serum (FBS) were purchased from Hangzhou Sijiqing Biological Engineering Materials Co., Ltd (China). Trypsin was purchased from Sino-American Biotechnology Company. 3-(4,5-Dimethylthiazol-2-yl)-2,5-diphenyltetrazolium bromide (MTT) was obtained from Solarbio (Beijing, China). PC-12, HepG-2 and MCF-7 cells were provided by the Gene Engineering Center of Shanxi University. All the chemicals used were of analytical reagent grade or above without further purification, and double-distilled water (≥18.2 MΩ cm@25 °C) from a Millipore Milli-Q system was used throughout. Dandelion (leaf), as shown in Scheme 1, was used as the reaction precursor.Transmission electron microscopy (TEM) was performed using a JEM-2100 instrument (JEOL Ltd., Japan) at an accelerating voltage of 200 kV. The UV-vis and photoluminescence spectra were acquired on a UV-3010 spectrophotometer (Hitachi, Japan) and an F-4500 fluorescence spectrophotometer (Hitachi, Japan), respectively. The elemental analysis was carried out on an Elementar Analysensysteme vario EL cube elemental analyzer (Hanau, Germany). Analyses were performed in triplicate, and the average values were obtained. Fourier transform infrared spectra (FTIR) were recorded on a Bruker Tensor II FTIR spectrometer (Bremen, Germany). The X-ray photoelectron spectra (XPS) were acquired on an AXIS ULTRA DLD X-ray photoelectron spectrometer (Kratos, Tokyo, Japan) with Al Kα radiation operating at 1486.6 eV. The spectra were processed with Case XPS v.2.3.12 software using a peak-fitting routine with symmetrical Gaussian–Lorentzian functions. The zeta potential was recorded on a Zetasizer Nano ZS90 (Malvern, Worcestershire, U.K.). Fluorescence images were acquired on a ZEISS LSM 880 confocal laser scanning microscope (CLSM). A FE20 pH meter (Mettler Toledo, Switzerland) was used to adjust pH values. Fluorescence quantum yield (F) was determined using Rhodamine 6G (QY = 95% in ethanol in the emission range of 480 to 560 nm) as a standard.
2.2 Synthesis of green fluorescent CDs
The green fluorescent CDs were synthesized by one-pot hydrothermal protocol carbonization using the natural carbon source dandelion and the nitrogen source EDA. Firstly, 2.5 g of dandelion leaf, 1 mL EDA and 10 mL ultra-pure water were placed in a stainless steel autoclave with a PTFE liner (25 mL) and then heated at 200 °C for 6 h. After the reaction, the vessel was cooled naturally to obtain a red-brown solution containing dandelion leaf, which demonstrated the generation of water-soluble CDs. After separation of the dandelion leaf, large particles or precipitates in the solution were removed through filtering and centrifugation (10![[thin space (1/6-em)]](https://www.rsc.org/images/entities/char_2009.gif) 000 rpm, 10 min, 4 °C). The aqueous solution of CDs was further purified through a dialysis membrane (MWCO 1000 Da) for 24 h in ultra-pure water. Finally, the resulting aqueous solution was collected and freeze-dried to obtain the CDs in powder form, which were then stored at 4 °C.
000 rpm, 10 min, 4 °C). The aqueous solution of CDs was further purified through a dialysis membrane (MWCO 1000 Da) for 24 h in ultra-pure water. Finally, the resulting aqueous solution was collected and freeze-dried to obtain the CDs in powder form, which were then stored at 4 °C.
2.3 Fabrication of folate receptor-targeted FA-CDs
The FA-CDs were fabricated by covalent conjugation of the free amino groups on the CDs with the carboxylic groups of FA.30 To assemble the FA and CDs, firstly, free FA (20 mg) was sufficiently dissolved in 8 mL 50 mM PBS buffer (pH 7.4) to develop a clear yellow solution. Next, 4 mL aqueous solution of EDC (0.0260 g) and NHS (0.0156 g) was added to the solution of FA. The mixture was treated by agitation at room temperature overnight and then mixed with 2 mL CDs (22 mg mL−1). The reaction was maintained under the same conditions for 24 h; then, the solution was dialysed (MWCO 1000 Da) against distilled water for 1 day to remove excess FA or salt. The final product of FA-CDs powder was collected by lyophilization.2.4 Stability of CDs and FA-CDs
The CDs or FA-CDs were added to PBS buffer with different pH values to obtain solutions with different pH values. Then, the effects of common cations on the fluorescence of the FA-CDs were determined by testing NaCl (50 mM), KCl (50 mM), MgCl2 (2.5 mM), and CaCl2 (0.5 mM). For cell imaging, the effects of common cellular substances, including ascorbic acid (10 mM), glucose (10 mM), urea (10 mM), reduced glutathione (1 mM), cysteine (1 mM), glycine (1 mM), alanine (1 mM), vitamin B1 (1 mM), human serum albumin (100 nM) and bovine serum albumin (100 nM), on the fluorescence stabilities of the CDs and FA-CDs were respectively investigated.2.5 Cell viability assay
The cell viabilities of CDs and FA-CDs for HepG-2 cells were evaluated by a standard MTT assay. Briefly, HepG-2 cells were first plated on a Costar® 96-well cell culture cluster and cultured at 37 °C with 5.0% CO2 in air for 3 h to adhere the cells onto the surface. The wells without cells and treatment with FA-CDs were taken as controls. The medium was then exchanged with 200 μL of fresh DMEM supplemented with 10% FBS containing FA-CDs with varied concentrations (0 to 1000 μg mL−1) at 37 °C for 24 h. At least six parallel samples were created in each group. Cells not treated with FA-CDs were taken as controls. After adding 20 μL of the 5.0 mg mL−1 MTT reagent to every well, the cells were further incubated for 4 h. The supernatant was discarded, and 150 μL of DMSO was added to each well to dissolve the formed formazan. The resulting mixture was shaken for ca. 10 min at room temperature. The optical density (OD) of the mixture was measured at 490 nm using a SunRise microplate reader (Tecan Austria GmbH, Grödig, Austria). The cell viability was estimated as:| Cell viability (%) = (ODTreated/ODControl) × 100% |
2.6 Cell targeting imaging
The cellular imaging of the FA-CDs was performed using confocal laser scanning microscopy (CLSM). First, HepG-2, MCF-7 and PC-12 cells were seeded into a 35 mm dish with a 20 mm glass bottom for confocal imaging at a density of 1 × 10⁵ cells per dish in 1.0 mL of DMEM with 10% serum. For fluorescence imaging and to determine the expression level of folate receptors for different cells, HepG-2, MCF-7 and PC-12 cells were first incubated for 20 h in 1.0 mL of DMEM with 10% serum; the medium was then removed and substituted with 1.0 mL fresh DMEM with 10% serum medium containing FA-CDs (1.0 mg mL−1). After incubation at 37 °C for 4 h, the cells were washed thrice with ice-cold PBS (pH 7.4). To demonstrate the folate receptor-mediated uptake, contrast experiments were implemented where the cells were incubated with only excess FA (1 mg mL−1) for 4 h. Meanwhile, the other cell cultures were pre-treated with excess FA (1 mg mL−1) for 1 h before FA-CDs treatment. For fluorescence targeted imaging, cell mixtures of MCF-7 cells with PC-12 and HepG-2 cells, respectively, were each incubated with near-equal concentrations of about 105 cells per mL. After co-culturing for 12 h, the cell mixture was then incubated with FA-CDs (1 mg mL−1) for 4 h at 37 °C, respectively. Finally, the cells were observed and the fluorescent images were recorded with a LSM880 instrument.2.7 Quantum yield (QY) measurements
Rhodamine 6G (QY = 95% in ethanol in the emission range of 480 to 560 nm) was used as the standard.31 The QYs of the CDs (in water) were determined by plotting the integrated photoluminescence (PL) intensity against the absorbance value (less than 0.10 at the excitation wavelength) using the equation φ = φst × (Ast/Ist)(I/A)(n/nst)2, where φ and the subscript “st” are the QYs of the testing sample and the referenced standard, respectively, I is the integrated emission intensity of the testing sample, n is the refractive index (1.33 for water and 1.36 for ethanol), and A is the absorbance value.3 Results and discussion
3.1 Characterization of green fluorescent CDs
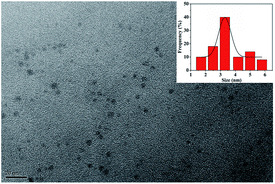
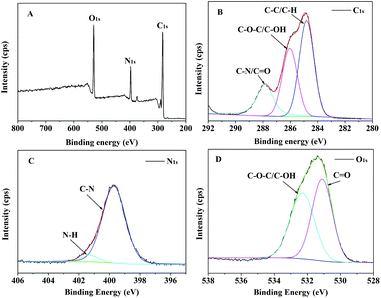
The fluorescent CDs were obtained by one-step hydrothermal treatment of the natural carbon source dandelion and the nitrogen source EDA, and their surfaces contained effective amino groups due to the EDA (Scheme 1A). The size and morphology of the CDs were determined by transmission electron microscopy (TEM) (Fig. 1). TEM observation clearly confirmed that the CDs were successfully obtained; they displayed a spherical morphology, good dispersity without apparent aggregation, and an average size of 3.5 nm.Furthermore, to research the elements, chemical bonds, and surface groups of the as-synthesized CDs, elemental analysis, X-ray photoelectron spectroscopy (XPS) (Fig. 2) and Fourier transform infrared (FTIR) spectroscopy (Fig. 3) were carried out. The elemental analysis showed that the as-synthesized CDs were mainly constituted of C 37.44, H 7.67, N 15.91 wt%, and O (calculated) 38.98 wt%. The XPS survey spectrum (Fig. 2A) manifested the existence of C, N, and O in the CDs,32 corresponding to the elemental analysis. The high-resolution C 1s XPS spectrum of CDs is presented in Fig. 2B. The typical peaks at 284.6, 285.3 and 287.8 eV were attributed to C–C/C![[double bond, length as m-dash]](https://www.rsc.org/images/entities/char_e001.gif) C, C–OH/C–O–C and C
C, C–OH/C–O–C and C![[double bond, length as m-dash]](https://www.rsc.org/images/entities/char_e001.gif) O bonds, respectively.31,33,34 Fig. 2C and 3D display the high resolution XPS spectra of N 1s and O 1s; these confirm that C–N, N–H, C–O–C/C–OH, and C
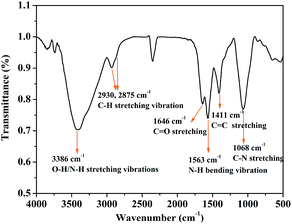
O bonds, respectively.31,33,34 Fig. 2C and 3D display the high resolution XPS spectra of N 1s and O 1s; these confirm that C–N, N–H, C–O–C/C–OH, and C![[double bond, length as m-dash]](https://www.rsc.org/images/entities/char_e001.gif) O bonds are present in the CDs, which suggests the presence of –OH, –COOH and –NH2 groups on the surface of the CDs.33,34 FTIR spectroscopy was used to identify the functional groups on the surface of the CDs. As shown in Fig. 3, the characteristic absorption peaks of the CDs appeared at approximately 3386 cm−1 (O–H and N–H stretching vibrations),35 2930 and 2875 cm−1 (C–H stretching vibration), 1646 cm−1 (C
O bonds are present in the CDs, which suggests the presence of –OH, –COOH and –NH2 groups on the surface of the CDs.33,34 FTIR spectroscopy was used to identify the functional groups on the surface of the CDs. As shown in Fig. 3, the characteristic absorption peaks of the CDs appeared at approximately 3386 cm−1 (O–H and N–H stretching vibrations),35 2930 and 2875 cm−1 (C–H stretching vibration), 1646 cm−1 (C![[double bond, length as m-dash]](https://www.rsc.org/images/entities/char_e001.gif) O stretching vibration), 1563 cm−1 (N–H bending vibration), 1068 cm−1 (C–N stretching vibration),36 and 1411 cm−1 (C
O stretching vibration), 1563 cm−1 (N–H bending vibration), 1068 cm−1 (C–N stretching vibration),36 and 1411 cm−1 (C![[double bond, length as m-dash]](https://www.rsc.org/images/entities/char_e001.gif) C stretching vibration). The presence of –NH2 and C–N further indicates that abundant –NH2 groups remained on the surface of the CDs even after hydrothermal carbonization. The analytical results of XPS and FTIR indicate that the as-synthesized CDs possess effective –NH2 groups without requiring further chemical modification.
C stretching vibration). The presence of –NH2 and C–N further indicates that abundant –NH2 groups remained on the surface of the CDs even after hydrothermal carbonization. The analytical results of XPS and FTIR indicate that the as-synthesized CDs possess effective –NH2 groups without requiring further chemical modification.
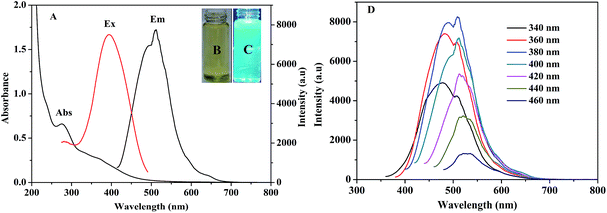
The UV-vis and fluorescence spectra of the CDs were investigated. The UV-vis spectrum depicts a maximum absorption peak at 276 nm, which was attributed to the n–π* transition of C![[double bond, length as m-dash]](https://www.rsc.org/images/entities/char_e001.gif) O and the π–π* transition of C
O and the π–π* transition of C![[double bond, length as m-dash]](https://www.rsc.org/images/entities/char_e001.gif) C (Fig. 4A).37 As shown in Fig. 4A and C, strong green photoluminescence in water can be observed for the CDs, with an optimal emission peak at 512 nm. The full width at half-maximum is 96 nm,38,39 suggesting a relatively small size distribution of the CDs; this is consistent with the TEM data. The insets in Fig. 4B and C display photographs of the CDs obtained under visible and UV light (365 nm), respectively. To further investigate their optical properties, the fluorescence spectra of the CDs were recorded at gradually increasing excitation wavelengths in 20 nm increments (Fig. 4D). A gradual red shift, altered fluorescence intensity with increasing excitation wavelength, and two emission peaks (less than 400 nm) can be observed; this can be explained by the “edge red-shift effect” and a dependence on the excitation wavelength. In addition, the fluorescent CDs gave two peak emissions (i.e., 480 nm and 512 nm) when excited at wavelengths lower than 380 nm. At these low excitation wavelengths, the energy was strong enough to excite two types of chromophores for emission. Meanwhile, at high excitation wavelengths (400 to 460 nm), the energy decreased and was no longer able to excite the chromophores with 360 nm maximum excitation, resulting in a single-peak emission at 512 nm (green fluorescence).40 For reference, the quantum yield (QY) of the as-synthesized CDs using Rhodamine 6G was measured to be 13.9%.31
C (Fig. 4A).37 As shown in Fig. 4A and C, strong green photoluminescence in water can be observed for the CDs, with an optimal emission peak at 512 nm. The full width at half-maximum is 96 nm,38,39 suggesting a relatively small size distribution of the CDs; this is consistent with the TEM data. The insets in Fig. 4B and C display photographs of the CDs obtained under visible and UV light (365 nm), respectively. To further investigate their optical properties, the fluorescence spectra of the CDs were recorded at gradually increasing excitation wavelengths in 20 nm increments (Fig. 4D). A gradual red shift, altered fluorescence intensity with increasing excitation wavelength, and two emission peaks (less than 400 nm) can be observed; this can be explained by the “edge red-shift effect” and a dependence on the excitation wavelength. In addition, the fluorescent CDs gave two peak emissions (i.e., 480 nm and 512 nm) when excited at wavelengths lower than 380 nm. At these low excitation wavelengths, the energy was strong enough to excite two types of chromophores for emission. Meanwhile, at high excitation wavelengths (400 to 460 nm), the energy decreased and was no longer able to excite the chromophores with 360 nm maximum excitation, resulting in a single-peak emission at 512 nm (green fluorescence).40 For reference, the quantum yield (QY) of the as-synthesized CDs using Rhodamine 6G was measured to be 13.9%.31
3.2 Conjugating folic acid to CDs
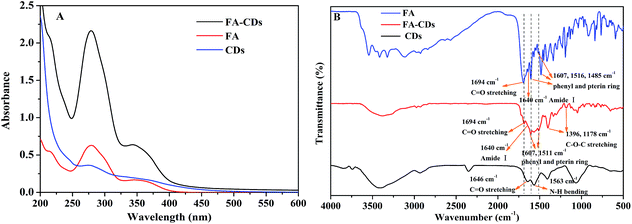
The amino groups on the CDs were covalently conjugated with the carboxyl groups of FA through a classical cross-linking reaction (Scheme 1B).30 As shown in Fig. 5A, the resulting FA-CDs exhibited characteristic absorption peaks of FA at 283 nm and 346 nm,41 indicating the successful functionalization of FA onto the surface of the CDs. The folic acid in FA-CDs was quantified by the contrast method by measuring its characteristic absorption at 283 nm. We determined that the amount of folic acid conjugated onto the CDs was approximately 464 μg mg−1. In addition, the successful functionalization of FA onto the surface of the CDs was supported by the FTIR spectra (Fig. 5B) and the TEM (Fig. 6A) and zeta potential measurements (Fig. 6B).42–44 The FTIR spectra of pure folic acid revealed the characteristic absorption peak at 1694 cm−1, which corresponds to C![[double bond, length as m-dash]](https://www.rsc.org/images/entities/char_e001.gif) O stretching from –COOH, 1640 cm−1, indicating C
O stretching from –COOH, 1640 cm−1, indicating C![[double bond, length as m-dash]](https://www.rsc.org/images/entities/char_e001.gif) O stretching from –CONH2, and 1607, 1516, 1485 cm−1, which correspond to the phenyl and pterin rings.41 The FA-CDs showed not only the characteristic peaks of the CDs themselves but also peaks at 1694 cm−1 (C
O stretching from –CONH2, and 1607, 1516, 1485 cm−1, which correspond to the phenyl and pterin rings.41 The FA-CDs showed not only the characteristic peaks of the CDs themselves but also peaks at 1694 cm−1 (C![[double bond, length as m-dash]](https://www.rsc.org/images/entities/char_e001.gif) O), 1606 and 1511 cm−1 (phenyl and pterin rings) indicative of FA, supporting the successful conjugation of FA to the CDs.45,46 Moreover, the N–H bending vibration peak disappeared from the FTIR spectrum of the CDs. Importantly, the characteristic absorption peak at 1607 cm−1 of the phenyl skeleton in the FA-CDs FTIR spectrum had a wider peak width, which is due to the coupling reaction of amide I. In the FTIR spectrum of the FA-CDs, bands were also observed at 1396 cm−1 and 1178 cm−1 (C–O–C stretching); these may be due to the formation of acid anhydride bonds between FA and the CDs. These results show that the folic acid molecules were successfully bonded to the surface of the CDs. Furthermore, the conjugated FA-CDs were mostly between 5 and 8 nm in diameter, while the CDs were between 2 and 5 nm. Meanwhile, the zeta potentials of the CDs and FA-CDs were determined to be −22.4 ± 0.90 and −15.0 ± 0.30 mV (pH 7.4), respectively, suggesting the loss of the carboxylic acid groups upon surface passivation.42 This indicates that successful conjugation of FA was achieved on the CDs. To further confirm that the product FA-CDs was not a mechanical mixture, the excess FA was removed by dialysis until the outside solution of the dialysis membrane did not give any characteristic signal of FA.
O), 1606 and 1511 cm−1 (phenyl and pterin rings) indicative of FA, supporting the successful conjugation of FA to the CDs.45,46 Moreover, the N–H bending vibration peak disappeared from the FTIR spectrum of the CDs. Importantly, the characteristic absorption peak at 1607 cm−1 of the phenyl skeleton in the FA-CDs FTIR spectrum had a wider peak width, which is due to the coupling reaction of amide I. In the FTIR spectrum of the FA-CDs, bands were also observed at 1396 cm−1 and 1178 cm−1 (C–O–C stretching); these may be due to the formation of acid anhydride bonds between FA and the CDs. These results show that the folic acid molecules were successfully bonded to the surface of the CDs. Furthermore, the conjugated FA-CDs were mostly between 5 and 8 nm in diameter, while the CDs were between 2 and 5 nm. Meanwhile, the zeta potentials of the CDs and FA-CDs were determined to be −22.4 ± 0.90 and −15.0 ± 0.30 mV (pH 7.4), respectively, suggesting the loss of the carboxylic acid groups upon surface passivation.42 This indicates that successful conjugation of FA was achieved on the CDs. To further confirm that the product FA-CDs was not a mechanical mixture, the excess FA was removed by dialysis until the outside solution of the dialysis membrane did not give any characteristic signal of FA.
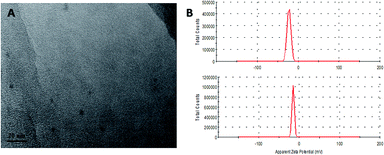 | ||
| Fig. 6 (A) TEM image of the FA-CDs. (B) Zeta potential distributions of the CDs (top) and FA-CDs (down). | ||
3.3 Photostabilities of CDs and FA-CDs
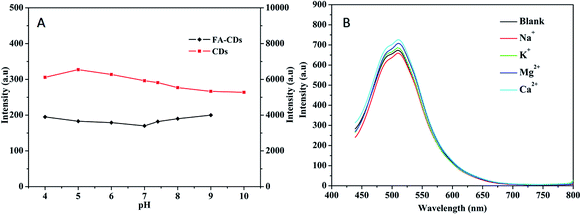
It is well known that photoluminescence (PL) stability is important for the application of fluorescent carbon nanomaterials.47 After 6 months of storage at 4 °C, the fluorescence intensity of the carbon dots remained at 99%, revealing the excellent dispersibility and strong PL of the CDs (Fig. S1, ESI†). Moreover, the CDs show exceptional photostability, and the PL intensity remained almost constant under continuous irradiation at 360 nm with a Xe lamp for 60 min (Fig. S2, ESI†). The fluorescence stability is comparable to or even better than that of most available reported carbon dots (Table S2, ESI†); thus, our carbon dots are a good option for use in bioimaging applications. Meanwhile, under the same experimental conditions, the fluorescent CDs conjugated with folic acid also exert excellent photostability, even better than that of the fluorescent CDs. The effects of pH and common cellular cations on the PL stability of the CDs and FA-CDs were further examined. As shown in Fig. 7A, deprotonation of amino groups occurred on the surface of the CDs with increasing pH, and a “protective shell” with negative charge was formed gradually on the surface of CDs with lower non-radiative recombination rates.48 This gave rise to an increase in the PL intensity of the CDs. However, when the pH was greater than 5.0, deprotonation of amino groups on the surface of the CDs occurred, and a uniform “protective shell” was formed. The observed PL intensity remained almost constant. For the folic acid-conjugated fluorescent CDs, the effect of pH on the PL intensity was basically constant in the pH range from 4.0 to 9.0. As shown in Fig. 7B, common cations (Na+, K+, Ca2+, Mg2+) did not give rise to radical changes in the PL intensity of the FA-CDs; the error was less than 10%. In addition, the effects of common cellular substances on the fluorescence CDs and FA-CDs were investigated; these substances exhibited no considerable interference (error < 10%) (Fig. S3, ESI†). These results revealed that not only the fluorescent CDs but also the FA-CDs are quite stable; thus, they are promising for biological applications.263.4 Uptake of FA-CDs into HepG-2 cells by folate receptor mediation
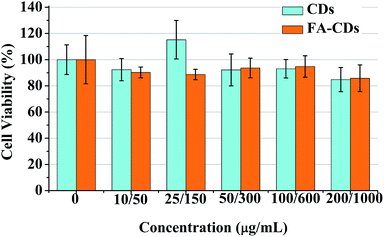
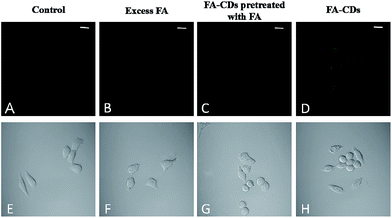
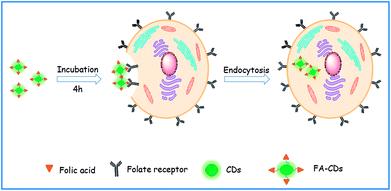
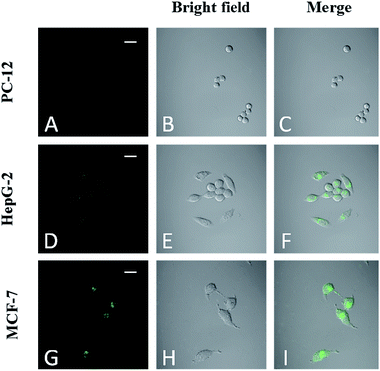
The fluorescent FA-CDs were investigated for imaging FR+ HepG-2 cancer cells27,49 by confocal laser scanning microscopy (CLSM). The background fluorescence and auto-fluorescence from the HepG-2 cells did not affect the cell imaging (Fig. 9A and B) at an excitation wavelength of 405 nm, and the cells incubated with FA-CDs (1000 μg mL−1, 4 h, 37 °C) displayed bright green fluorescence emission (Fig. 9D). Meanwhile, the cells did not show bright fluorescence on the nucleus; however, they did show bright fluorescence on the membrane and in the cytoplasm (Fig. 9D). In addition, irregular fluorescence bright spots were observed in the cytoplasm due to irregular distribution of FR, FA-CDs or both in cells. These results indicated that FR is mainly present in the cancer cell membrane and can effectively deliver the CDs functionalized with the ligand FA into the cells via receptor-mediated endocytosis.14 More importantly, the standard MTT assay showed that the cell viability was above 80% after 24 h incubation with the CDs and was above 85% after 24 h incubation with the FA-CDs even at the highest concentrations (1000 μg mL−1) (Fig. 8), demonstrating that the FA-CDs have low cytotoxicity and good biocompatibility.As shown in Scheme 2, the uptake of FA-CDs into the cancer cells by receptor-mediated endocytosis shows green fluorescence, which may be ascribed to specific binding of the FA-CDs to the folate receptors of the cancer cells. To better understand the specific adsorption of folic acid-conjugated carbon dots on the cell surface, we performed competition experiments to compare the fluorescence imaging behavior of FA-CDs incubated with cells. On the one hand, we compared to the fluorescence imaging behavior of FA-CDs incubated with and without pre-treated cancer cells using free FA. Some HepG-2 cells were incubated with FA-CDs for 4 h at 37 °C, while other HepG-2 cells were pre-treated with free FA (1 mg mL−1) for 1 h and then incubated with FA-CDs under identical conditions. It was observed that the untreated cells displayed bright green fluorescence (Fig. 9C) compared to the pre-treated cells (Fig. 9D) throughout the cytomembrane, which is closely located around the cytoplasm. This observation indicates that the FA-CDs have effectively enhanced accumulation in cancer cells, which may be attributed to the specific binding between FA and the folate receptors on the surface of the cancer cells. On the other hand, a comparison of the fluorescence imaging behavior of the FA-CDs incubated with a non-cancerous cell line (PC-12 cells) and cancer cells (HepG-2 cells) was also carried out to further understand the specific adsorption of folic acid-conjugated carbon dots on the cell surfaces (Fig. 10). It was found that the PC-12 cells (Fig. 10A) did not express FR and displayed very weak fluorescence compared to HepG-2 cells (Fig. 10D) incubated with FA-CDs. The weak fluorescence is likely related to non-specific binding of FA to the folate receptors of the extracellular surface of the non-cancerous cells because FR expression mainly occurs in cancer cell membranes. On the basis of the above results, the uptake of FA-CDs in cancer cells appears to be due to specific binding to folate receptors on the surface of the cells.
3.5 Cell targeting imaging performance of FA-CDs
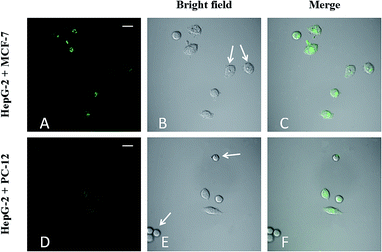
To understand the effects of FA on targeting ability, FA-CDs (1 mg mL−1) were incubated with PC-12, HepG-2, and MCF-7 cells29 for 4 h, respectively, followed by fluorescence microscopy imaging (Fig. 10). The results showed that MCF-7 cells (Fig. 10G) exhibited much stronger fluorescence than HepG-2 cells (Fig. 10D) and simultaneously displayed green fluorescence on the nucleus, while PC-12 cells (Fig. 10A) showed very little fluorescence. This implies that the observed fluorescence in MCF-7 and HepG-2 cells was indeed generated by the FA-CDs, further supporting the receptor-mediated endocytosis of the FA-CDs. These results also indicate that the FA-CDs may serve as a potential tool for characterizing the different FR-expressing abilities of various types of cancer cells.The feasibility of FA-CDs to distinguish FR-positive cancer cells in a cell mixture with normal cells was evaluated by co-culturing model cell mixtures of MCF-7 respectively with HepG-2 and PC-12 cells.26 First, the model cell mixtures were prepared by co-culturing MCF-7 cells respectively with HepG-2 and PC-12 cells in identical culture dishes for 12 h. Then, the cell mixtures were incubated with FA-CDs for 4 h and subjected to fluorescence imaging analysis. As shown in Fig. 11, the MCF-7 cells generated brighter green fluorescence than the HepG-2 cells, while the PC-12 cells displayed almost no fluorescent signal. The difference in fluorescent signals was obviously consistent with the fact that MCF-7 cells overexpress FR (FR++) and HepG-2 cells highly express FR (FR+) while PC-12 cells lack FR (FR−), therefore demonstrating the capacity of the FA-CDs to identify FR-positive cancer cells in cell mixtures with normal cells. These results confirm that the designed FA-CDs system is applicable to the simple differentiation of FR++ cancerous cells from FR+ cancerous cells and from FR− normal cells.
3.6 Comparison of the performance of folate receptor-targeted fluorescent CDs
We further compared the as-prepared folic acid conjugated-fluorescent CDs with those currently reported (Table S1, ESI†). Among these folic acid conjugated-fluorescent CD systems, the fluorescent CDs had complex preparation methods, poor luminescence behaviour, or both. Obviously, the QYs of the reported folate receptor-targeted fluorescent CDs are less than 10%. In our work, the as-prepared green fluorescent CDs were prepared by a one-pot method using the natural product dandelion as the carbon source. Good luminescence behaviour and high QYs were demonstrated compared to the reported systems. In addition, the constructed FA-CDs exhibited excellent targeting imaging performance for simple differentiation of FR++ cancerous cells from FR+ cancerous cells and from FR− normal cells. Overall, the performance of the prepared CDs-based assay is comparable to or even better than those reported in the literature.4 Conclusions
In summary, folate receptor-targeted green fluorescent CDs were prepared via covalent conjugation of folic acid on the surface of CDs for specific anchoring to the nucleus of MCF-7 cancer cells and the cytoplasm of HepG-2 cancer cells, respectively. The receptor-mediated endocytosis, expression level of FR, and target recognition of cancer cells of the fluorescent FA-CDs were clearly demonstrated by contrast and comparative experiments with MCF-7, HepG-2, and PC-12 cells involving confocal laser scanning microscopy imaging. The highlights of this system are the use of the natural product dandelion as the carbon source, the facile synthesis of green fluorescent CDs with high quantum yield (13.9%), and the covalent conjugation of FA-CDs for differentiating cancer cells from normal cells. Moreover, the FA-CDs demonstrate not only targeting of cancer cells in the cytoplasm and nucleus but also excellent photostability for fluorescence imaging; this may provide an effective tool for cancer detection and prognosis as well as individualized treatment.Conflicts of interest
There are no conflicts to declare.Acknowledgements
This work was supported by the National Natural Science Foundation of China (21475080 and 21575084) and the Hundred Talent Programme of Shanxi Province.Notes and references
- L. Cao, M. J. Meziani, S. Sahu and Y. P. Sun, Acc. Chem. Res., 2013, 46, 171–180 CrossRef CAS PubMed.
- M. Z. Zhang, R. N. Yu, J. Chen, Z. Y. Ma and Y. D. Zhao, Nanotechnology, 2012, 23, 831–842 Search PubMed.
- X. Chen, M. Sun and H. Ma, Curr. Org. Chem., 2006, 10, 477–489 CrossRef CAS.
- D. Feng, Y. Song, W. Shi, X. Li and H. Ma, Anal. Chem., 2013, 85, 6530–6535 CrossRef CAS PubMed.
- R. Weissleder and M. J. Pittet, Nature, 2008, 452, 580–589 CrossRef CAS PubMed.
- A. N. Bhatt, R. Mathur, A. Farooque, A. Verma and B. S. Dwarakanath, Indian J. Med. Res., 2010, 132, 129–149 CAS.
- S. Li, D. Amat, Z. Peng, S. Vanni, S. Raskin, G. De Angulo, A. M. Othman, R. M. Graham and R. M. Leblanc, Nanoscale, 2016, 8, 16662–16669 RSC.
- F. Tang, C. Wang, X. Wang and L. Li, ACS Appl. Mater. Interfaces, 2015, 7, 25077–25083 CAS.
- J. Qiu, R. Zhang, J. Li, Y. Sang, W. Tang, P. Rivera Gil and H. Liu, Int. J. Nanomed., 2015, 10, 6709–6724 CAS.
- B. A. Kamen and A. K. Smith, Adv. Drug Delivery Rev., 2004, 56, 1085–1097 CrossRef CAS PubMed.
- N. Parker, M. J. Turk, E. Westrick, J. D. Lewis, P. S. Low and C. P. Leamon, Anal. Biochem., 2005, 338, 284–293 CrossRef CAS PubMed.
- J. Sudimack and R. J. Lee, Adv. Drug Delivery Rev., 2000, 41, 147–162 CrossRef CAS PubMed.
- L. E. Kelemen, Int. J. Cancer, 2006, 119, 243–250 CrossRef CAS PubMed.
- C. P. Leamon and P. S. Low, Drug Discovery Today, 2001, 6, 44–51 CrossRef CAS PubMed.
- D. J. Bharali, D. W. Lucey, H. Jayakumar, H. E. Pudavar and P. N. Prasad, J. Am. Chem. Soc., 2005, 127, 11364–11371 CrossRef CAS PubMed.
- N. C. Fan, F. Y. Cheng, J. a. A. Ho and C. S. Yeh, Angew. Chem., Int. Ed., 2012, 51, 8806–8810 CrossRef PubMed.
- Z. Sun, S. Li, Y. Jiang, Y. Qiao, L. Zhang, L. Xu, J. Liu, W. Qi and H. Wang, Sci. Rep., 2016, 6, 20553 CrossRef CAS PubMed.
- M. L. Chen, Y. J. He, X. W. Chen and J. H. Wang, Langmuir, 2012, 28, 16469–16476 CrossRef CAS PubMed.
- Y. Zhao, S. Liu, Y. Li, W. Jiang, Y. Chang, S. Pan, X. Fang, Y. A. Wang and J. Wang, J. Colloid Interface Sci., 2010, 350, 44–50 CrossRef CAS PubMed.
- S. Li, Z. Sun, R. Li, M. Dong, L. Zhang, W. Qi, X. Zhang and H. Wang, Sci. Rep., 2015, 5, 8475 CrossRef CAS PubMed.
- A. Verma and F. Stellacci, Small, 2010, 6, 12–21 CrossRef CAS PubMed.
- A. Cayuela, C. Carrillo-Carrión, M. L. Soriano, W. J. Parak and M. Valcárcel, Anal. Chem., 2016, 88, 3178–3185 CrossRef CAS PubMed.
- S. Zhu, L. He, F. Zhang, M. Li, S. Jiao, Y. Li, M. Chen, X. E. Zhao and H. Wang, Talanta, 2016, 161, 769–774 CrossRef CAS PubMed.
- B. P. Qi, L. Bao, Z. L. Zhang and D. W. Pang, ACS Appl. Mater. Interfaces, 2016, 8, 28372–28382 CAS.
- S. K. Bhunia, A. Saha, A. R. Maity, S. C. Ray and N. R. Jana, Sci. Rep., 2013, 3, 1473 CrossRef PubMed.
- Y. Song, W. Shi, W. Chen, X. Li and H. Ma, J. Mater. Chem., 2012, 22, 12568–12573 RSC.
- Q. Liu, S. Xu, C. Niu, M. Li, D. He, Z. Lu, L. Ma, N. Na, F. Huang, H. Jiang and J. Ouyang, Biosens. Bioelectron., 2015, 64, 119–125 CrossRef CAS PubMed.
- D. Lei, W. Yang, Y. Gong, J. Jing, H. Nie, B. Yu and X. Zhang, Sens. Actuators, B, 2016, 230, 714–720 CrossRef CAS.
- S. Aiyer, R. Prasad, M. Kumar, K. Nirvikar, B. Jain and O. S. Kushwaha, Applied Materials Today, 2016, 4, 71–77 CrossRef.
- Y. Song, Y. Chen, L. Feng, J. Ren and X. Qu, Chem. Commun., 2011, 47, 4436–4438 RSC.
- K. Jiang, S. Sun, L. Zhang, Y. Lu, A. Wu, C. Cai and H. Lin, Angew. Chem., Int. Ed., 2015, 54, 5360–5363 CrossRef CAS PubMed.
- L. Wang and H. S. Zhou, Anal. Chem., 2014, 86, 8902–8905 CrossRef CAS PubMed.
- J. Feng, W. J. Wang, X. Hai, Y. L. Yu and J. H. Wang, J. Mater. Chem. B, 2016, 4, 387–393 RSC.
- X. Gong, Q. Zhang, Y. Gao, S. Shuang, M. M. F. Choi and C. Dong, ACS Appl. Mater. Interfaces, 2016, 8, 11288–11297 CAS.
- F. Arcudi, L. Đorđević and M. Prato, Angew. Chem., 2016, 128, 2147–2152 CrossRef.
- W. Wei, C. Xu, L. Wu, J. Wang, J. Ren and X. Qu, Sci. Rep., 2014, 4, 3564 CrossRef PubMed.
- H. Xu, X. Yang, G. Li, C. Zhao and X. Liao, J. Agric. Food Chem., 2015, 63, 6707–6714 CrossRef CAS PubMed.
- R. J. Fan, Q. Sun, L. Zhang, Y. Zhang and A. H. Lu, Carbon, 2014, 71, 87–93 CrossRef CAS.
- X. Wang, L. Cao, S. T. Yang, F. Lu, M. J. Meziani, L. Tian, K. W. Sun, M. A. Bloodgood and Y. P. Sun, Angew. Chem., 2010, 122, 5438–5442 CrossRef.
- W. Wang, Y. Li, L. Cheng, Z. Cao and W. Liu, J. Mater. Chem. B, 2014, 2, 46–48 RSC.
- I. P. J. Lai, S. G. Harroun, S. Y. Chen, B. Unnikrishnan, Y. J. Li and C. C. Huang, Sens. Actuators, B, 2016, 228, 465–470 CrossRef CAS.
- Y. Choi, S. Kim, M. H. Choi, S. R. Ryoo, J. Park, D. H. Min and B. S. Kim, Adv. Funct. Mater., 2014, 24, 5781–5789 CrossRef CAS.
- C. Wang, Z. Xu, H. Lin, Y. Huang and C. Zhang, Part. Part. Syst. Charact., 2015, 32, 944–951 CrossRef CAS.
- Y. F. Wu, H. C. Wu, C. H. Kuan, C. J. Lin, L. W. Wang, C. W. Chang and T. W. Wang, Sci. Rep., 2016, 6, 21170 CrossRef CAS PubMed.
- I. B. Bwatanglang, F. Mohammad, N. A. Yusof, J. Abdullah, M. Z. Hussein, N. B. Alitheen and N. Abu, Int. J. Nanomed., 2016, 11, 413–428 CAS.
- S. Sureshkumar, B. Jothimani, T. M. Sridhar, A. Santhosh and B. Venkatachalapathy, J. Fluoresc., 2017, 27, 21–29 CrossRef CAS PubMed.
- B. P. Qi, G. J. Zhang, Z. L. Zhang and D. W. Pang, in Carbon Nanoparticles and Nanostructures, ed. N. Yang, X. Jiang and D. W. Pang, Springer International Publishing, Cham, 2016, vol. 7, pp. 239–256, DOI:10.1007/978-3-319-28782-9.
- Q. Zhang, C. Zhang, Z. Li, J. Ge, C. Li, C. Dong and S. Shuang, RSC Adv., 2015, 5, 95054–95060 RSC.
- C. L. Huang, C. C. Huang, F. D. Mai, C. L. Yen, S. H. Tzing, H. T. Hsieh, Y. C. Ling and J. Y. Chang, J. Mater. Chem. B, 2015, 3, 651–664 RSC.
Footnote |
| † Electronic supplementary information (ESI) available: The photostability of CDs and FA-CDs when stored at 4 °C, respectively. Effect of time under illumination on the PL intensity of CDs and FA-CDs, and effects of common cellular substances on the fluorescence of CDs and FA-CDs, respectively. Comparison of the performance of folic acid conjugated-fluorescent CDs for recognizing cancer cells. Comparison with other kinds of carbon dots reported previously about stability and cell imaging (% represents PL variation value of CDs). See DOI: 10.1039/c7ra07002k |
| This journal is © The Royal Society of Chemistry 2017 |

