 Open Access Article
Creative Commons Attribution 3.0 Unported Licence
Excellent stability of thicker shell CdSe@ZnS/ZnS quantum dots†
Yan Fua,
Daekyoung Kimb,
Wei Jianga,
Wenping Yinc,
Tae Kyu Ahnc and
Heeyeop Chae *ab
*ab
aSchool of Chemical Engineering, Sungkyunkwan University (SKKU), Suwon, 16419, Republic of Korea. E-mail: hchae@skku.edu
bSungkyunk Advanced Institute of Nanotechnology (SAINT), Sungkyunkwan University (SKKU), Suwon, 16419, Republic of Korea
cDepartment of Energy Science, Sungkyunkwan University (SKKU), Suwon, 16419, Republic of Korea
First published on 22nd August 2017
Abstract
Significant progresses made in the performance of quantum dot (QD) light-emitting diodes have often been associated with basic changes in QD synthesis, particularly with respect to composition and structure. Here we show that the absolute photoluminescence (PL) quantum yield (QY) of QD can reach 88% with a full width of 21 nm at half-maximum (FWHM) when an optimal thickness is chosen for the outer shell of alloyed, graded core/shell QDs. Thicker shell QD-LEDs with a maximum current efficiency of 56.6 cd A−1, an external quantum efficiency of 14.8%, and a brightness of 62![[thin space (1/6-em)]](https://www.rsc.org/images/entities/char_2009.gif) 000 cd m−2 are demonstrated. Green emitting QDs of CdSe@ZnS/ZnS with this optimal thickness is also most resistant to photo-stimulated degradation by UV exposure. Only a 7% loss in PL intensity results even after more than 400 hours of exposure to harsh conditions of 85 °C and 85% relative humidity.
000 cd m−2 are demonstrated. Green emitting QDs of CdSe@ZnS/ZnS with this optimal thickness is also most resistant to photo-stimulated degradation by UV exposure. Only a 7% loss in PL intensity results even after more than 400 hours of exposure to harsh conditions of 85 °C and 85% relative humidity.
1. Introduction
Colloidal quantum dots (QDs) have emerged as a new generation luminescent material with size-dependent and thus tunable emission properties. They have shown great potential for applications in light emitting diodes (LEDs),1–4 solar cells,5,6 and biomarkers7–10 because of their unique optical properties such as high photoluminescence (PL) quantum yield and narrow emission profile (15–40 nm FWHM), and because of their excellent solution processability.11–19 To realize their potential, however, high quality quantum dots are needed that are stable.An important measure of quality of light-emitting QDs is PL quantum yield, which is the ratio of the number of photons emitted over the number of ultra-violet (UV) photons absorbed. This yield is typically reduced by non-radiative recombination paths originated from surface defects20 and Förster resonance energy transfer (FRET).21–23 Stable QDs do not lose their PL intensity when they go through purification, processing for device fabrication, and device operation, which exposes the QDs to high temperature, air, moisture, and chemicals.
An effective approach for better quality and stability has been to use an outer shell that coats the inner core/shell QD. An initial attempt24 was to utilize a double outer shell for inner CdSe/CdS core–shell QDs. With an optimal outer shell thickness, the QY was increased to 72% and the QDs were stable even after purification and UV exposure. Different double outer shells were also utilized to improve the luminescence efficiency.25 For the simpler single outer shell that coats the inner core/shell QD, significant improvements in device performance has been achieved by alloyed core20 and alloyed intermediate shell.22 With optimally graded, alloyed intermediate shell, an external quantum efficiency (EQE) exceeding 20% and a current efficiency higher than 80 cd A−1 have been achieved.26,27
The big strides made in the performance are the results of optimization with respect to the structure and composition of QDs, which indicates that QDs are at the core for the device performance even though there are many other materials needed for fabrication of LEDs. In this work, we simply focus on QDs to enhance the optical and physical properties of QDs. In particular, we explore the beneficial effects that can be achieved by optimizing with respect to the outer shell thickness.
2. Experimental
2.1 Syntheses of green CdSe@ZnS alloyed core/shell QDs (A-QDs) and CdSe@ZnS/ZnS (alloyed core/shell)/thick shell QDs (AS-QDs)
Green CdSe@ZnS alloyed core/shell QDs, or A-QDs, with a chemical composition gradient were synthesized by modifying the method described elsewhere.4,22,28 For the synthesis, cadmium acetate (Cd(acet)2, 99.9%), zinc oxide (ZnO, 99.99%), Zn acetate dihydrate (Zn(CH3COO)2·2H2O), selenium (Se, 99.9%), sulfur (S, 99.9%), oleic acid (OA, 90%), 1-octadecene (ODE, 90%), trioctylphosphine (TOP, 90%) and hexane (HPLC grade, 97.0%) were purchased from Sigma-Aldrich. Acetone (99.5%) and anhydrous ethanol (99.5%) were obtained from Daejung Chemicals and Metals Co., Ltd. All the chemicals were used as received without further purification. Typically, a mixture of 0.14 mmol of Cd(acet)2 powder, 3.14 mmol of ZnO powder, and 7 mL of OA was stirred by a magnetic bar in a 50 mL three-neck flask under a flow of nitrogen gas, heated to 150 °C, and degassed for 30 min. Following the addition of ODE (15 mL), the temperature was raised to 310 °C. At this temperature, a stock solution of Se (1.5 mmol) and S (2.5 mmol) in TOP (3 mL) was swiftly added into the reaction mixture. The reaction temperature was kept at 310 °C for 10 min to form the quarternary CdSe@ZnS alloyed core/shell QDs. The heating mantle was then removed and cooled to room temperature in water bath and diluted with hexane and excess anhydrous ethanol to remove excess ligands and precursors by centrifugation. For fabrication of CdSe@ZnS/ZnS (alloyed core/shell)/thick shell QDs, or AS-QDs, S-ODE (1.6 mmol in 2.4 mL) stock solution was injected continuously at 310 °C for 12 min to the above reaction solution without centrifugation, after 10 min of reaction. Zn acetate dihydrate (2 mmol or 3 mmol or 4 mmol) was dissolved in OA + ODE mixed solution to form a clear stock solution. After injecting the solution, the reaction temperature was lowered to 270 °C. Then, S-TOP solution (6 mmol or 9 mmol or 12 mmol) was added dropwise for 10 min. The reactor temperature was maintained at the injection temperature for 20 min. The amount of Zn and S was varied to obtain different outer ZnS-shell thickness. The centrifugation procedure of the reaction mixture was the same as for A-QDs. Finally, the precipitate was dispersed in hexane for analyses such as UV-vis, PL, TEM, and TRPL measurements, and QD film formation.2.2 Device fabrication
The quantum-dot light-emitting diodes (QLEDs) were fabricated on ITO glass substrate cleaned using acetone and methyl alcohol under ultrasonication over 10 min. ZnO NPs were spin-coated at 1500 rpm for 30 s onto the ITO glass substrate and baked at 160 °C for 20 min as the electron transport layer (ETL). The QD in the blend solvents of hexane and octane was spin coated onto the ZnO layer at 3000 rpm for 30 s as the emitting layer (EML). PEIE buffer layer were coated with same condition, then annealing at 130 °C for 10 min. Poly-TPD (10 mg mL−1) as hole transport layer (HTL) and MoOx (10 mg mL−1) as hole injection layer (HIL) were also spin-coated at 3000 rpm for 30 s with same annealing temperature (120 °C), at 20 min and 10 min respectively. Aluminum (Al, 100 nm) was deposited by thermal evaporation under 1 × 10⁻⁵ Torr.2.3 Optical analysis
UV-visible absorption (UV-vis) spectra and PL emission spectra were collected at room temperature with an FP-6200 spectrofluorometer and a V-630 Bio UV-vis spectrophotometer, respectively. The absolute PL quantum yield (QY)29 of the QDs was measured by QE-2100 from Otsuka Electronics Co., Ltd. We selected the 405 nm as the excitation wavelength for each QDs solution. The size and composition of A-, and AS-QDs were characterized with a JEM ARM 200F transmission electron microscope (TEM) and energy dispersive X-ray spectrometer (EDS). EDS spectra was averaged for hundreds of QDs from the different TEM image area. QDs dispersed in hexane were deposited from diluted solutions onto copper grids with carbon support. Wide-angle X-ray diffraction (WAXS) was performed with a Rigaku D/MAX-III diffractometer using Cu-Kα radiation operating at 30 kV and 40 mA. Each scan took about 20 min with a 2θ angular range from 5° to 80°. All measurements were performed at room temperature. Observed PL dynamics were measured using a time correlated single photon counting (TCSPC) system. The samples were excited at 405 nm, and the measurements were made at a repetition rate of 800 kHz at room temperature. The current density–voltage–luminance (J–V–L) characteristics of the devices were measured by a source measure unit (2400, Keithley Instruments, Inc.) and a luminance meter (CS-2000, Konica Minolta Sensing, Inc.).2.4 Stability analysis
The photo-oxidation experiments were performed by room-temperature ultraviolet (UV) treatment. The PL intensity of the solid-state QDs film (spin-coated on glass, ∼30 nm) was measured in certain time intervals followed by the PL measurements of the films during UV irradiation exposure (185 nm, 254 nm, 180 mW cm−2) in O2 environment and UV irradiation exposure (185 nm, 254 nm, 180 mW cm−2) in air environment. Long-term thermal stability was performed by subjecting the QD films to high temperature (120 °C in N2 glove box) and high humidity (85 °C and 85%, and 25 °C and 50% relative humidity conditions in air).3. Results and discussion
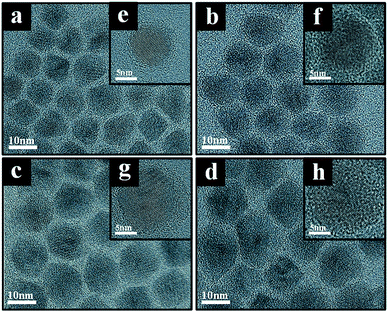
Fig. 1 shows TEM images of CdSe@ZnS A- and CdSe@ZnS/ZnS AS-QDs for the same CdSe@ZnS alloyed core/shell size but with ZnS outer shell of different thickness. The average diameter of the A-QDs, which is shown in Fig. 1a, was 9 ± 0.45 nm with no outer shell. The formation of CdSe@ZnS alloyed core/shell confirms with EDS mapping as shown in Fig. S1a and b.† All the Cd reacts with Se and S before any of the zinc as core of A-QDs, and a large excess of zinc reacts with Se and S as outer shell of A-QDs. The diameter of AS-QDs including the outer shell in Fig. 1b–d were 12 ± 0.45 nm, 13 ± 0.55 nm, and 13.6 ± 0.95 nm, respectively. To verify the composition of nanocrystals, the atoms ratio of elements in both the core and shell structure averaged over hundred QDs were determined (Fig. S1c†). The size of nanocrystals become larger gradually by the increasing amounts of Zn and S after the stage of alloyed core growth. Distinct lattice spacing observable in the high resolution transmission electron microscopy (HRTEM) images except for the largest ones indicates high crystalline quality of A- and AS-QDs. No distinct interfaces could be noticeable in the QDs, which can be attributed to good mutual diffusion leading to smooth interfaces.Shown in Fig. 2 are the UV-vis absorption and PL emission spectra of CdSe@ZnS A-QDs and CdSe@ZnS/ZnS AS-QDs as affected by the thickness of the outer shell. As the size of QDs or the thickness of the outer shell increases, the first excitation peak and sharp emission peaks are gradually blue shifted12,19,30 and the absorption peak of 300–350 nm is increased, which is an indication of ZnS formation. During the growth stage of ZnS shell, S anion is richer than Zn cation (table in Fig. S1c†). Therefore, S atoms diffuse into the alloyed core and it leads to the formation of CdS, and the wavelength becomes blue shifted.31 The PL spectra in the inset shows that the PL intensity of CdSe@ZnS/ZnS AS-QDs is more than twice the intensity of CdSe@ZnS A-QDs, with a full width at half maximum (FWHM) of only 21 nm. The absolute PL QY of the nanocrystals also increase from 44% for A-QDs up to 88% for AS-QDs (see Table 1).
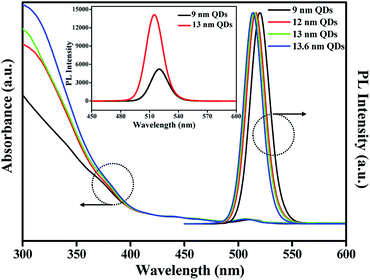 | ||
| Fig. 2 UV-vis absorption and PL spectra of QDs with different outer shell thickness (inset: the PL intensity of 9 nm QDs and 13 nm QDs, respectively). | ||
| QDs notation | Core radius (r)/shell thickness (H) (nm nm−1) | Total diameter (D ± Std, nm) | PL peak/FWHM (nm nm−1) | PL QY (%) | τ0 (ns) | τf (ns) | knrad |
|---|---|---|---|---|---|---|---|
| 9 nm QDs | 4.5/0 | 9 ± 0.45 | 521/22 | 44 | 10.3 | 3.4 | 0.054 |
| 12 nm QDs | 4.5/1.3 | 12 ± 0.45 | 517/21 | 75 | 12.0 | 6.0 | 0.021 |
| 13 nm QDs | 4.5/1.9 | 13 ± 0.55 | 515/21 | 88 | 14.8 | 7.2 | 0.008 |
| 13.6 nm QDs | 4.5/2.2 | 13.6 ± 0.95 | 514/21 | 82 | 12.9 | 6.4 | 0.014 |
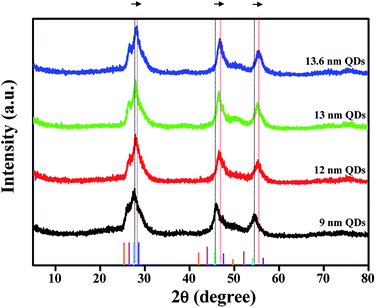
To examine the crystallographic features of the colloidal QDs, powder X-ray diffraction (XRD) analysis was conducted and the results are shown in Fig. 3. The standard XRD patterns of the theoretical peak positions of CdSe, CdS, ZnSe and ZnS bulk crystals are also provided in the bottom of the figure. Three distinct diffraction peaks of CdSe@ZnS A-QDs are located among those of CdSe, CdS, ZnSe and ZnS bulk crystals, confirming the growth of QDs with composition gradient (CdZnSeS). The diffraction peaks of QDs with composition gradient shifts to larger angles (the standard ZnS position) gradually as the Zn content increases, which is consistent with the epitaxial growth of a ZnS shell onto CdSe@ZnS A-QDs. The QDs grow in all directions while maintaining the spherical shape throughout the reaction.
To gain an insight into the effects of the outer shell thickness on the photoluminescence, exciton decay is recorded for both solution and film form of QDs by a time correlated single photon counting (TCSPC) system. Fig. 4a shows that the lifetime of the QDs in solution (τ0 in Table 1), as represented by the time at which the intensity is reduced by an exponential factor, is greatly increased by the presence of the outer shell, the exciton lifetime increasing from 10.3 ns to 14.8 ns, an increase of ∼44% due to the reduced non-radiative recombination rate (knrad) with the presence of the outer shell (Table 1). When QDs are assembled in solid film, on the other hand, the thickness affects the exciton lifetime of the QDs significantly as revealed by the lifetime τf in Table 1 and the decay behavior shown in Fig. 4b. In the film, the QDs are packed intimately, touching one another unlike those well dispersed in solution, and the non-radiative FRET would come into play because the rate of FRET is sensitively dependent on dot-to-dot distance when the distance is less than 10 nm. This fact explains why the lifetime is drastically reduced by 50 to 70% compared to that in the solution. However, the lifetime of the QDs in the film should progressively increase with increasing outer shell thickness up to a certain thickness by the suppression of the dot-to-dot energy transfer in solid film.23 The further increasing the shell thickness would be lead to increase non-radiative recombination of solution which are generation of the poor crystalline surface (Fig. 1h), thereby decreasing the lifetime. The optimum outer shell thickness, as shown in Table 1, is approximately 1.9 nm, which corresponds to a QD size of 13 nm. This result is also confirmed by the lowest non-radiative recombination rate (knrad)32 that the QD of 13 nm has (Table 1).
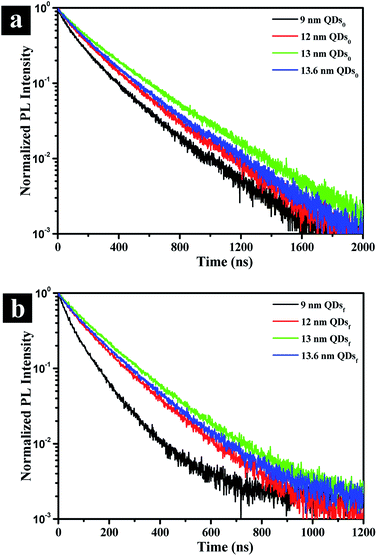 | ||
| Fig. 4 Photoluminescence decay curves in solution (a) and film (b) states for CdSe@ZnS A-QDs, and CdSe@ZnS/ZnS AS-QDs as affected by outer shell thickness (QDs0: QDs solution; QDsf: QDs film). | ||
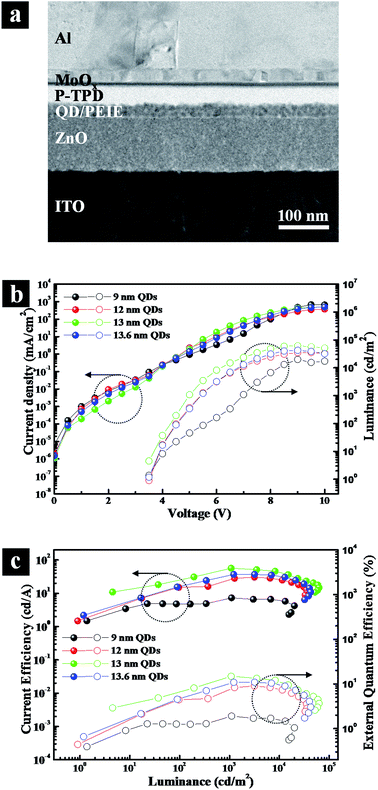
To exemplify the importance of the optimal outer shell thickness, we explored A-QDs, AS-QDs as the emitting layer in LEDs. The cross-sectional transmission electron microscopy (TEM) image of an inverted structure QLED is shown in Fig. 5a that was fabricated with layers of ITO/ZnO/QDs/polyethylenimine ethoxylated (PEIE)/poly (N,N′-bis (4-butylphenyl)-N,N′-bis (phenyl)-benzidine) (poly-TPD)/MoOx/Al. All the active layers are solution-deposited except for Al electrode. Note that an interfacial layer of PEIE is introduced between QD layer and poly-TPD HTL. It plays multiple roles of protecting the integrity of the QD layer, which is derived from its hydrophilic property, and upshifting the valence band maximum (VBM) of QD, which arises due to the interfacial dipole property. It reduces the barrier height against hole-transport from HTL to EML, resulting in an optimized charge balance in the device.
Fig. 5b and c give the current density–voltage–luminance (J–V–L) characteristics, and current efficiency and external quantum efficiency characteristics, respectively. The figures show that the QLED based on A-QDs (9 nm) yields a maximum brightness of approximately 20![[thin space (1/6-em)]](https://www.rsc.org/images/entities/char_2009.gif) 000 cd m−2, a current efficiency (CE) of 7.3 cd A−1, and an external quantum efficiency (EQE) of 1.9%. A substantial improvement in the performance of QLEDs resulted when AS-QDs were used. With the optimal thickness of 13 nm, in particular, the peak luminescence increased to 62
000 cd m−2, a current efficiency (CE) of 7.3 cd A−1, and an external quantum efficiency (EQE) of 1.9%. A substantial improvement in the performance of QLEDs resulted when AS-QDs were used. With the optimal thickness of 13 nm, in particular, the peak luminescence increased to 62![[thin space (1/6-em)]](https://www.rsc.org/images/entities/char_2009.gif) 700 cd m−2, the CE to 56.6 cd A−1, and the peak EQE to 14.8% with a turn-on voltage of 3.5 V. These values represent a 3-fold increase in brightness, and a more than 7-fold increase in both current and external quantum efficiencies, compared with A-QDs device.
700 cd m−2, the CE to 56.6 cd A−1, and the peak EQE to 14.8% with a turn-on voltage of 3.5 V. These values represent a 3-fold increase in brightness, and a more than 7-fold increase in both current and external quantum efficiencies, compared with A-QDs device.
A thicker shell tends to reduce surface trap states and suppress the dot-to-dot energy transfer. Furthermore, a reduction in non-radiative Auger recombination due to a thicker shell must have contributed significantly to enhancing the device performance.33 Auger recombination is a process of non-radiative recombination due to the energy transferred to a third carrier, which decreases the luminescence of QDs.34 After the growth of the thicker shell, electron wave function is delocalized into the thick shell region, whereas the hole remains in the core by a strong confinement in the core.35 That weakens the interaction of carriers by reducing the electron–hole spatial overlap. Therefore, a thicker shell suppresses charging and reduces the Auger recombination efficiency, resulting in better performance of QLEDs.
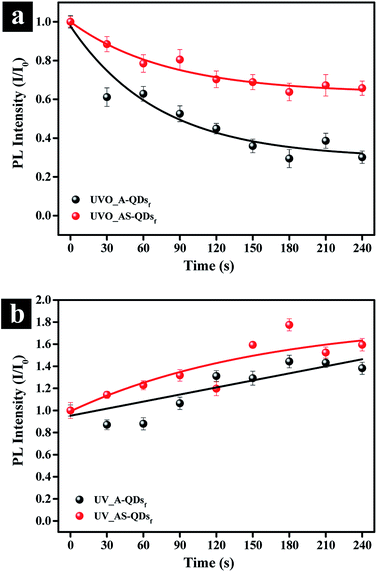
In addition to the benefits accrued from the outer shell discussed above, the outer layer of ZnS has a lower charge density on its surface compared to CdS, which would reduce photo-stimulated degradation of QDs.12 The photo-oxidation stability of quantum dot is important for industrial applications. To test the stability, A- and AS-QD films were subjected to UV irradiation in O2 and air filled environment. Fig. 6a and S2a† show the evolution of the photo-oxidation stability in terms of relative PL intensity. For the tests, the films were exposed to UV/ozone irradiation (O2 → 2O−; O− + O2 → O3) in intervals of 30 seconds. The figure shows that the PL intensity decreases to 61% of the initial PL intensity after 30 seconds of exposure in the absence of the outer shell (A-QDs). After 240 s exposure, the intensity is only 30% of the initial phase of the irradiation. In comparison, the intensity also decreases 12% in the initial phase of the irradiation even for the QDs with the outer shell (AS-QDs) and is more stable against oxidation. At the end of test, AS-QDs still maintains 65% of its initial PL intensity, which is 1.5 times higher than the initial PL intensity of A-QDs and 5 times higher than the final PL intensity of A-QDs (Fig. 6a and S2a†). This result indicates that the outer shell as a protective barrier efficiently decreases the probability of surface oxidation and resists the quenching.
The effect of UV irradiation alone in the absence of oxygen or ozone (O2 or O3) was investigated. UV exposure in the air (Fig. 6b) was achieved by sealing samples to isolate them from external oxygen or ozone (Fig. 6a). The results in Fig. 6b and S2b† show an increase in the PL of both two kinds of QDs. The enhancement in the PL of QDs can be attributed to the photoactivation of QDs with UV illumination and the assistance of a little oxygen in the air that passivates the surface defects.27 In conclusion, UV irradiation in air (little O2) can enhance the PL of QDs by photoactivation phenomenon; but the UVO reduces the PL of QDs. A relatively thick inorganic shell can effectively eliminate the probability of photo-oxidation and improve the photostability. There was no blue-shift in the emission spectrum of QDs (Fig. S2†), which indicates that the size of QDs is unchanged.
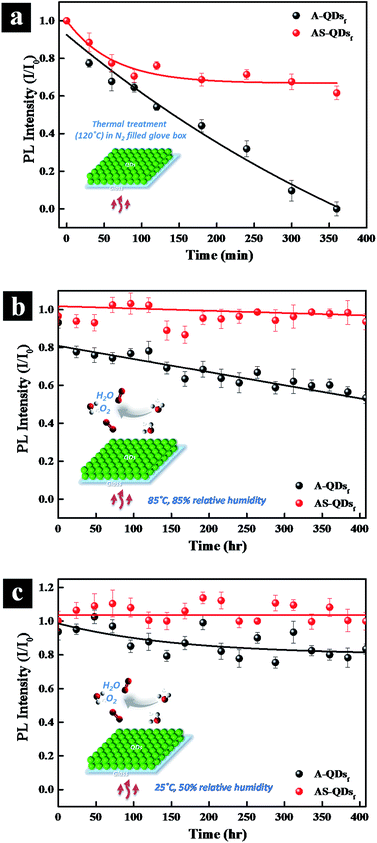
Long-term thermal stability is also examined by subjecting the QD films to high temperature and high humidity. When the QD films are heated at 120 °C in N2 glove box (Fig. 7a), the PL intensity of A-QD practically disappears after 360 min.
However, the intensity of AS-QD reaches a plateau of 60% after 250 min and do not decrease much thereafter. The two types of QDs are also subjected to 85 °C, 85% relative humidity (RH) conditions in air. Fig. 7b shows that with time increasing, the AS-QD film has a little fluctuation in relative PL intensity but do not show any apparent adverse effects over the period of 400 h. On the other hand, the relative PL intensity of A-QD film decreases steadily over the period of time. It is notable that only a 7% loss in PL occurred even after 400 h of exposure of AS-QDs to harsh thermal conditions. Fig. 7c examines the stability of the two different QD films under the conditions of 25 °C and 50% RH over a period of 400 h. Compared to the harsher conditions of 85 °C and 85% RH, the PL intensity of the AS-QD film is much more stable, the value being almost invariant with time. These results clearly indicate that the film of AS-QDs is more stable against moisture and oxygen compared to that of A-QDs. The outer shell provides an excellent physical barrier and protects the core of QDs against high temperature, oxygen, and moisture, leading to the long term thermal stability of the PL of the QDs.
4. Conclusion
In conclusion, we have found that the absolute PL QY of QDs can be increased to 88% by properly selecting the thickness of the outer shell that coats the alloyed, graduated core/shell QDs. When these QDs with the optimal thickness were used in a QLED, more than a 7 fold increase in the external quantum efficiency resulted compared to the QDs without the outer shell, reflecting the substantial improvement in PL QY due to the outer shell. The AS-QDs with the outer shell have been found to resist degradation when exposed to UV in oxygen or ozone environment. They also exhibit long-term stability even after 400 h of exposure to high temperature and high humidity. Removal of non-radiative recombination sources and presence of a physical barrier, made possible by the alloyed, graded core/shell with outer shell of optimal thickness, is believed to be responsible for the excellent performance.Conflicts of interest
There are no conflicts to declare.Acknowledgements
This work was financially supported by the Basic Science Research Program through the National Research Foundation of Korea (NRF) funded by the Ministry of Education, Science and Technology (NRF-2015R1A2A2A01003520). This research was also supported by the Ministry of Science, ICT and Future Planning (MSIP), Korea, under the Information Technology Research Center (ITRC) support program (IITP-2016-H8501-16-1009) supervised by the Institute for Information & Communications Technology Promotion (IITP).Notes and references
- W. K. Bae, S. Brovelli and V. I. Klimov, MRS Bull., 2013, 38, 721 CrossRef.
- B. Dabbousi, M. Bawendi, O. Onitsuka and M. Rubner, Appl. Phys. Lett., 1995, 66, 1316 CrossRef CAS.
- S. Coe, W.-K. Woo, M. Bawendi and V. Bulović, Nature, 2002, 420, 800 CrossRef CAS PubMed.
- D. Kim, Y. Fu, S. Kim, W. Lee, K.-H. Lee, H. K. Chung, H.-J. Lee, H. Yang and H. Chae, ACS Nano, 2017, 11, 1982 CrossRef CAS PubMed.
- O. E. Semonin, J. M. Luther, S. Choi, H.-Y. Chen, J. Gao, A. J. Nozik and M. C. Beard, Science, 2011, 334, 1530 CrossRef CAS PubMed.
- X. Wang, G. I. Koleilat, J. Tang, H. Liu, I. J. Kramer, R. Debnath, L. Brzozowski, D. A. R. Barkhouse, L. Levina and S. Hoogland, Nat. Photonics, 2011, 5, 480 CrossRef CAS.
- M. Bruchez, M. Moronne, P. Gin, S. Weiss and A. P. Alivisatos, Science, 1998, 281, 2013 CrossRef CAS PubMed.
- W. C. Chan and S. Nie, Science, 1998, 281, 2016 CrossRef CAS PubMed.
- X. Gao, Y. Cui, R. M. Levenson, L. W. Chung and S. Nie, Nat. Biotechnol., 2004, 22, 969 CrossRef CAS PubMed.
- H. Y. Yang, Y. Fu, M.-S. Jang, Y. Li, J. H. Lee, H. Chae and D. S. Lee, ACS Appl. Mater. Interfaces, 2016, 8, 35021 CAS.
- L. H. Qu and X. G. Peng, J. Am. Chem. Soc., 2002, 124, 2049 CrossRef CAS PubMed.
- R. Xie, U. Kolb, J. Li, T. Basché and A. Mews, J. Am. Chem. Soc., 2005, 127, 7480 CrossRef CAS PubMed.
- W. K. Bae, J. Kwak, J. W. Park, K. Char, C. Lee and S. Lee, Adv. Mater., 2009, 21, 1690 CrossRef CAS.
- S. K. Panda, S. G. Hickey, C. Waurisch and A. Eychmüller, J. Mater. Chem., 2011, 21, 11550 RSC.
- H. Shen, S. Wang, H. Wang, J. Niu, L. Qian, Y. Yang, A. Titov, J. Hyvonen, Y. Zheng and L. S. Li, ACS Appl. Mater. Interfaces, 2013, 5, 4260 CAS.
- A. Wang, H. Shen, S. Zang, Q. Lin, H. Wang, L. Qian, J. Niu and L. Song Li, Nanoscale, 2015, 7, 2951 RSC.
- D. Kim, Y. Fu, J. Kim, K. H. Lee, H. Kim, H. Yang and H. Chae, Nanotechnology, 2016, 27, 245203 CrossRef PubMed.
- Y. Fu, D. Kim, H. Moon, H. Yang and H. Chae, J. Mater. Chem. C, 2017, 5, 522 RSC.
- X. Zhong, M. Han, Z. Dong, T. J. White and W. Knoll, J. Am. Chem. Soc., 2003, 125, 8589 CrossRef CAS PubMed.
- B. C. Fitzmorris, Y. C. Pu, J. K. Cooper, Y. F. Lin, Y. J. Hsu, Y. Li and J. Z. Zhang, ACS Appl. Mater. Interfaces, 2013, 5, 2893 CAS.
- A. R. Clapp, I. L. Medintz and H. Mattoussi, ChemPhysChem, 2006, 7, 47 CrossRef CAS PubMed.
- K.-H. Lee, J.-H. Lee, H.-D. Kang, B. Park, Y. Kwon, H. Ko, C. Lee, J. Lee and H. Yang, ACS Nano, 2014, 8, 4893 CrossRef CAS PubMed.
- B. N. Pal, Y. Ghosh, S. Brovelli, R. Laocharoensuk, V. I. Klimov, J. A. Hollingsworth and H. Htoon, Nano Lett., 2012, 12, 331 CrossRef CAS PubMed.
- S. Xu, H. Shen, C. Zhou, H. Yuan, C. Liu, H. Wang, L. Ma and L. S. Li, J. Phys. Chem. C, 2011, 115, 20876 CAS.
- S. Jun and E. Jang, Angew. Chem., 2013, 52, 679 CrossRef CAS PubMed.
- Y. Yang, Y. Zheng, W. Cao, A. Titov, J. Hyvonen, J. R. Manders, J. Xue, P. H. Holloway and L. Qian, Nat. Photonics, 2015, 9, 259 CAS.
- C. Carrillo-Carrion, S. Cardenas, B. M. Simonet and M. Valcarcel, Chem. Commun., 2009, 5214 RSC.
- W. K. Bae, J. Kwak, J. W. Park, K. Char, C. Lee and S. Lee, Adv. Mater., 2009, 21, 1690 CrossRef CAS.
- M. D. Ho, D. Kim, N. Kim, S. M. Cho and H. Chae, ACS Appl. Mater. Interfaces, 2013, 5, 12369 CAS.
- H. Kim, J. Y. Han, D. S. Kang, S. W. Kim, D. S. Jang, M. Suh, A. Kirakosyan and D. Y. Jeon, J. Cryst. Growth, 2011, 326, 90 CrossRef CAS.
- J. Kwak, J. Lim, M. Park, S. Lee, K. Char and C. Lee, Nano Lett., 2015, 15, 3793 CrossRef CAS PubMed.
- J. Lim, B. G. Jeong, M. Park, J. K. Kim, J. M. Pietryga, Y. S. Park, V. I. Klimov, C. Lee, D. C. Lee and W. K. Bae, Adv. Mater., 2014, 26, 8034 CrossRef CAS PubMed.
- W. K. Bae, Y. S. Park, J. Lim, D. Lee, L. A. Padilha, H. McDaniel, I. Robel, C. Lee, J. M. Pietryga and V. I. Klimov, Nat. Commun., 2013, 4, 2661 Search PubMed.
- V. I. Klimov, Annu. Rev. Condens. Matter Phys., 2014, 5, 285 CrossRef CAS.
- B. N. Pal, Y. Ghosh, S. Brovelli, R. Laocharoensuk, V. I. Klimov, J. A. Hollingsworth and H. Htoon, Nano Lett., 2011, 12, 331 CrossRef PubMed.
Footnote |
| † Electronic supplementary information (ESI) available. See DOI: 10.1039/c7ra06957j |
| This journal is © The Royal Society of Chemistry 2017 |

