 Open Access Article
Retracted Article: Self-association of L-periaxin occurs via its acidic domain and NLS2/NLS3, and affects its trafficking in RSC96 cells
Yenan Yang†
,
Min Liang† and
Yawei Shi *
*
Institute of Biotechnology, Key Laboratory of Chemical Biology, Molecular Engineering of Ministry of Education, Shanxi University, Taiyuan 030006, P. R. China. E-mail: yangyenan@foxmail.com; 1551193739@qq.com; yaweishi@sxu.edu.cn; Tel: +86-351-7018268
First published on 12th September 2017
Abstract
Periaxin (PRX) protein was first identified in myelinating Schwann cells through the screening of cytoskeleton-associated proteins in peripheral nerve myelination. PRX plays a significant role in myelin sheath formation and myelin stability, and is closely related to tumor cell metastasis. As described, several loss-of-function mutations were linked to autosomal recessive Dejerine–Sottas neuropathy and demyelinating Charcot–Marie–Tooth disease, type 4F (CMT4F) caused by periaxin mutation. In this study, we report that L-PRX self-association occurs by head-to-tail joining of the nuclear localization signal NLS2 and NLS3 in the tripartite nuclear localization signal and acidic domains. The self-association of L-PRX in RSC96 cells is remarkably weakened by DRP2 and the synthetic NLS3 peptide. In the acidic domain of L-PRX, E1259K mutation weakens the head-to-tail interaction, causing CMT4F disease. The membrane localization of L-PRX in RSC96 was increased by the disruption of self-association by DRP2 and the synthetic NLS3 peptide. The self-association of L-PRX is a possible type of self-regulation of PRX during the localization between the cell membrane and cytoplasm or nucleus.
1. Introduction
Periaxin (PRX) protein is expressed exclusively by myelinating Schwann cells.1 This protein assembles appositions between the abaxonal surface of myelin sheath and the Schwann cell plasma membrane.2 By weight, PRX comprises 16% of the peripheral nervous system's myelin protein.3 During myelination, PRX, myelin protein zero,4 myelin basic protein,5 myotubularin-related protein 2,6 connexin-32 (ref. 7) and myelin-associated glycoprotein8 jointly maintain myelin sheath formation and cellular signal transduction. In addition, PRX, as the membrane skeleton protein of lens fiber cells,9 plays a key role in transmembrane signal transduction10 and nutrient transportation.11 PRX has two isoforms, namely, L-PRX and a truncated isoform, S-PRX.12 These isoforms have an N-terminal PDZ protein-binding domain. Several additional domains in L-PRX are presented as follows: highly basic domain functioning as nuclear localization signal (NLS), long repeat domain and an acidic domain.13–15PDZ, as a common modular interaction domain, regulates protein–protein interactions in cells and plays an important role in the organization of signaling complexes.16 L-PRX is homodimerized via its PDZ domain16 and the crystal structure of the PDZ dimer was recently obtained.17 In addition, L-PRX could interact with S-PRX through the PDZ domain.18 The NLS domain of L-PRX is basic, tripartite and composed of three synergistically acting signals, namely NLS1 (116–145 aa), NLS2 (145–176 aa) and NLS3 (177–196 aa).14 This domain plays a key role in the nuclear targeting of L-PRX in embryonic Schwann cells and shuttling between the nucleus and cortical-signaling or adherence complexes.14 In addition, the NLS domain mediates the interaction between L-PRX and dystrophin-related protein 2 (DRP2), and further guides the cell cytoskeleton and basement membrane localization of DRP2.19,20 Deletion mutation of the repeat domain is associated with predominantly motor neuropathy.21 Deletion mutation of the acidic domain causes Charcot–Marie–Tooth disease, type 4F (CMT4F).22 PRX mutation analysis in neuropathy patients showed that recessive Dejerine–Sottas neuropathy is caused by R1132G, E1259K, E1359del and R1070X mutations in the acidic domain.15,23
In this study, a series of N- and C-terminally truncated L-PRX constructs were used to investigate the relationship of the structure and function of L-PRX. The acidic domain at the C-terminal of L-PRX could bind to the protein's NLS domain at the N-terminal and this interaction affects the localization of L-PRX in RSC96 cells, which are derived from first generation of rat Schwann cell. The self-association in L-PRX is weakened by DRP2, E1259K and synthetic NLS3 peptides. We propose a model whereby L-PRX could be autoinhibited by its two terminal domains and could be activated through the binding of DRP2 with the NLS2 and NLS3 regions to strengthen the membrane complex formation.
2. Material and methods
2.1. Plasmid construction
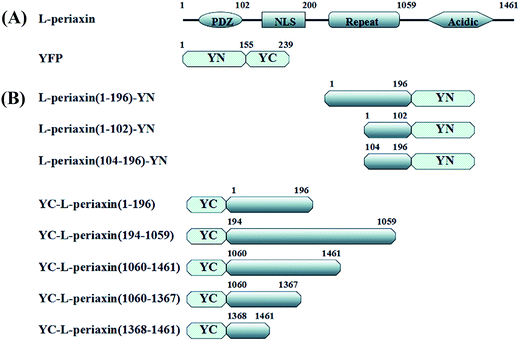
A series of N- and C-terminally truncated L-PRX were amplified from L-PRX cDNA (BC067266.1). PDZ (1–102 aa), NLS (104–196 aa), and L-PRX (1–196 aa) were then cloned into the pYN expression vector with BamHI and EcoRI and sequenced (Sangon Biotech, China). L-PRX (1–196 aa), L-PRX (194–1059 aa), L-PRX (1060–1461 aa), L-PRX (1060–1367 aa), L-PRX (1368–1461 aa), and L-PRX (118–1367 aa)-yellow fluorescent protein (YFP) (1–155 aa) were cloned into the pYC expression vector with BamHI and EcoRI and sequenced (Fig. 1A and B). A similar strategy was performed to generate c-Myc-tagged acidic domain (1060–1461 aa), enhanced-green-fluorescent-protein (EGFP)-fusion constructs with L-PRX (1–196 aa), L-PRX (194–1059 aa), acidic domain (1060–1461 aa), L-PRX (1060–1367 aa), and L-PRX (1368–1461 aa). The following primers were used: PDZ (1–102 aa)-F(forward): 5′-TGGGATCCGACAGCCGCAGCCTG-3′, PDZ (1–102 aa)-R(reverse): 5′-GAATTCCACAGTGCGCTTCAG-3′, NLS (104–196 aa)-F: 5′-GTGGATCCCCCACCGGGGACCTG-3′, NLS (104–196 aa)-R: 5′-GCGAATTCCACTTCTCGTACACG-3′, L-PRX (1–196 aa)-F: 5′-TGGGATCCGACAGCCGCAGCCTG-3′, L-PRX (1–196 aa)-R: 5′-GCGAATTCCACTTCTCGTACACG-3′, L-PRX (194–1059 aa)-F: 5′-GCGGATCCCGGCTGCGTGTACG-3′, L-PRX (194–1059 aa)-R: 5′-CTGGATCCCTTCACCCTCCCATC-3′, L-PRX (1060–1461 aa)-F: 5′-GAGGATCCATGCCCAAGCTGAAG-3′, L-PRX (1060–1461 aa)-R: 5′-GTGAATTCGACAGCCGCAGCCTG-3′, L-PRX (1060–1367 aa)-F: 5′-GAGGATCCATGCCCAAGCTGAAG-3′, L-PRX (1060–1367 aa)-R: 5′-CAGAATTCTGGGCCCCTTCCCCACT-3′, L-PRX (1368–1461 aa)-F: 5′-GAGGATCCATGTGATGTCGGGTCGCCGG-3′, L-PRX (1368–1461 aa)-R: 5′-GTGAATTCGACAGCCGCAGCCTG-3′. L-PRX (118–1367 aa)-F: GAGAATTCTGGAGATCAAGGGCCCGCGG. L-PRX (118–1367 aa)-R: CTGGATCCCGCCGCAATCCACCCTC. YFP (1–155 aa)-F: CGGGGATCCAATGGTGAGCAAGGGC. YFP (1–155 aa)-R: CATCTAGATCTTAGGCCATGATATAGAC.2.2. Cell culture and transfection
RSC96 cells (GNR6; Type Culture Collection of the Chinese Academy of Sciences, Shanghai, China) were maintained in Dulbecco's modified Eagle's medium (DMEM) (E500003; Sangon Biotech, Shanghai, China) supplemented with 10% fetal bovine serum at 37 °C in a 5% CO2 humidified atmosphere. HeLa cells (TCHu187; Type Culture Collection of the Chinese Academy of Sciences, Shanghai, China) were grown in DMEM supplemented with 10% fetal bovine serum at 37 °C and 5% CO2 (SH30022.01B; HyClone, Beijing, China). Prior to transfection, the cells were seeded into six-well trays and cultured overnight. Subsequently, the cells were transiently transfected with TurboFect transfection reagent (Thermo Scientific, USA) at 50–70% confluency with the indicated plasmids as per the manufacturer's protocol.2.3. Cell harvesting and lysis
Cells were trypsinized and spun down. The pellets were washed with phosphate-buffered saline (PBS) and resuspended in 250 μL of lysis buffer (Sangon Biotech, Shanghai, China). The cells were placed on ice for 20 min and lysed. The lysates were immediately centrifuged at 13![[thin space (1/6-em)]](https://www.rsc.org/images/entities/char_2009.gif) 000g and 4 °C for 20 min. The supernatant cytosolic fraction was transferred to a clean tube.
000g and 4 °C for 20 min. The supernatant cytosolic fraction was transferred to a clean tube.
2.4. Expression and purification of glutathione S-transferase (GST) fusion proteins
The GST-tagged fusion proteins were cloned in the pGEX-6P-1 vector as follows: GST-tagged L-PRX (1–196 aa), GST-tagged PDZ (1–102 aa), and GST-tagged NLS (104–200 aa). The GST-tagged fusion proteins were expressed in Escherichia coli BL21 (DE-3) cells and the crude cell extract was prepared following the Invitrogen protocol under native conditions. The proteins were affinity-purified with Glutathione Sepharose 4B beads (GE Healthcare, Uppsala, Sweden) as suggested by the manufacturer.2.5. GST pull-down assay
Transfected RSC96 cells were lysed on ice. The cell lysates were cleared by centrifugation at 13![[thin space (1/6-em)]](https://www.rsc.org/images/entities/char_2009.gif) 000g for 20 min. Purified GST-fused protein (150 μg) was initially attached to 20 μL of Glutathione Sepharose 4B beads (50% slurry) and then incubated at 4 °C with 250 μL of cell lysate for 4 h. The beads were washed thrice with PBS, and the bound proteins were eluted with 10 mM glutathione. The samples were separated by 12% sodium dodecyl sulfate polyacrylamide gel electrophoresis (SDS-PAGE) and transferred onto nitrocellulose (NC) membrane (Sangon Biotech, Shanghai, China). The membrane was blotted with the corresponding primary antibodies, namely, mouse anti-GFP (Transgene, Beijing, China) and rabbit anti-GST (Beyotime, Shanghai, China), followed by horseradish peroxidase (HRP)-labeled secondary antibodies. The immunoreactive bands were visualized by chemiluminescence using western blot detection reagents (Engreen Biosystem, Beijing, China).
000g for 20 min. Purified GST-fused protein (150 μg) was initially attached to 20 μL of Glutathione Sepharose 4B beads (50% slurry) and then incubated at 4 °C with 250 μL of cell lysate for 4 h. The beads were washed thrice with PBS, and the bound proteins were eluted with 10 mM glutathione. The samples were separated by 12% sodium dodecyl sulfate polyacrylamide gel electrophoresis (SDS-PAGE) and transferred onto nitrocellulose (NC) membrane (Sangon Biotech, Shanghai, China). The membrane was blotted with the corresponding primary antibodies, namely, mouse anti-GFP (Transgene, Beijing, China) and rabbit anti-GST (Beyotime, Shanghai, China), followed by horseradish peroxidase (HRP)-labeled secondary antibodies. The immunoreactive bands were visualized by chemiluminescence using western blot detection reagents (Engreen Biosystem, Beijing, China).
2.6. Co-immunoprecipitation
Co-immunoprecipitations were performed using the total lysates from RSC96 cells overexpressing Myc-tagged L-PRX (1060–1461 aa) and GFP-tagged L-PRX (1–196 aa); Myc-tagged L-PRX (1060–1367 aa) and GFP-tagged L-PRX-PDZ-NLS1 (1–145 aa); Myc-tagged L-PRX (1060–1367 aa) and GFP-tagged L-PRX-PDZ-NLS2 (1–102 and 146–176 aa); Myc-tagged L-PRX (1060–1367 aa) and GFP-tagged L-PRX-PDZ-NLS3 (1–102 and 177–196 aa). The cells were co-transfected at approximately 80% confluency with pCMV-Tag3B-L-PRX (1060–1461 aa) and pEGFP-N1-L-PRX (1–196 aa); pCMV-Tag3B-L-PRX (1060–1367 aa) and pEGFP-N1-L-PRX-PDZ-NLS1 (1–145 aa); pCMV-Tag3B-L-PRX (1060–1367 aa) and pEGFP-N1-L-PRX-PDZ-NLS2 (1–102 and 146–176 aa); pCMV-Tag3B-L-PRX (1060–1367 aa) and pEGFP-N1-L-PRX-PDZ-NLS3 (1–102 and 177–196 aa) for 48 h. The lysate aliquots were incubated at 4 °C overnight with 2 μg of anti-Myc (Beyotime, Shanghai, China) or anti-GFP (Beyotime, Shanghai, China) in a rotator and 2 μg of mouse IgG; the other half of lysate was used as the control. Further, protein A + G agarose (Beyotime, Shanghai, China) was added, and the samples were incubated at 4 °C for 4 h. The beads were then washed thrice with PBS. SDS-PAGE loading sample buffer (5×) was added to inhibit the reactions, and the proteins were separated using SDS-PAGE and transferred to NC membrane. The blots were probed with primary antibodies, mouse anti-GFP (Beyotime, Shanghai, China) and mouse anti-Myc (Beyotime, Shanghai, China), and then with the HRP-labeled secondary antibodies. The immunoreactive bands were visualized by chemiluminescence using western blot detection reagents.2.7. Competitive co-immunoprecipitation
RSC96 co-transfected with pEGFP-L-PRX (1060–1367 aa) and pCMV-Tag2B-L-PRX (104–196 aa) and/or pCMV-Tag3B-DRP2. The RSC96 lysates were subjected to co-immunoprecipitation using anti-IgG or anti-GFP and analyzed using western blot analysis using anti-GFP, anti-Flag, anti-Myc and anti-IgG antibodies following the processes as mentioned above.2.8. Bimolecular fluorescence complementation (BiFC)
In the BiFC assay, YFP is generally cleaved at the amino acidic residues between 155 and 156 in the YFP gene. The N-terminus consists of 1–155 aa residues (YN) and the C-terminus consists of 156–239 aa residues (YC) (Kerppola 2008). Thus, the pYN and pYC plasmids were constructed to display the YN and YC of YFP. HeLa cells grown on glass coverslips at ∼50% confluency were co-transfected with combinations of pYN-L-PRX (1–196 aa)/pYC-L-PRX (1–196 aa), pYN-L-PRX (1–196 aa)/pYC-L-PRX (194–1059 aa), pYN-L-PRX (1–196 aa)/pYC-L-PRX (1060–1461 aa), pYN-L-PRX (1–102 aa)/pYC-L-PRX (1060–1367 aa), pYN-L-PRX (1–102 aa)/pYC-L-PRX (1368–1461 aa), pYN-L-PRX (104–196 aa)/pYC-L-PRX (1060–1367 aa), pYN-L-PRX (104–196 aa)/pYC-L-PRX (1368–1461 aa), and pYC-L-PRX (118–1367 aa)-YN, while pYN/pYC was used as the control. Approximately 24 h after transfection, excluding those transfected with pYC-L-PRX (118–1367 aa)-YN, the cells were washed thrice with PBS to remove the DMEM. Different concentrations of the synthetic NLS3 peptide were incubated with the HeLa cells transfected with pYC-L-PRX (118–1367 aa)-YN for 6 h at 37 °C. The cells were then fixed with absolute methanol at 4 °C for 7 min. Following this, the cells were washed with PBS, incubated with 4,6-diamidino-2-phenylindole (DAPI) at 37 °C for 15 min, and then examined under a confocal microscope at 60× magnification.2.9. Flow cytometry detection of fluorescence intensity of HeLa cells
HeLa cells were transfected with the indicated plasmids at roughly 70% confluency. pYN and pYC were co-transfected in the control group. The experimental groups were co-transfected with combinations of pYN-L-PRX (104–196 aa) and pYC-L-PRX (1060–1367 aa) along with pCMV-Tag3B, pYN-L-PRX (104–196 aa), pYC-L-PRX (1060–1367 aa), and pCMV-Tag3B-DRP2. After 24 h, the cells were washed thrice with PBS to remove the DMEM, and then trypsinized and centrifuged. The pellets were resuspended in 1 mL PBS, and the fluorescein isothiocyanate (FITC) fluorescence intensity was detected using a flow cytometer (FACSCalibur, BD Bioscience, USA).2.10. Distribution of protein observed using immunofluorescence microscopy and western blot analysis
RSC96 cells were plated on coverslips and co-transfected with pCMV-Tag2B-L-PRX (1–1461 aa), pCMV-Tag2B-L-PRX (1–196 aa), and/or pCMV-Tag3B-L-PRX (1060–1461 aa). After 24 h of transfection, the DMEM medium was removed by washing the cells thrice with PBS. The cells were fixed with paraformaldehyde solution at room temperature for 30 min, and then blocked in a solution of 5% (v/v) fetal bovine serum and 0.3% (v/v) Triton X-100 in PBS at room temperature for 1 h. The blocked cells were incubated overnight with mouse anti-Flag (Beyotime, Shanghai, China) in 5% (v/v) fetal bovine serum (in PBS). The slides were washed using a blocking buffer without fetal bovine serum and incubated with the secondary antibody, FITC-labeled goat anti-mouse (Transgene, Beijing, China). Both antibodies were present in 5% (v/v) fetal bovine serum (in PBS) and incubated at room temperature for 1 h. Then, 100 nM phalloidin (Beyotime, Shanghai, China) was added to the RSC96 cells, and they were incubated at room temperature for 30 min. The cells were washed in PBS, and then incubated with DAPI for 15 min. Finally, the cells were examined with a confocal microscope (FV1000; Olympus Corporation, Japan) at 100× magnification. The pinhole was set at its default value, which is 1 airy disc. A total of one hundred cells were counted and in the cytoplasm and cytomembrane, the rate of the L-PRX position was calculated.The co-transfected RSC96 cells were collected. Membrane, nuclear and cytoplasmic protein extraction kits (Engreen Biosystem, Beijing, China) were utilized to separate the cell cytoplasm and membrane, and protein expression was detected using western blot analysis. The blots were probed with the primary antibody, mouse anti-Flag (Beyotime, Shanghai, China) and then with the HRP-labeled secondary antibodies. The immunoreactive bands were visualized by chemiluminescence using western blot detection reagents. The immunoreactive bands of the proteins were quantified using Image J software.
RSC96 cells were plated on coverslips or a culture dish in DMEM medium supplemented with 10% FBS. After 24 h, 4 μg mL−1 of the synthetic NLS3 peptide was added to the hatch cells for 6 h at 37 °C. The localization of L-PRX was detected using the abovementioned immunofluorescence methods.
Dorsal root ganglion (DRG) neurons (RNCL-007; iCell, Bioscience, Shanghai, China) were plated on the coverslips at a density of 1 × 10⁴ cells in DMEM medium supplemented with 10% FBS. After 24 h, the RSC96 cells were plated onto the neurons at a density of 3 × 10⁴ cells per coverslip in DMEM medium supplemented with 10% FBS, 50 μg mL−1 ascorbic acid, 50 ng mL−1 NGF and 50 μg mL−1 heparin. After 48 h, the synthetic NLS3 peptides were added to hatch the cells for 6 h at 37 °C. The cells were washed thrice with PBS to remove the DMEM. The cells were blocked, and then incubated overnight with rabbit anti-MBP (Beyotime, Shanghai, China) and goat anti-L-PRX (Santa Cruz Biotechnology, Shanghai, China) in 5% (v/v) fetal bovine serum (in PBS). After washing with PBS, the samples were incubated with the secondary antibodies, fluorescein isothiocyanate (FITC)-labeled goat anti-rabbit (Transgene, Beijing, China), and/or tetramethyl rhodamine isothiocyanate (TRITC)-labeled rabbit anti-goat (Transgene, Beijing, China) for 1 h. The cell nuclei were stained with DAPI. The following processes are as mentioned below.
2.11. RNAi of DRP2 in RSC96 cells
In this study, we used two sets of small interfering RNA (siRNA) sequences with different inhibition efficiencies targeted for rat DRP2. The primers used have the following sequences. Sense: (5′-GCCACCCACTGAATCAGAT-3′) and antisense: (5′-ATCTGATTCAGTGGGTGGC-3′). TTCTCCGAACGTGTCACGT, a non-specific 19-nucleotide siRNA, was scrambled to the first pair and used as a control. The primer pairs were annealed and inserted into the Age I and EcoRI sites of the pLKD-CMV-G&PR-U6-shRNA vector and transformed into the RSC96 cells. These cells were collected after 48 h of transfection. Western blot analysis was used to detect protein expression of DRP2 in RSC96 cells.2.12. Statistical analysis
The results were analyzed using SPSS 17.0 software. All data were presented as the mean ± standard deviation obtained from three independent experiments and analyzed with one-way analysis of variance (ANOVA) with Tukey's multiple comparison tests. Statistically significant value was defined as p < 0.05.3. Results
3.1. Existence of self-interaction in L-PRX
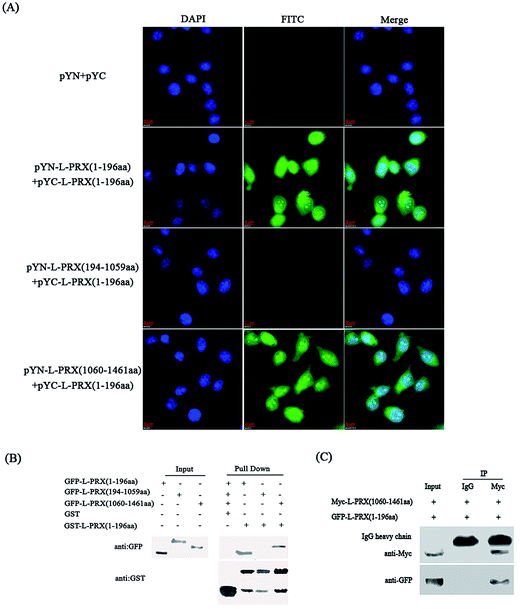
A BiFC assay was performed to determine whether self-interaction exists between the N- and C-terminus of L-PRX. Expression plasmids, pYN-L-PRX (1–196 aa), pYN-L-PRX (194–1059 aa), and pYN-L-PRX (1060–1461 aa) were co-transfected with pYC-L-PRX (1–196 aa) into HeLa cells. pYN and pYC were co-transfected as the control. HeLa cells were then subjected to fluorescence analysis. Fluorescence was detected in the experimental groups co-transfected with pYN-L-PRX (1–196 aa)/pYC-L-PRX (1–196 aa) and pYN-L-PRX (1060–1461 aa)/pYC-L-PRX (1–196 aa). The detection of fluorescence revealed the direct interactions among L-PRXs (1–196 aa); this result was consistent with that of L-PRX homodimerized via its PDZ domain.16 A similar interaction was observed between L-PRX (1–196 aa) and L-PRX (1060–1461 aa) of L-PRX. However, fluorescence was nearly undetected in the control (Fig. 2A). This interaction was confirmed by GST pull-down experiments. GST-fused L-PRX (1–196 aa) effectively pulled down both L-PRX (1–196 aa) and L-PRX (1060–1461 aa) (Fig. 2B). A co-immunoprecipitation assay was also conducted to determine the interaction between L-PRX (1–196 aa) and L-PRX (1060–1461 aa). L-PRX (1–196 aa) co-immunoprecipitated with L-PRX (1060–1461 aa), whereas mouse IgG did not co-immunoprecipitate with L-PRX (1–196 aa) (Fig. 2C).3.2. NLS and acidic domains mediate L-PRX self-interaction
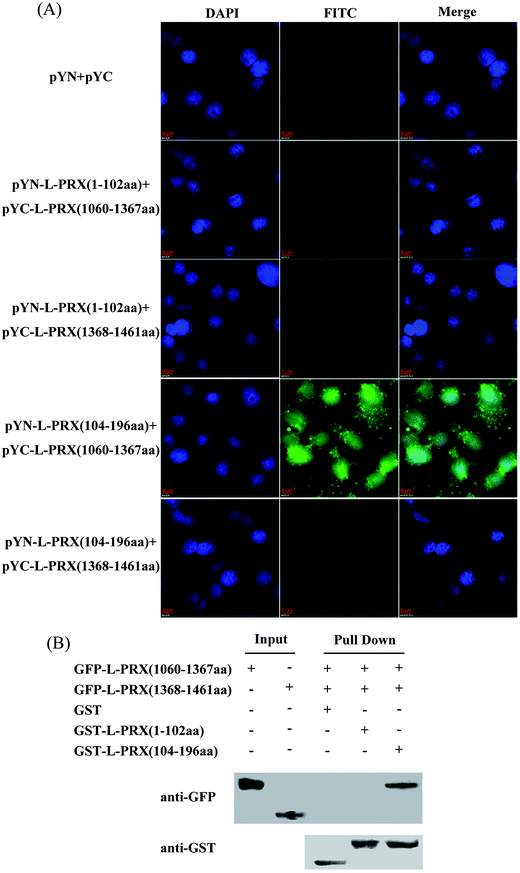
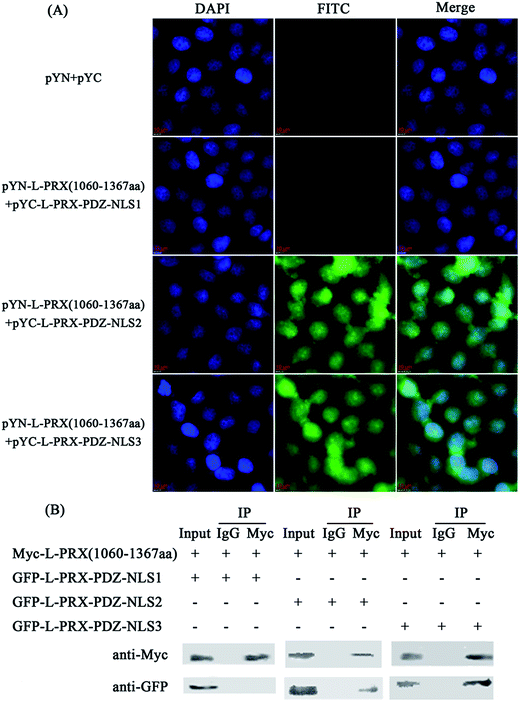
A BiFC assay was performed to further determine the self-interaction domain of L-PRX. The combinations of expression plasmids used were as follows: pYN-L-PRX (1–102 aa)/pYC-L-PRX (1060–1367 aa), pYN-L-PRX (1–102 aa)/pYC-L-PRX (1368–1461 aa), pYN-L-PRX (104–200 aa)/pYC-L-PRX (1060–1367 aa) and pYN-L-PRX (104–200 aa)/pYC-L-PRX (1368–1461 aa); these combinations were separately co-transfected into HeLa cells, in which pYN and pYC were co-transfected as the control. HeLa cells were subjected to fluorescence analysis after 24 h. Fluorescence was detected in the pYN-L-PRX (104–200 aa)/pYC-L-PRX (1060–1367 aa) combination. In contrast, the control and other combinations were not detected. This result suggests that the NLS and acidic domains mediate the self-interaction of L-PRX (Fig. 3A). As a result of GST pull-down, GFP-tagged L-PRX (1060–1367 aa) was pulled down by GST-fused L-PRX (104–200 aa) (GST was used as the control, Fig. 3B). The self-association of L-PRX involves the binding of the acidic domain to the NLS domain. The NLS domain of L-PRX is tripartite and is comprised of NLS1 (116–145 aa), NLS2 (146–176 aa), and NLS3 (177–196 aa) subdomains.14 Co-immunoprecipitation and BiFC assays were conducted to determine which subdomain mediates the interaction of the acidic and NLS domains. The results show that NLS2 and NLS3 co-immunoprecipitated with the acidic domain, whereas mouse IgG and NLS1 did not (Fig. 4A and B).3.3. L-PRX self-association is weakened by E1259K mutation of acidic domain
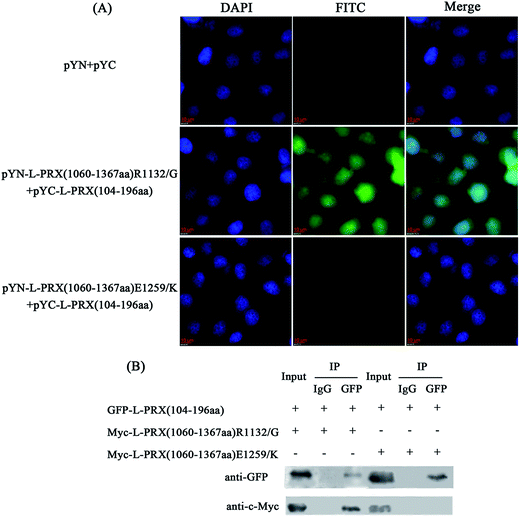
Point mutations of R1132G and E1259K in the acidic domain of L-PRX are a result of the pathogeneses of the recessive Dejerine–Sottas neuropathy.15 No study has shown the underlying mechanism of these point mutations in causing the disorder of L-PRX function. Thus, this study included the observation of the interaction between NLS and the mutant acidic domains. In the BiFC experiments, fluorescence was detected in the pYN-L-PRX (1060–1367 aa) R1132G/pYC-L-PRX (104–196 aa) group but not in the pYN-L-PRX (1060–1367 aa) E1259K/pYC-L-PRX (104–196 aa) group (Fig. 5A). In addition, the co-immunoprecipitation assays indicated that the E1259K mutant acidic domain of L-PRX did not co-immunoprecipitate with the NLS domain, whereas co-immunoprecipitation was observed on using R1132G mutant (Fig. 5B). Therefore, it could be concluded that the E1259K mutation blocks the interaction between NLS and the acidic domains, which could lead to recessive Dejerine–Sottas neuropathy.3.4. Self-association of L-PRX is inhibited, and DRP2 increases the ratio of membrane localization
The localization of L-PRX in RSC96 cells is largely influenced by the PDZ and NLS domains at its N-terminus.25,26 The study also examined the effect of L-PRX self-association on its localization in RSC96 cells. Immunofluorescence images and cytoplasmic protein extraction experiments indicated that the overexpressed L-PRX (1–196 aa) is mostly located on the RSC96 cell membranes. However, when co-overexpressed with L-PRX (1060–1461 aa), a major part of the L-PRX (1–196 aa) was localized in the cytoplasm. Meanwhile, the localization of L-PRX was within the described conditions (Fig. 6A–D). L-PRX could interact with DRP2 through its NLS domain.16,18 A competitive co-immunoprecipitation experiment was performed to examine whether DRP2 affects L-PRX self-association. The western blot results showed the remarkably weakened interaction between the NLS and acidic domains of L-PRX when protein was competitively co-immunoprecipitated with DRP2 (Fig. 7A). A BiFC experiment was also performed and flow cytometry was used to record the mean fluorescence intensity of the cells. The cells have mean fluorescence intensities of 11500.52 and 7592.69 for the group co-overexpressing YN-L-PRX (104–196 aa)/YC-L-PRX (1060–1367 aa) and the control group, respectively; these values are a result of the self-association of L-PRX (Fig. 7B). On the contrary, for the group co-overexpressing YN-L-PRX (104–196 aa), YC-L-PRX (1060–1367 aa), and Myc-tagged DRP2, the cells displayed a decreased mean fluorescence intensity of 8053.68, which was similar to that of the control group (Fig. 7B). In addition, endogenous L-PRX was mostly located in the RSC96 cell cytoplasm when the DPR2 was disturbed by RNAi (Fig. 7C and D). DRP2 was suggested to inhibit L-PRX self-association and increase the membrane localization of L-PRX.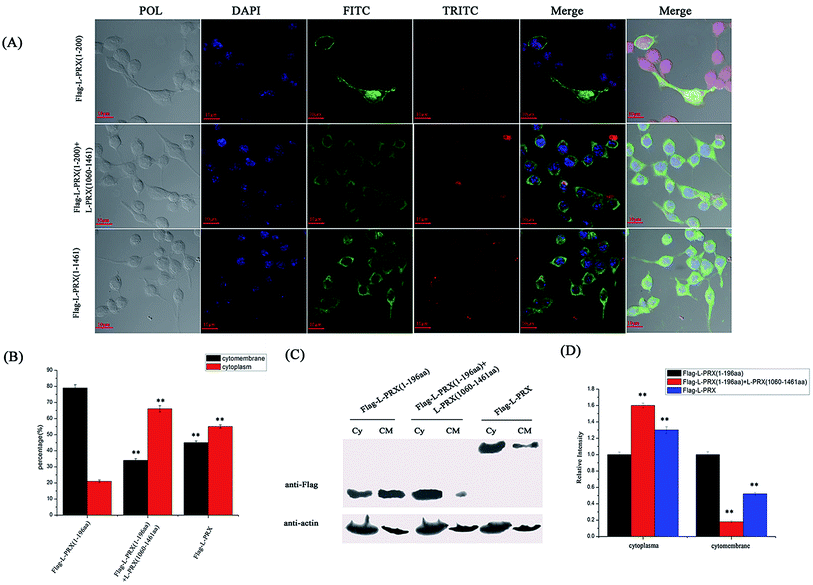 | ||
| Fig. 6 L-PRX self-association affects its localization. (A) Immunofluorescence staining was conducted to observe the effect of L-PRX self-association on the localization of the protein in RSC96 cells. The results revealed the localizations of L-PRX (1–196 aa) (in green) when solely over-expressed and co-overexpressed with L-PRX (1060–1461 aa) and the localization of L-PRX in RSC96 cells. F-actin was highlighted by phalloidin (in red). (B) Fig. 6A presents the mathematical statistics of RSC96 cells; the figure shows the successful detection of the immunofluorescence signal on the membrane or in plasma. The error bars signify the SD; three independent experiments were performed. *P < 0.05, one-way ANOVA. (C) The cytoplasm and membrane were separated; western blotting was used to determine the distribution of L-PRX (1–196 aa) protein and L-PRX in the two fractions. β-Actin served as an internal control (Cy: cytoplasm, CM: cytomembrane). (D) Quantitative analysis of the distribution of Flag fusion proteins in the two fractions normalized to the internal control level. The protein levels of solely overexpressed L-PRX (1–196 aa) were arbitrarily defined as 1.0. *P < 0.05. | ||
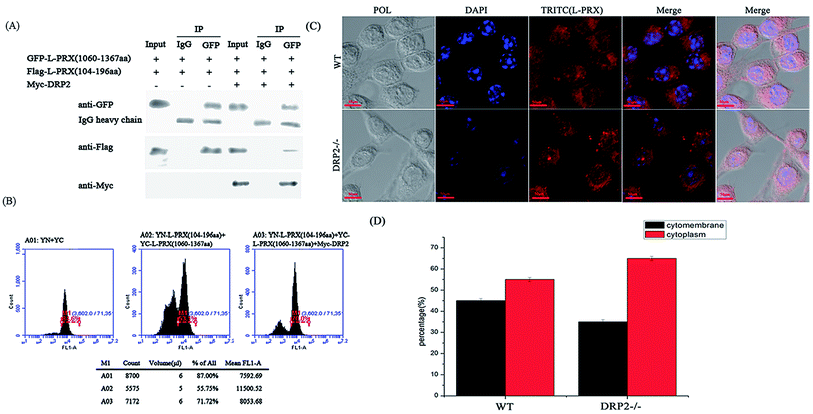 | ||
| Fig. 7 The self-association of L-PRX is inhibited by DRP2 and the RNAi of DRP2 decreases the ratio of membrane localization. (A) A competitive co-immunoprecipitation experiment was conducted to examine whether DRP2 affects L-PRX self-association. RSC96 co-transfected with pEGFP-L-PRX (1060–1367 aa) and pCMV-Tag2B-L-PRX (104–196 aa) and/or pCMV-Tag3B-DRP2. The RSC96 lysates were subjected to co-immunoprecipitation using anti-IgG or anti-GFP and analyzed by western blot analysis using anti-GFP, anti-Flag, anti-Myc and anti-IgG antibodies. One tenth of the lysate was run as the input. (B) A flow cytometer diagram was used to evaluate the effects of DRP2 on the interaction between the N- and C-terminus of L-PRX. The flow cytometer diagrams of HeLa cells transfected with pYN and pYC, pYN-L-PRX (104–196 aa), pYC-L-PRX (1060–1367 aa) and pCMV-Tag3B, pYN-L-PRX (104–196 aa), pYC-L-PRX (1060–1367 aa) and pCMV-Tag3B-DRP2. (C) Immunofluorescence staining was performed to observe the effects of DRP2 on the localization of L-PRX in RSC96 cells. The results detected the localization of endogenic L-PRX (in red) with RNAi of DRP2 in RSC96 cells. (D) Fig. 7C shows the mathematical statistics of the RSC96 cells; the immunofluorescence signal was detected on the cytomembrane or in the cytoplasm. The error bars represent the SD; three independent experiments were performed. *P < 0.05, one-way ANOVA. | ||
3.5. L-PRX self-association was disrupted, and the synthetic NLS3 peptide increased the ratio of L-PRX membrane localization
To further reveal the self-association of L-PRX in cells, mimic PRX with YFP (1–155 aa)-L-PRX (118–1367 aa)-YFP (156–239 aa) was constructed to observe the fluorescence of YFP. When intramolecular interaction occurs between the NLS and acidic domain in L-PRX, YFP, fluorescence should be exhibited or else this result could not be observed. In the BiFC experiments, the fluorescence in the pYC-L-PRX (118–1367 aa)-YN experimental group was detected but not in the cells cultured with NLS3 peptide (Fig. 8A). Immunofluorescence images, mathematical statistics and cytoplasmic protein extraction experiment indicate that the endogenesis of L-PRX is mostly located in the cytoplasm of RSC96 cells. However, when hatched with the NLS3 peptide, the endogenesis of L-PRX was mostly localized in the cytoplasmic membrane and nucleus (Fig. 8B–D). In the DRG-RSC96 co-cultured cells, as a model for in vitro myelination, the synthetic NLS3 peptide competes against the NLS2 and NLS3 of L-PRX to interact with the acidic domains, disrupt the self-association of L-PRX, and increase the ratio of membrane location of L-PRX (Fig. 8E).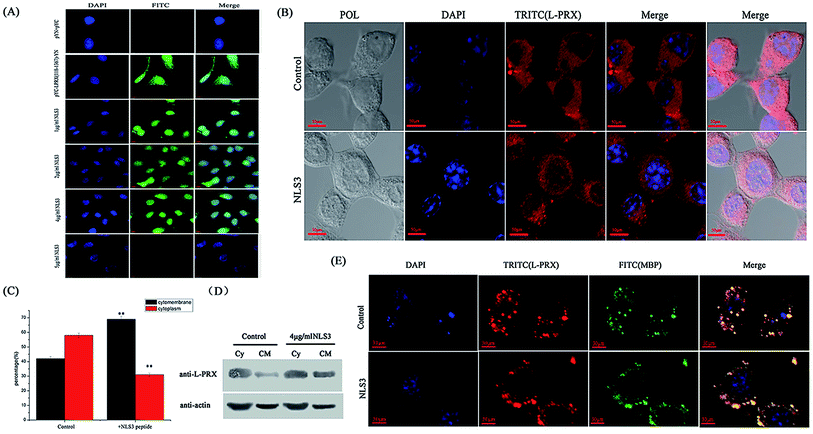 | ||
| Fig. 8 The self-association of L-PRX is inhibited and its ratio of cytomembrane localization is also increased by the NLS3 peptide. (A) BiFC assays were performed to evaluate the effects of the NLS3 peptide on the interaction between the NLS subdomains and acidic domain. HeLa cells were grown on glass coverslips and then co-expressed with YC-L-PRX (118–1367 aa)-YN; the YN/YC combination was used as the control. After transfection for 24 h, the synthetic NLS3 peptide was added to the culture cells for 6 h at 37 °C. The cells were fixed, stained with DAPI, analyzed with FITC fluorescence and viewed at 60× magnification. (B) Immunofluorescence staining was conducted to observe the effects of the NLS3 peptide on the localization of endogenous L-PRX in RSC96 cells. The observations were focused on the detection of the localization L-PRX (in red) with or without the NLS3 peptide in RSC96 cells. (C) Fig. 8B shows the mathematical statistics of RSC96 cells; the results indicate that the immunofluorescence signal was detected on the cell membrane, nucleus or plasma. The error bars represent the SD; three independent experiments were performed. *P < 0.05, one-way ANOVA. (D) The cytoplasm and membrane were separated and western blotting was used to determine the distribution of both endogenous L-PRX protein and L-PRX in RSC96 cells cultured with the NLS3 peptide. β-Actin served as the internal control (Cy: cytoplasm, CM: cytomembrane). (E) Immunofluorescence staining to observe the membrane localization of L-PRX in myelinating DRG/RSC96 cells co-cultures. The localization of L-PRX (in red) and localization of MBP (in green) were detected. | ||
4. Discussion
L-PRX is homodimerized via its PDZ domain,16 and the nuclear export of L-PRX is mediated by the nuclear export signal in its PDZ domain.25 L-PRX on the cytomembrane interacts with DRP2 through its NLS domain.16,18 The NLS domain plays a significant role in the nuclear targeting and nuclear-cytoplasmic trafficking of L-PRX.18 Thus, this study investigated the relationship among the four different domains of L-PRX. The results indicated that Schwann cells accommodate the N- and C-terminal self-interactions of L-PRX.To determine the mechanism of the N- and C-terminal interaction, the C-terminal of L-PRX was further truncated into two regions, namely, the 1060–1367 aa acidic region and 1368–1461 aa C-terminal amino acid fragment. The experiments also investigated the signal of the tripartite nuclear localization. The results indicate that L-PRX self-association is related to the binding of the acidic domain to the NLS2 and NLS3 domains rather than the “plug-in type” of the C-terminal amino acid fragment to the NLS domain. DRP2 bears significance in peripheral nerves because it contributes to the PRX-DRP2-dystroglycan (PDG) complex on the abaxonal myelin membrane.19 L-PRX also interacts with DRP2 through the NLS2 and NLS3 domains of L-PRX and spectrin-like domain 2 of DRP2.18 The NLS domain further guides the movement of the cell cytoskeleton and localization of L-PRX.18–20,24 The L-PRX localized in the nucleus and cytoplasm of the Schwann cells perinatally prior to myelination. When DRP2 appeared, the L-PRX and DRP2 co-localized at the basal surface of the myelin-forming Schwann cells.19 DRP2 is mislocalized in the absence of PRX;16 similarly, PRX in DRP2-null Schwann cells did not concentrate in patches known to co-localize with PDG.27 The stop mutation of DRP2 was detected in CMT patients; however, the mechanism leading to CMT at the protein level is still unidentified.28 Self-association influenced the localization of L-PRX and it was remarkably weakened by DRP2 and the synthetic NLS3 peptide, which are suggested to inhibit L-PRX self-association. DRP2 bound to the NLS domain of L-PRX blocks the L-PRX self-association, and is hypothesized to be a possible functional regulation of DRP2 and/or L-PRX. Thus, without DRP2, L-PRX could not release its NLS and acidic domain to bind to the cytoskeleton or interact with the proteins essential for the transmission of cellular signals; this phenomenon possibly causes CMT development through the mutation of DRP2.28 Free NLS3 peptide could release the NLS and acidic domains of L-PRX to interact with these partners in the membrane.
The deletion and substitution mutation of the acidic domain establishes loss-of-function mutations in PRX, causing CMT disease.15,22,23 The self-interaction in L-PRX is blocked by the E1259K mutation in the acidic domain. The amino acid E1259 could be directly involved in the interaction between the NLS and acidic domain; its mutation results in structural L-PRX damage, which possibly causes the E1259K mutation, leading to recessive Dejerine–Sottas neuropathy.
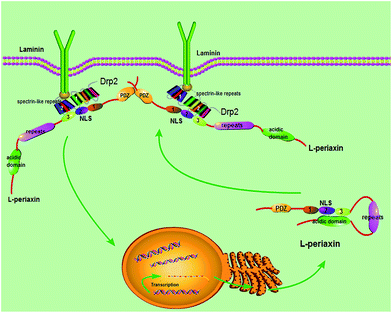
Based on the gathered data, the following model (Fig. 9) is proposed. L-PRX forms a head-to-tail self-association conformation between its NLS2 and NLS3 domains and the acidic domain to prevent itself from binding to other ligands when it is synthesized and located in the cytoplasm. The self-association conformation of L-PRX masks the nuclear localization signal by the acidic domain. Once DRP2 or the other ligands are bound to NLS2 and NLS3 of L-PRX, the self-association conformation of L-PRX would be disrupted and the linear L-PRX would be transfered to the cytomembrane by DRP2 or other proteins. In the cytomembrane, L-PRX docks on the N-terminus of DRP2 through its NLS2 and NLS3 subdomains, and homodimerizes via its PDZ domain and serves as a scaffold in the DRP2/dystroglycan complex that transduce signals to regulate myelination in the Schwann cell plasma membrane.16
5. Conclusion
L-PRX is capable of self-association, which involves the binding of the acidic domain to the NLS2 and NLS3 domains. The self-association affects the localization of L-PRX in RSC96 cells. Moreover, DRP2 remarkably weakens the self-association of L-PRX. This report could provide new insight into the regulation of the L-PRX function.Author contributions
Shi Yawei and Yang Yenan designed the study and wrote the paper. Liang Min and Yang Yenan designed and constructed the vectors for the bimolecular fluorescence complementation and protein interactions. All authors analyzed the results and approved the final version of the manuscript.Conflicts of interest
There are no conflicts of interest to declare.Abbreviations
| CMT4F | Charcot–Marie–Tooth type 4 F |
| CMT | Charcot–Marie–Tooth |
| PRX | Periaxin |
| NLS | Nuclear localization signal |
| DRP2 | Dystroglycan-dystrophin-related protein 2 |
| PDZ | Postsynaptic density protein (PSD-95), drosophila discs large tumour suppressor gene (dlg) and the tight junction-associated protein Zo-1 |
| L-periaxin | Large isoform of periaxin |
| S-periaxin | Small isoform of periaxin |
| PAGE | Polyacrylamide gel electrophoresis |
| DMEM | Dulbecco's modified Eagle's medium |
| PBS | Phosphate buffer saline |
| GST | Glutathione S-transferase |
| NC | Nitrocellulose |
| GFP | Green fluorescent protein |
| HRP | Horseradish peroxidase |
| YFP | Yellow fluorescent protein |
| DAPI | 4,6-Diamidino-2-phenylindole |
| FITC | Fluorescein isothiocyanate |
| BIFC | Biomolecular fluorescence complementation |
| PDG | Periaxin-DRP2-dystroglycan |
Acknowledgements
We thank the Scientific Instrument Center of Shanxi University and Miss Wang Juanjuan for their assistance with confocal microscopy. This study was supported by the Natural Science Foundation of China (Grant No. 31170748) and the Natural Science Foundation of Shanxi province (Grant No. 201701D121085).References
- S. S. Scherer, Y. T. Xu, P. Bannerman, D. L. Sherman and P. J. Brophy, Development, 1995, 121, 4265–4273 CAS.
- L. M. Wu, A. Williams, A. Delaney, D. L. Sherman and P. J. Brophy, Curr. Biol., 2012, 22, 1957–1961 CrossRef CAS PubMed.
- J. Patzig, O. Jahn, S. Tenzer, S. P. Wichert, P. de Monasterio-Schrader, S. Rosfa, J. Kuharev, K. Yan, I. Bormuth, J. Bremer, A. Aguzzi, F. Orfaniotou, D. Hesse, M. H. Schwab, W. Mobius, K. A. Nave and H. B. Werner, J. Neurosci., 2011, 31, 16369–16386 CrossRef CAS PubMed.
- M. Grandis, T. Vigo, M. Passalacqua, M. Jain, S. Scazzola, V. La Padula, M. Brucal, F. Benvenuto, L. Nobbio, A. Cadoni, G. L. Mancardi, J. Kamholz, M. E. Shy and A. Schenone, Hum. Mol. Genet., 2008, 17, 1877–1889 CrossRef CAS PubMed.
- G. S. Smith, B. Samborska, S. P. Hawley, J. M. Klaiman, T. E. Gillis, N. Jones, J. M. Boggs and G. Harauz, J. Neurosci. Res., 2013, 91, 349–362 CrossRef CAS PubMed.
- P. Berger, K. Tersar, K. Ballmer-Hofer and U. Suter, J. Cell. Mol. Med., 2011, 15, 307–315 CrossRef CAS PubMed.
- A. Nualart-Marti, C. Solsona and R. D. Fields, Biochim. Biophys. Acta, 2013, 1828, 69–78 CrossRef CAS PubMed.
- R. H. Quarles, J. Neurochem., 2007, 100, 1431–1448 CAS.
- R. Maddala, N. P. Skiba, R. R. Lalane, D. L. Sherman, P. J. Brophy and P. V. Rao, Dev. Biol., 2011, 357, 179–190 CrossRef CAS PubMed.
- Z. Wang, J. Han, L. L. David and K. L. Schey, Invest. Ophthalmol. Visual Sci., 2013, 54, 1135–1143 CAS.
- S. Song, A. Landsbury, R. Dahm, Y. Liu, Q. Zhang and R. A. Quinlan, J. Clin. Invest., 2009, 119, 1837–1848 CrossRef CAS PubMed.
- L. Dytrych, D. L. Sherman, C. S. Gillespie and P. J. Brophy, J. Biol. Chem., 1998, 273, 5794–5800 CrossRef CAS PubMed.
- H. J. Lee and J. J. Zheng, Cell Commun. Signaling, 2010, 8, 8 CrossRef PubMed.
- D. L. Sherman and P. J. Brophy, J. Biol. Chem., 2000, 275, 4537–4540 CrossRef CAS PubMed.
- C. F. Boerkoel, H. Takashima, P. Stankiewicz, C. A. Garcia, S. M. Leber, L. Rhee-Morris and J. R. Lupski, Am. J. Hum. Genet., 2001, 68, 325–333 CrossRef CAS PubMed.
- D. L. Sherman, C. Fabrizi, C. S. Gillespie and P. J. Brophy, Neuron, 2001, 30, 677–687 CrossRef CAS PubMed.
- H. Han and P. Kursula, J. Biol. Chem., 2014, 289, 14121–14131 CrossRef CAS PubMed.
- Y. Yang and Y. Shi, RSC Adv., 2015, 5, 84356–84366 RSC.
- L. Wrabetz and M. L. Feltri, Neuron, 2001, 30, 642–644 CrossRef CAS PubMed.
- F. A. Court, J. E. Hewitt, K. Davies, B. L. Patton, A. Uncini, L. Wrabetz and M. L. Feltri, J. Neurosci., 2009, 29, 3908–3919 CrossRef CAS PubMed.
- L. R. Peddareddygari, I. Sobol, H. B. Pillai, M. Ito, S. D. Batish and R. P. Grewal, Journal of Neurology Research, 2012, 2, 235–243 Search PubMed.
- L. Barankova, D. Siskova, K. Huhne, E. Vyhnalkova, I. Sakmaryova, M. Bojar, B. Rautenstrauss and P. Seeman, Eur. J. Neurol., 2008, 15, 548–551 CrossRef CAS PubMed.
- K. Kijima, C. Numakura, E. Shirahata, Y. Sawaishi, M. Shimohata, S. Igarashi, T. Tanaka and K. Hayasaka, J. Hum. Genet., 2004, 49, 376–379 CrossRef PubMed.
- T. K. Kerppola, Annu. Rev. Biophys., 2008, 37, 465–487 CrossRef CAS PubMed.
- Y. Shi, L. Zhang and T. Yang, PLoS One, 2014, 9, e91953 Search PubMed.
- Y. Yang and Y. Shi, Neurosci. Lett., 2015, 609, 23–29 CrossRef CAS PubMed.
- D. L. Sherman, L. M. Wu, M. Grove, C. S. Gillespie and P. J. Brophy, J. Neurosci., 2012, 32, 9419–9428 CrossRef CAS PubMed.
- K. M. Brennan, Y. Bai, C. Pisciotta, S. Wang, S. M. Feely, M. Hoegger, L. Gutmann, S. A. Moore, M. Gonzalez, D. L. Sherman, P. J. Brophy, S. Zuchner and M. E. Shy, Neuromuscular Disord., 2015, 25, 786–793 CrossRef PubMed.
Footnote |
| † These authors contributed equally to this study. |
| This journal is © The Royal Society of Chemistry 2017 |

