DOI:
10.1039/C7RA06800J
(Paper)
RSC Adv., 2017,
7, 36433-36443
Excellent microwave absorption properties by tuned electromagnetic parameters in polyaniline-coated Ba0.9La0.1Fe11.9Ni0.1O19/reduced graphene oxide nanocomposites
Received
19th June 2017
, Accepted 9th July 2017
First published on 21st July 2017
Abstract
Ba0.9La0.1Fe11.9Ni0.1O19 nanoparticles were prepared by a co-precipitation method, and Ba0.9La0.1Fe11.9Ni0.1O19/reduced graphene oxide/polyaniline ternary nanocomposites (BF/RGO/PANI) were prepared by in situ polymerization. Microwave reflection loss, and the permittivity and permeability of BF/RGO/PANI nanocomposites were investigated in the frequency range 2–18 GHz. The prepared samples possessed excellent electromagnetic wave-absorbing performances, and the optimal impedance matching of BF/RGO/PANI nanocomposites was found. The minimum reflection loss reached −49.1 dB near the frequency of 14.08 GHz with a thickness of 1.9 mm and its absorption bandwidth with a reflection loss below −10 dB ranged from 12.4–16.72 GHz with a bandwidth of 4.32 GHz. Our study illustrates that the as-prepared BF/RGO/PANI nanocomposites are promising candidates for use in electromagnetic wave-absorbing materials.
1. Introduction
The rapid development of modern electronic equipment brings many benefits, but has also led to a new kind of pollution known as electromagnetic interference (EMI). EMI has greatly threatened the health of human beings and has disrupted both commercial and industrial equipment.1–3 In order to address EMI, it is necessary to investigate materials with excellent microwave absorption as a matter of urgency. Microwave absorbing materials can absorb electromagnetic waves and convert electromagnetic energy into other types of energy or dissipate the electromagnetic wave.4 An ideal microwave absorption material should be lightweight and thin, with strong absorption and a wide absorption bandwidth.5 It is well-known that electromagnetic wave absorption properties are controlled by the relative complex permittivity and permeability of absorbing materials.6,7 The balance of permittivity and permeability, known as electromagnetic wave impedance matching, is instrumental in improving microwave attenuation. Microwave absorbing materials can be classified into two kinds: dielectric materials and magnetic materials. The conjugation of dielectric materials and magnetic materials could be an effective way to obtain excellent impedance matching, which is expected to achieve excellent microwave absorption.
Magnetic materials, especially ferrites, are a suitable choice for microwave absorption operation due to their strong magnetic losses within the GHz frequency range.8 However, negligible dielectric loss seriously limits the application of these materials. Modification of the dielectric and magnetic properties of M-type ferrites by substitution of the Fe3+ ions for cations such as La3+, Nd3+, Pr3+, and Dy3+ can improve the microwave absorption properties of these materials.9–15 Although the microwave absorption properties of barium ferrites can be significantly improved by doping with different alkaline earth metal, the high density of barium ferrite restricts their wider use as microwave absorbers.16 To overcome this problem, dielectric loss fillers such as conducting polymers, carbon nanotubes, and graphene are always added to the system in order to achieve higher microwave absorption properties and broaden the frequency band.
Graphene, a flat monolayer of carbon atoms tightly packed into a two dimensional (2D) honeycomb lattice, not only possesses a unique structure but also exhibits a high specific surface area, superior electrical conductivity, and extraordinary mechanical properties.17–19 These excellent properties make graphene a very promising candidate for use as electromagnetic shields to absorb incident electromagnetic waves.4 Thus, graphene is highly desirable as an electromagnetic wave absorber due to its high dielectric loss and low density. However, single-component graphene exhibits predominantly dielectric loss and very low magnetic loss due to weak magnetic properties, which leads to a weak electromagnetic impedance matching and limitations on its potential applications. Recently, combining graphene with magnetic materials has been considered an effective method to enhance microwave absorption performance by combining the advantages of graphene and magnetic components. For example, Verma et al. investigated the electromagnetic properties of BaFe12O19/reduced graphene oxide (RGO) nanocomposites and reported a maximum shielding effectiveness of 32 dB at a critical thickness of 3 mm.3 Hu et al. fabricated three-dimensional (3D) Fe3O4-graphene nanocomposites of which the minimum reflection loss was −27 dB with a thickness of 4 mm and the absorption bandwidths with a reflection loss below −10 dB ranged from 6.5 to 10.3 GHz.20
Although the combination of graphene and ferrite can improve microwave absorption properties, the mismatch of dielectric loss and magnetic loss of graphene and magnetic components restricts its further application. Polyaniline (PANI) is one of the most promising conducting polymers due to its excellent physical and chemical properties, low cost, controllable electromagnetic parameters, and high conductivity at microwave frequencies.21 Because of the adjustable permittivity of PANI, the composites of PANI and magnetic materials/graphene can improve electromagnetic wave impedance matching and absorption properties, as in the case of graphene/CFA/PANI nanocomposites prepared by Bhattacharya et al., where CFA is a hexagonal shaped magnetic M-type hexaferrite, CuFe10Al2O19. The prepared nanocomposites showed outstanding microwave absorption properties, and the minimum reflection loss was −63.6 dB at a thickness of 2.5 mm with a broad absorption range.22
Herein, we report the preparation of Ba0.9La0.1Fe11.9Ni0.1O19/RGO/PANI nanocomposites and present a detailed investigation of their electromagnetic parameters and microwave absorption properties. The results demonstrate that the relative complementarity between the dielectric loss and magnetic loss and the synergetic effect can enhance microwave absorption properties through a tuned electromagnetic performance. Significantly, Ba0.9La0.1Fe11.9Ni0.1O19/RGO/PANI nanocomposites show promise as potential microwave absorber materials.
2. Experimental
2.1 Materials
Graphite powder (flake graphite, grade 325) was purchased from Pilot Chemical Corporation (Shanghai, China). Other chemical reagents and solvents were purchased from the Sinopharm Chemical Reagent Co., Ltd., China. All chemicals were used as-received without further purification.
2.2 Preparation of Ba0.9La0.1Fe11.9Ni0.1O19 nanoparticles
Ba0.9La0.1Fe11.9Ni0.1O19 nanoparticles (BF) were synthesized by the chemical co-precipitation method. A stoichiometric amount of the chloride compounds of Ba, Fe, La, and Ni, with chemical compositions of Ba(NO3)2, Fe(NO3)3·9H2O, La(NO3)3, and Ni(NO3)2, were dissolved in deionized water to form a homogeneous solution. After complete dissolution, NaOH solution (1 mol L−1) was added to adjust the pH to 10, and the mixture was continuously stirred for 6 h. The resulting precipitate was obtained by filtration, and washed with distilled water and ethanol to remove residues, then dried at 60 °C in vacuo for 24 h. These products were calcined at 950 °C for 2 h to obtain the Ba0.9La0.1Fe11.9Ni0.1O19 nanoparticles.
2.3 Preparation of binary BF/RGO nanocomposites
Graphene oxide (GO) was synthesis from natural graphite powder using a modified Hummers' method.17 The as-prepared BF and GO were dispersed in 60 mL of deionized water with sonication and mechanical stirring for 2 h, respectively. Next, hydrazine was added to the mixture with constant stirring at 95 °C for 12 h. The resulting precipitate was centrifugally washed using deionized water and absolute ethanol, and dried at 60 °C in vacuo for 12 h.
2.4 Preparation of ternary BF/RGO/PANI nanocomposites
The BF/RGO/PANI composite powders were synthesized via an in situ polymerization method. The detailed process is described below. First, a certain quantity of aniline and the as-prepared BF/RGO composite powders were put into 200 mL of 1 M HCl solution and stirred for 1 h to form a well-dispersed suspension, while simultaneously cooled to 5 °C with stirring. Next, a certain amount of ammonium persulfate (APS) was dissolved in 20 mL 1 M HCl solution and then added slowly to initiate the polymerization. The molar ratio of APS to aniline was 1![[thin space (1/6-em)]](https://www.rsc.org/images/entities/char_2009.gif) :1. The polymerization was carried out in an ice-water bath for 12 h with mechanical stirring. After polymerization, the entire solution was filtered, washed several times with deionized water and ethanol, and then dried at 60 °C in vacuo for 24 h. The samples with weight ratios of BF/RGO to aniline of 1:1, 1:2, 1:3, and 1:4 were denoted as BF/RGO/PANI-1, BF/RGO/PANI-2, and BF/RGO/PANI-3, respectively.
:1. The polymerization was carried out in an ice-water bath for 12 h with mechanical stirring. After polymerization, the entire solution was filtered, washed several times with deionized water and ethanol, and then dried at 60 °C in vacuo for 24 h. The samples with weight ratios of BF/RGO to aniline of 1:1, 1:2, 1:3, and 1:4 were denoted as BF/RGO/PANI-1, BF/RGO/PANI-2, and BF/RGO/PANI-3, respectively.
2.5 Characterization
The resulting powder was characterized by X-ray powder diffraction (XRD) using a diffractometer (RIGAKU, model D/max) with Cu Kα radiation of wavelength λ = 1.5418 Å. Its morphology was studied using a transmission electron microscope (TEM; JEOL, model JEM 2001). Fourier transform infrared spectroscopy (FTIR) for the prepared samples was carried out using an infrared spectrophotometer (NICOLET, model NEXUS 670) in the range from 4000 to 400 cm−1. A thermogravimetric analyzer (TGA; Mettler Toledo TGA/SDTA 851e) was used to measure the thermal stability of the composite under an inert atmosphere in the temperature range 30–800 °C at a heating rate of 10 °C min−1. Raman spectra were measured using a Laser Raman spectrometer (Thermo Fisher, model DXR) at a 663 nm wavelength incident laser light. Magnetization measurements were taken at room temperature (293 K) using a vibrating sample magnetometer (LDJ, model 9600-1). In addition, electromagnetic parameters (complex permittivity and complex permeability) were assessed using a vector network analyzer (VNA, Anritsu 37269D) in the range 2–18 GHz.
3. Results and discussion
3.1 Morphological and structural characterization
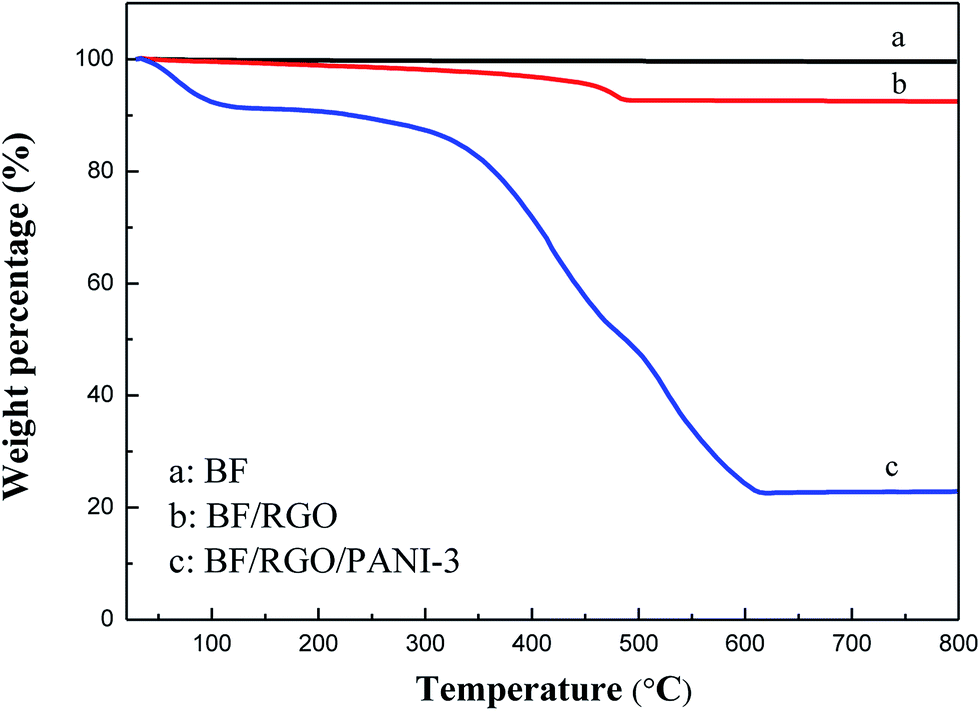
The thermogravimetric curves of BF, BF/RGO, and BF/RGO/PANI nanocomposites in an air atmosphere are shown in Fig. 1. For BF, no mass loss was observed over the entire temperature range. This suggests that BF has an exceptionally high thermal stability.3 For BF/RGO, it can be seen that the BF/RGO nanocomposites undergo a slight weight loss at a temperature of 30–400 °C and an abrupt weight loss at a temperature of 400–500 °C, which is attributed to the decomposition of the residual oxygen-containing group and the oxidation of RGO, respectively. The residue consists of BF particles and the mass fraction of BF is approximately 90%, suggesting that the RGO is completely combusted. For the BF/RGO/PANI-3 nanocomposites, two significant steps for mass loss are observed with increasing temperature, and the maximum weight loss occurs in the second step. The first weight loss at a temperature of 30–300 °C is attributed to the oxidation of RGO. The second weight loss appears at a temperature of 300–600 °C, and is attributed to the decomposition of PANI. BF/RGO/PANI-3 nanocomposites exhibit a weight loss of about 77.5% at 800 °C. According to the mass loss theory, we draw the conclusion that the weight percentage of BF, RGO, and PANI in the composites is approximately 22.5%, 2.5%, and 75%. This result is consistent with the experimental observations.
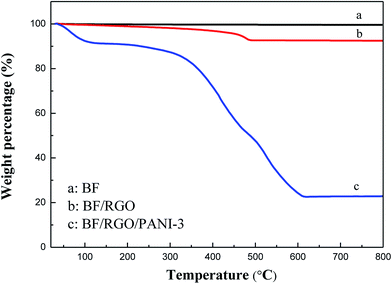 |
| | Fig. 1 Thermogravimetric curves of (a) BF, (b) BF/RGO and (c) BF/RGO/PANI-3 nanocomposites. | |
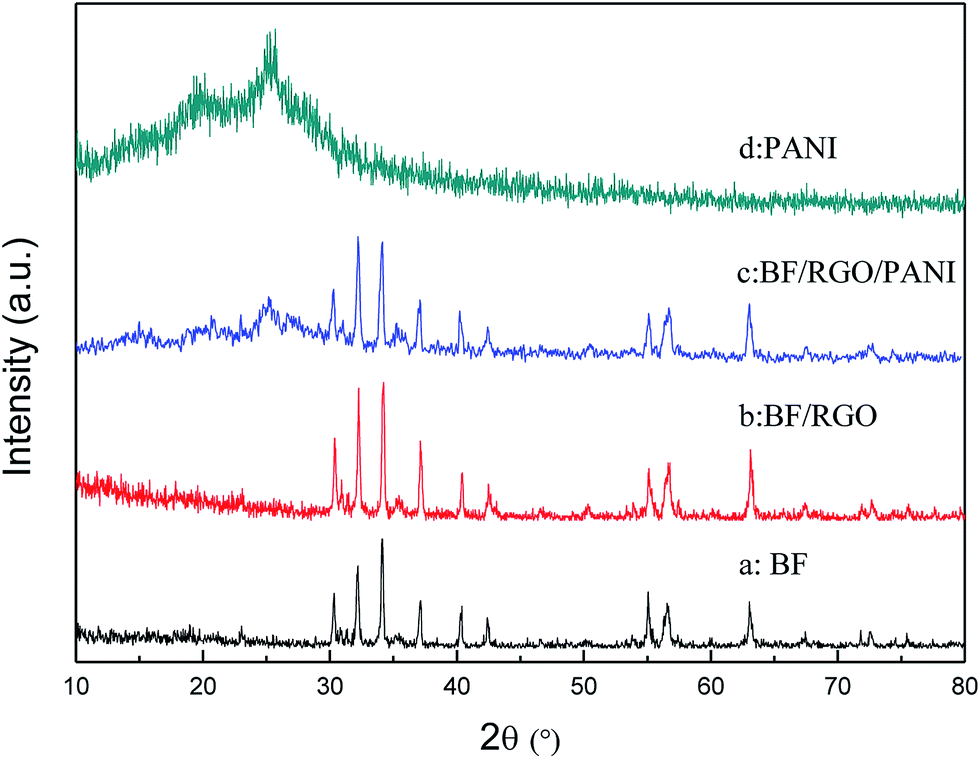
The XRD patterns of the BF, BF/RGO, and BF/RGO/PANI nanocomposites are shown in Fig. 2. It can be seen that the series of sharp diffraction peaks at 30.22°, 32.14°, 34.06°, 37.04°, 40.36°, and 42.45° can readily be assigned in Fig. 2a, and can be clearly indexed to the (100), (008), (107), (114), (008), (200), and (201) crystal planes of M-type hexaferrite barium ferrite.3 All observed peaks of BF have been well matched with the standard XRD pattern (PDF card no. 33-1340). It is clear that the diffraction peaks of BF are also clearly observed in the XRD patterns of the BF/RGO and BF/RGO/PANI nanocomposites. However, the characteristic peak of RGO at 2θ = 24° due to the (002) plane was not observed in Fig. 2b, which may be ascribed to the relatively weak diffraction intensity in the BF/RGO nanocomposites. This finding is in agreement with previous work.23 For pure PANI, the crystalline peaks centered at 20.9° and 25.1° are assigned to the (020) and (200) reflection of PANI.21 The XRD patterns of the BF/RGO/PANI nanocomposites exhibit similar crystal peaks compared with PANI except for characteristic peaks of BF, revealing that the BF/RGO/PANI nanocomposites have been fabricated.
 |
| | Fig. 2 XRD patterns of (a) BF, (b) BF/RGO, (c) BF/RGO/PANI nanocomposites and (d) PANI. | |
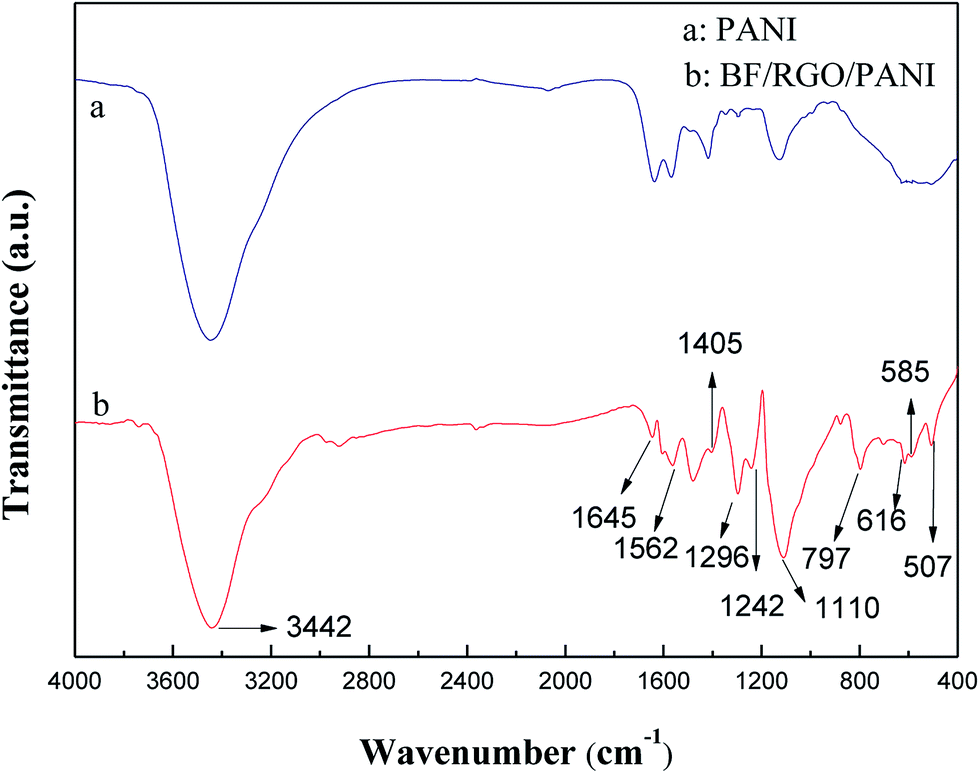
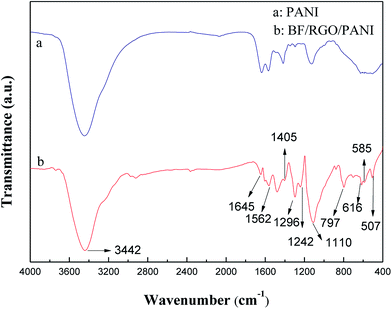
Fig. 3 shows the FTIR spectra of PANI and BF/RGO/PANI nanocomposites. The characteristic absorption peaks of oxygen-containing functional groups on the GO are not observed in the FTIR spectrum of BF/RGO/PANI nanocomposites, indicating that the chemical reduction is relatively complete. The FTIR spectrum of BF shows characteristic peaks at 507 cm−1, 585 cm−1, and 616 cm−1, which are due to Fe–O and Ba–O bond stretching, confirming that BF particles are formed in the composites.24 In the FTIR spectrum of BF/RGO/PANI nanocomposites, the characteristic peaks at 1562 cm−1 and 1645 cm−1 are ascribed to the C![[double bond, length as m-dash]](https://www.rsc.org/images/entities/char_e001.gif) N and CC stretching of the quinonoid and benzenoid rings, respectively.25 The characteristic peak at 1405 cm−1 corresponds to the stretching mode of N–Q–N, where Q represents the benzenoid ring. The peaks at 1242 cm−1 and 1296 cm−1 are attributed to N–H bending and C–N stretching for the benzenoid ring, the peak at 1110 cm−1 is attributed to the aromatic C–H in-plane bending mode and the peak at 797 cm−1 is associated with the C–H of the benzenoid unit.26 Therefore, from the FTIR analysis we can deduce the successful formation of the prepared nanocomposites.
N and CC stretching of the quinonoid and benzenoid rings, respectively.25 The characteristic peak at 1405 cm−1 corresponds to the stretching mode of N–Q–N, where Q represents the benzenoid ring. The peaks at 1242 cm−1 and 1296 cm−1 are attributed to N–H bending and C–N stretching for the benzenoid ring, the peak at 1110 cm−1 is attributed to the aromatic C–H in-plane bending mode and the peak at 797 cm−1 is associated with the C–H of the benzenoid unit.26 Therefore, from the FTIR analysis we can deduce the successful formation of the prepared nanocomposites.
 |
| | Fig. 3 FT-IR spectra of PANI and BF/RGO/PANI nanocomposites. | |
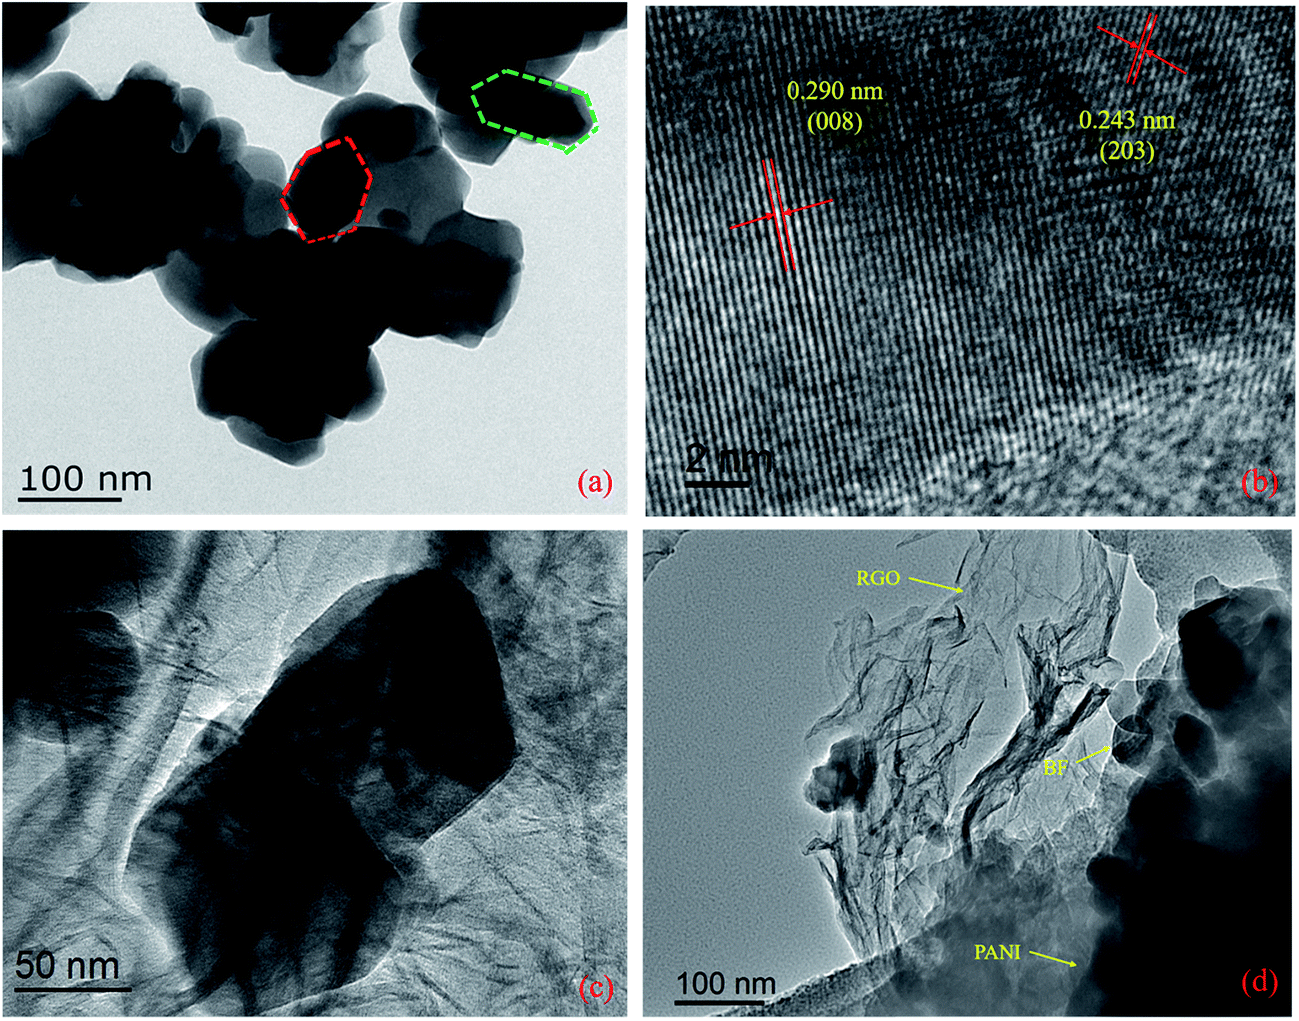
To be further sure of the formation of these materials, we produced TEM and high-resolution TEM (HRTEM) images of the prepared samples, as shown in Fig. 4. It can clearly be seen in Fig. 4a that the BF nanoparticles are highly agglomerated, with an average particle size in the range 50–100 nm. Meanwhile, the hexagonal structure of the BF nanoparticles is again demonstrated in Fig. 4a. The HRTEM image (Fig. 4b) shows the corresponding lattice fringes of the BF nanoparticles. The lattice fringes with a lattice spacing of 0.243 nm and 0.290 nm correspond to the (203) and (008) crystal planes of BF nanoparticles. The TEM image of BF/RGO nanocomposites shown in Fig. 4c clearly shows that the RGO sheets are diaphanous and crumpled. It also can be observed that the BF nanoparticles are firmly attached to the graphene sheets of RGO. Fig. 4d helps us understand more about the coating of PANI on the BF/RGO composites. The TEM image of the BF/RGO/PANI nanocomposites is presented in Fig. 4d, and shows that the surface of the BF/RGO nanocomposites is uniformly coated by PANI molecular chains. The presence of the BF, RGO sheets, and PANI is shown by the red single-headed arrows in the images.
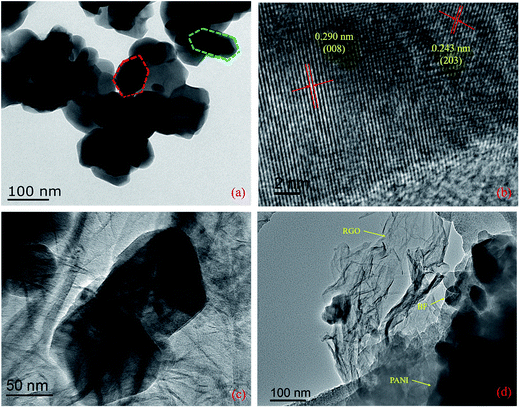 |
| | Fig. 4 TEM and HRTEM images of (a and b) Ba0.9La0.1Fe11.9Ni0.1O19 nanoparticles, TEM images of (c) BF/RGO and (d) BF/RGO/PANI nanocomposites. | |
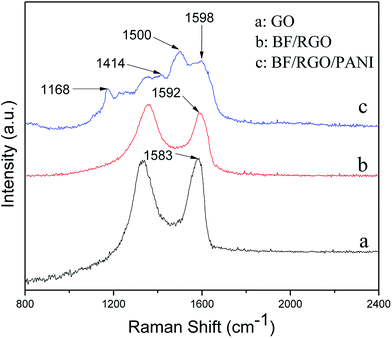
Fig. 5 shows the Raman spectra of GO, BF/RGO nanocomposites, and BF/RGO/PANI nanocomposites. The characteristic features in the Raman spectrum of GO are the so-called D band, which is located at around 1332 cm−1, corresponding to the breathing mode of k-point phonons of A1g, and the G band at 1583 cm−1 which is attributed to the tangential stretching mode of the E2g phonons of the sp2 atoms.27 The characteristic D and G peaks of RGO are present in the Raman spectra of BF/RGO nanocomposites. The G band of BF/RGO is slightly shifted as compared with GO, and appears at 1592 cm−1. As reported, we also suggest that the shifting of the G band indicates a charge transfer between BF and RGO.22 The intensity ratio of the D and G band is an important parameter to measure the degree of graphitization present in a material. The ID/IG ratio of GO is 0.976, whereas the ratio increases to 1.047 for the BF/RGO composites. This increase in ID/IG ratio indicates that more defects have been introduced on RGO with the incorporation of BF nanoparticles.28 The Raman spectra of BF/RGO/PANI nanocomposites are shown in Fig. 5c. Apart from the D and G bands, the peaks at 1168, 1414, and 1500 cm−1 are assigned to the C–H stretching vibration of the quinoid/phenyl group, the C–N stretching vibration of the benzenoid ring, and the semiquinone radical cation structure of PANI, respectively. The broadening of the G band for the BF/RGO/PANI nanocomposites may be due to the coating of amorphous PANI on BF/RGO.3 In Fig. 5c, it can be seen that the G band of BF/RGO/PANI nanocomposites show a slight shift compared with the BF/RGO nanocomposites, indicating the presence of charge transfer among RGO, SF, and PANI. This is consistent with previous reports.22
 |
| | Fig. 5 Raman spectra of (a) GO, (b) BF/RGO nanocomposites, and (c) BF/RGO/PANI nanocomposites. | |
3.2 Magnetic properties
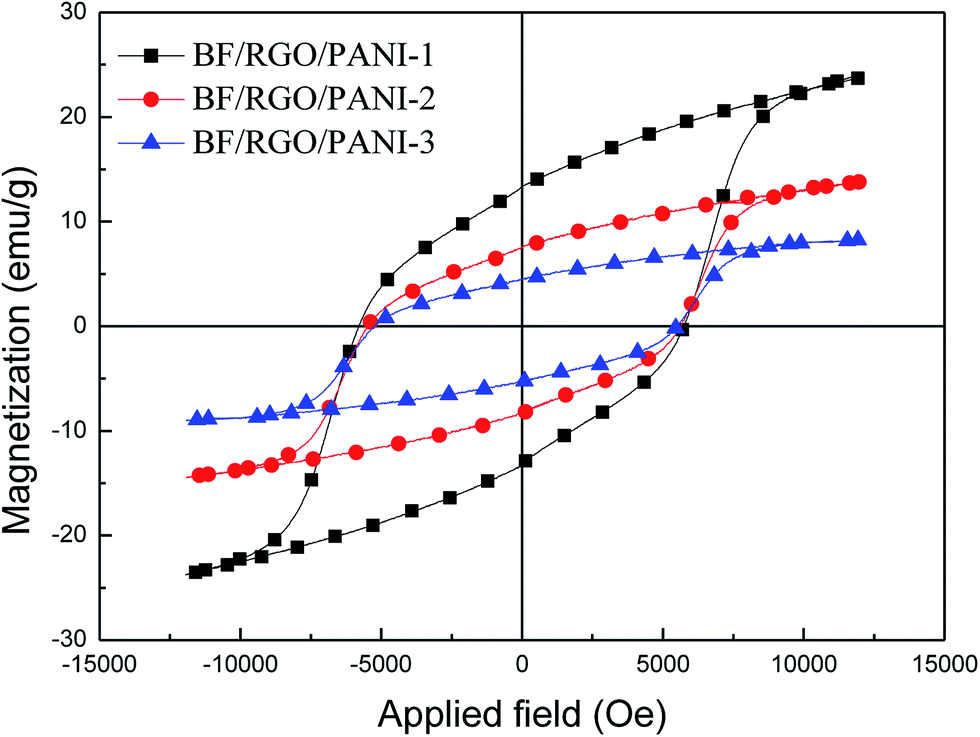
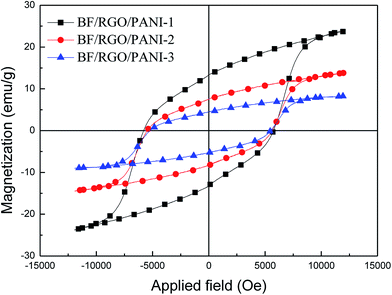
In order to study the magnetic properties of the as-obtained samples, magnetization measurements were carried out and the resulting hysteresis plot is shown in Fig. 6 and Table 1. It can be seen that the saturation and remanent magnetization fall dramatically with increases in the nonmagnetic RGO and PANI. This is because the magnetic properties of the composites are determined by the volume fraction of the magnetic particles present in the composites, as shown in the following formula:29where Ms is the saturation magnetization of composites, ψ is the volume fraction of the magnetic particles present in the composites, and ms is the saturation magnetization of a single magnetic particle. Therefore, the saturation magnetization of BF/RGO/PANI nanocomposites decreases with increase in nonmagnetic materials. In addition, the coercivity of BF/RGO/PANI nanocomposites declines slightly compared with pure barium ferrite, and also decreases slightly with increasing PANI content, gradually showing the magnetic characteristics of paramagnetism. This is consistent with previous work.
 |
| | Fig. 6 The magnetization hysteresis loops of BF/RGO/PANI nanocomposites with different adding amount of PANI. | |
Table 1 Magnetic parameters of the as-prepared samples
| Sample no. |
Ms (emu g−1) |
Hc (Oe) |
Mr (emu g−1) |
| BF/RGO/PANI-1 |
23.95 |
5739 |
13.25 |
| BF/RGO/PANI-2 |
13.87 |
5622 |
7.57 |
| BF/RGO/PANI-3 |
8.41 |
5513 |
4.63 |
3.3 Microwave absorption performance
The real permittivity (ε′) and imaginary permittivity (ε′′) of BF/RGO/PANI nanocomposites with different ratios are shown in Fig. 7. In Fig. 7, it can be seen that the ε′ and ε′′ values of BF/RGO/PANI nanocomposites with different ratios decreased with an increase in frequency and increased with an increase in the PANI content. Both the ε′ and ε′′ values of nanocomposites with different ratios increased gradually from 8.23 to 14.76 and 3.02 to 10.48, respectively. The reasons for the complex permittivity in the real and imaginary parts varying with frequency may be attributed to the following two points: (1) with an increase in the frequency of the external reverse electric field, the induction charge phase behind the external electric field results in electromagnetic oscillation, and the values of ε′ and ε′′ decrease with increasing frequency; (2) the difference in dielectric constants and electrical conductivities among the components of the composites is beneficial for the generation of space-charge polarization. The as-prepared samples differ in their dielectric constants and electrical conductivities. Thus, the amount of space-charge polarization and hence the permittivity values of the prepared nanocomposites also differ. The space-charge polarization decreases with increasing frequency, which results in the decreasing trend of ε′ and ε′′ with the increasing frequency.22
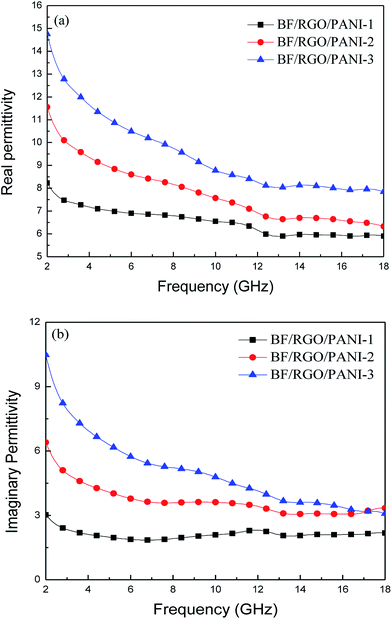 |
| | Fig. 7 The real permittivity (a) and imaginary permittivity (b) of BF/RGO/PANI nanocomposites as a function of frequency over 2–18 GHz. | |
According to the Debye theory, the ε′′ stands for the loss capability of electromagnetic energy. The dielectric loss consists of both polarization loss and conduction loss, clarified by the following equation:30
| |
 | (2) |
| |
 | (3) |
where
εs is the static dielectric constant,
ε∞ is the relative dielectric constant at the high-frequency limit,
ω is the angular frequency,
σ is the electrical conductivity, and
τ is the polarization relaxation time, which has a connection with frequency and temperature. The surface defects of RGO may emerge after chemical reduction, while the increased polarization caused by the surface defects enhances the dielectric loss. On the contrary, RGO builds more conductive paths in the composites for electron transport, which makes a significant contribution to dielectric loss.
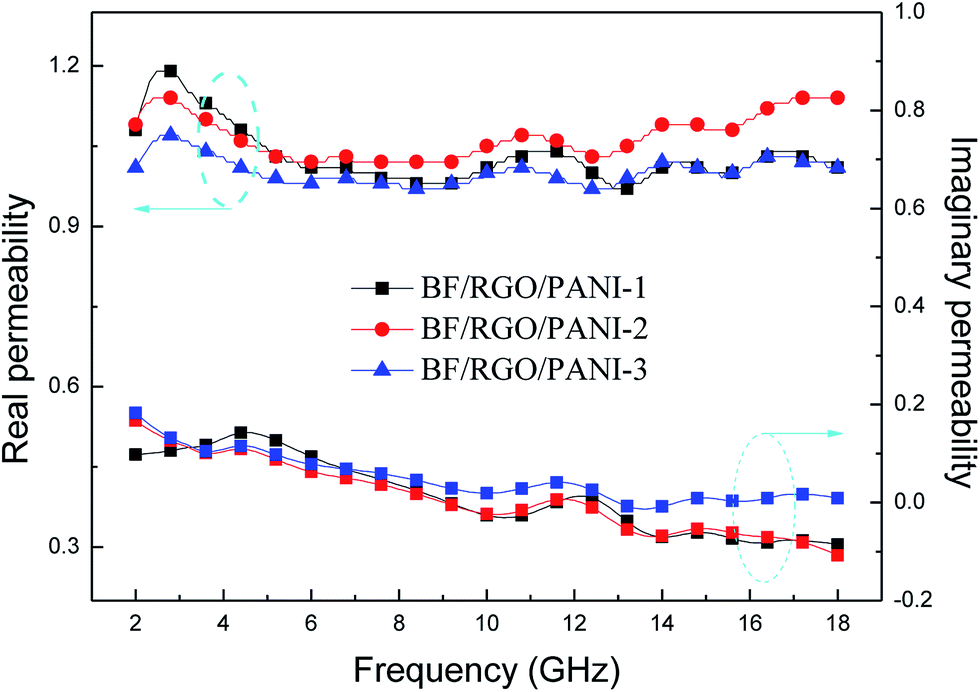
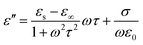
Fig. 8 shows the real permeability (μ′) and imaginary permeability (μ′′) of BF/RGO/PANI nanocomposites with different ratios, investigated in the frequency range 2–18 GHz; μ′ varies in the range 0.95–1.23. The μ′′ exhibits a slightly decreasing trend with increasing frequency. Meanwhile, there are four resonance peaks in μ′′ at ∼4.4 GHz, ∼11.6 GHz, ∼14.8 GHz, and ∼17.1 GHz, respectively.
 |
| | Fig. 8 The complex permeability of BF/RGO/PANI nanocomposites with different components as a function of frequency over 2–18 GHz. | |
According to the Debye equation, the Cole–Cole equation can be inferred as:31
| |
 | (4) |
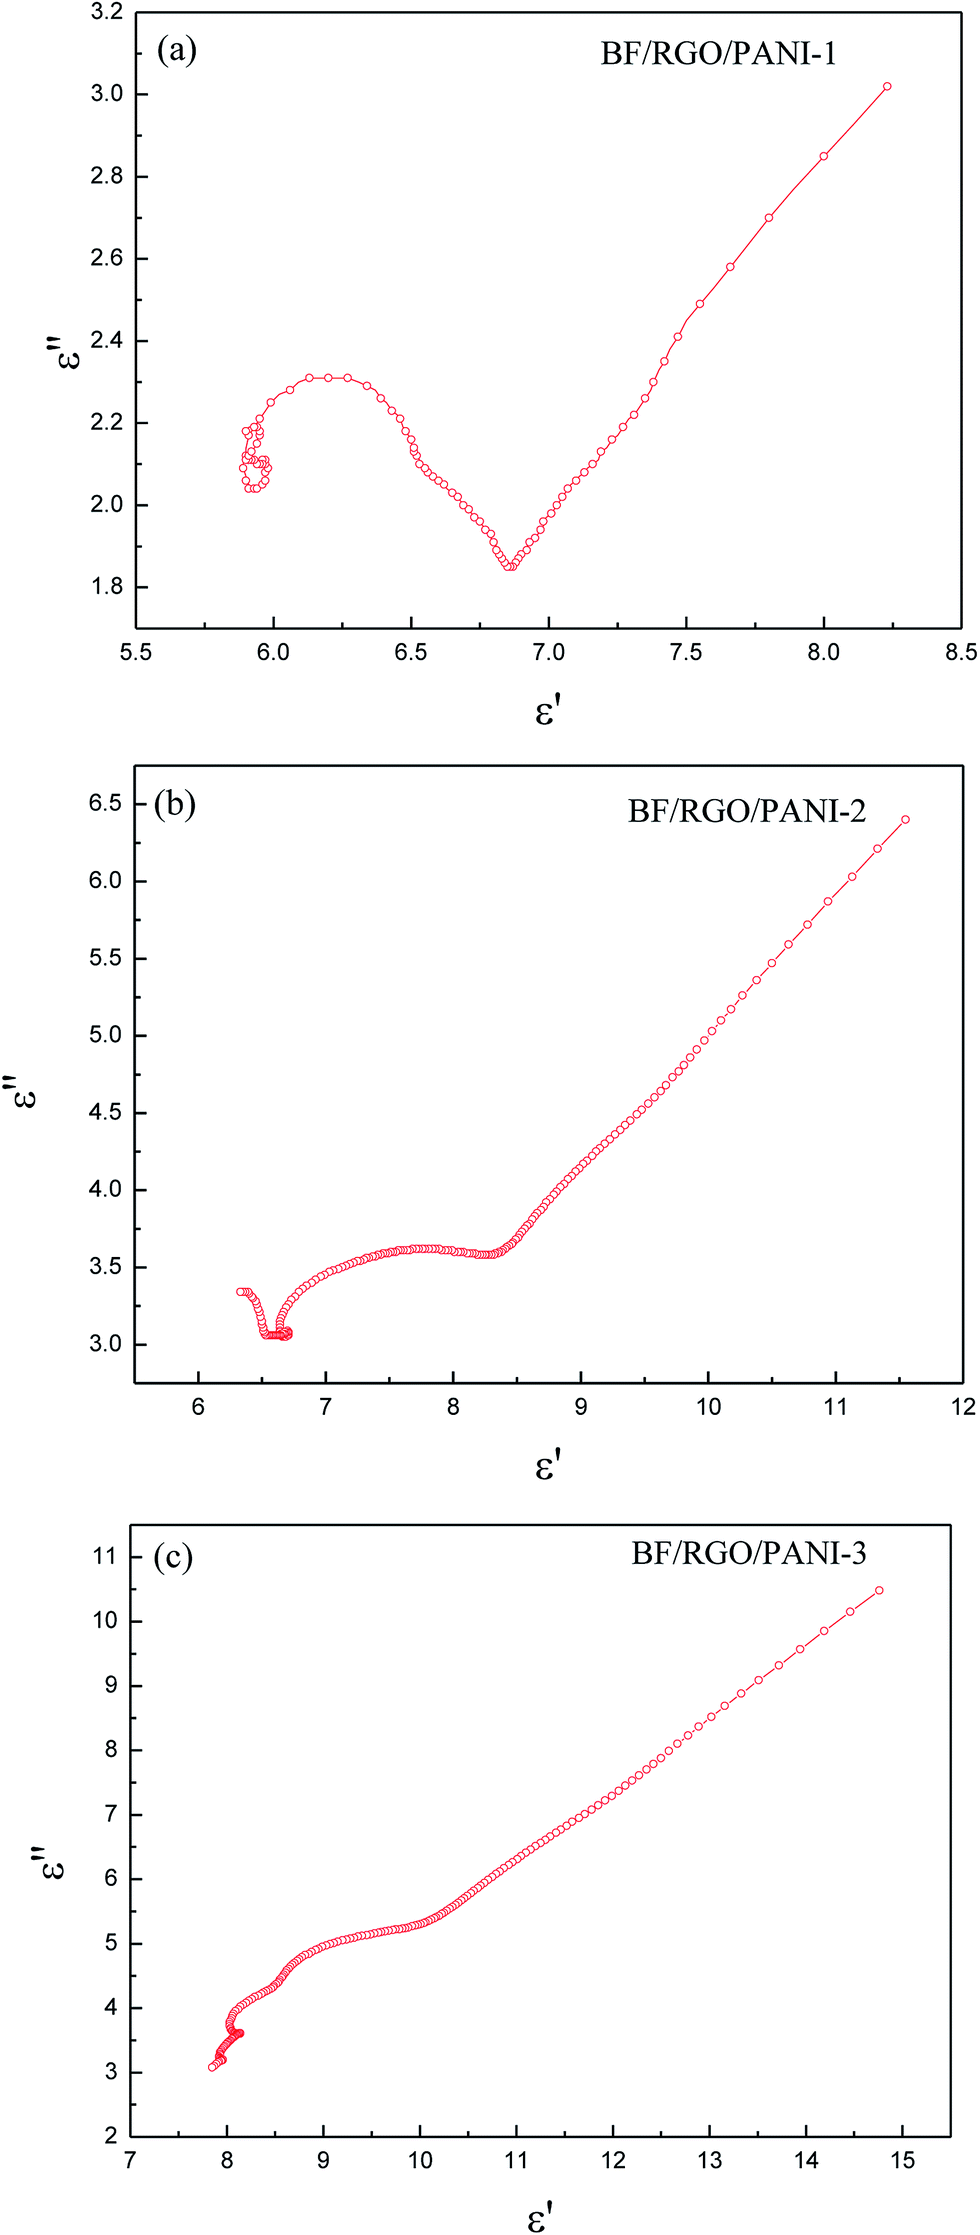
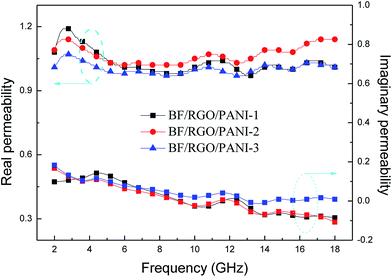
The Cole–Cole plots demonstrate the response characteristics of the samples in the frequency range 2–18 GHz. Because the relaxation time is constantly changing and the equation of the Debye progress of relaxation time is a fixed value, so the Cole–Cole curve for most dielectric materials does not conform to the Debye equation, which means the shape of the final curve is an arc instead of a standard semicircle. Fig. 9 shows the curve of ε′ versus ε′′ for BF/RGO/PANI nanocomposites with different ratios in the frequency ranges, where both large and small Cole–Cole curves were found. These Cole–Cole curves demonstrate that the composites have multi-dielectric relaxation processes, which can effectively enhance the microwave absorption. From the Cole–Cole curves, one semicircle corresponds to one Debye relaxation process and multiple relaxation will cause greater microwave attenuation.
 |
| | Fig. 9 The Cole–Cole plots of BF/RGO/PANI nanocomposites with different components. | |
Additionally, the magnetism induced by the BF nanoparticles will result in magnetic loss. In general, the magnetic loss of magnetic materials originates from hysteresis loss, domain-wall resonance, the eddy current effect, and natural resonance.32 The hysteresis loss of barium ferrite in BF/RGO/PANI nanocomposites can be ignored in the frequency range 2–18 GHz, while the domain-wall resonance of barium ferrite usually occurs at a lower frequency than the GHz range. Therefore, contributions to magnetic loss from hysteresis loss and domain-wall resonance can be excluded from our synthesized composites.27 For the ferrite absorber, the microwave absorption properties are usually subject to degradation caused by an eddy current effect in the high-frequency region. The eddy current loss can be expressed by:33
| |
 | (5) |
where
σ and
μ0 are the electric conductivity and the permeability
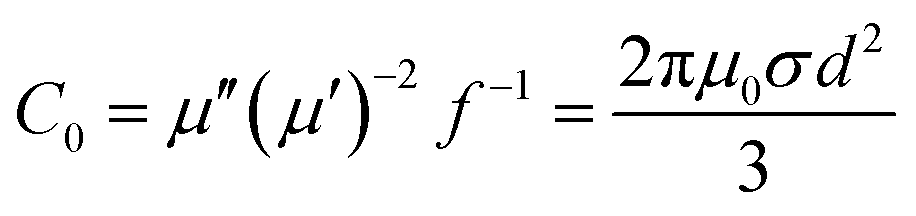
in vacuo, respectively. Thus,
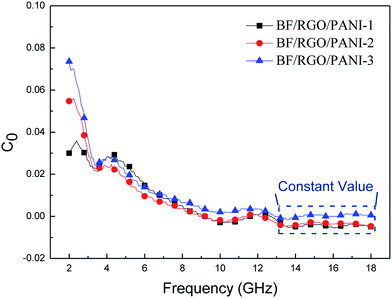
C0 can be described by:
| |
 | (6) |
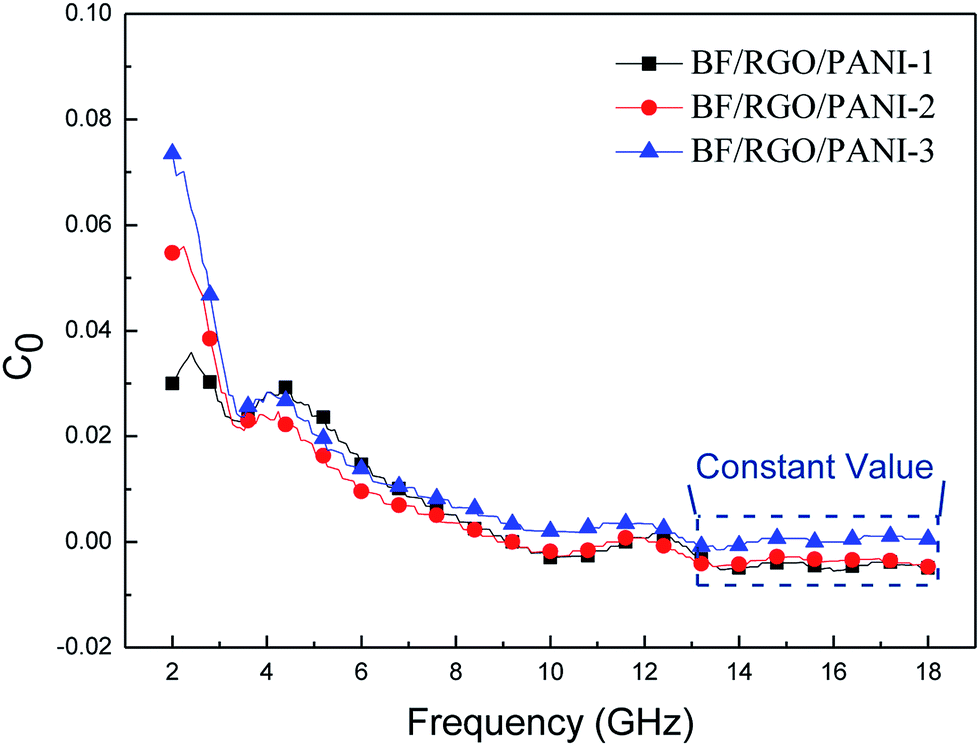
If the magnetic loss results from an eddy current loss, the values of C0 are constant when the frequency is varied. Fig. 10 shows the C0–f curves of BF/RGO/PANI nanocomposites with different ratios. As shown in Fig. 10, the values of C0 drastically decrease at the frequency range from 2.0 to 13.0 GHz. However, when f > 13.0 GHz, C0 remains approximately constant. Therefore, we can conclude that the magnetic loss of BF/RGO/PANI nanocomposites with different ratios, with a frequency of 4.4 GHz and 11.6 GHz, is caused by the natural resonance, and its magnetic losses at frequencies of 14.8 GHz and 17.1 GHz are caused by the eddy current loss.34
 |
| | Fig. 10 The C0–f values of BF/RGO/PANI nanocomposites with different components. | |
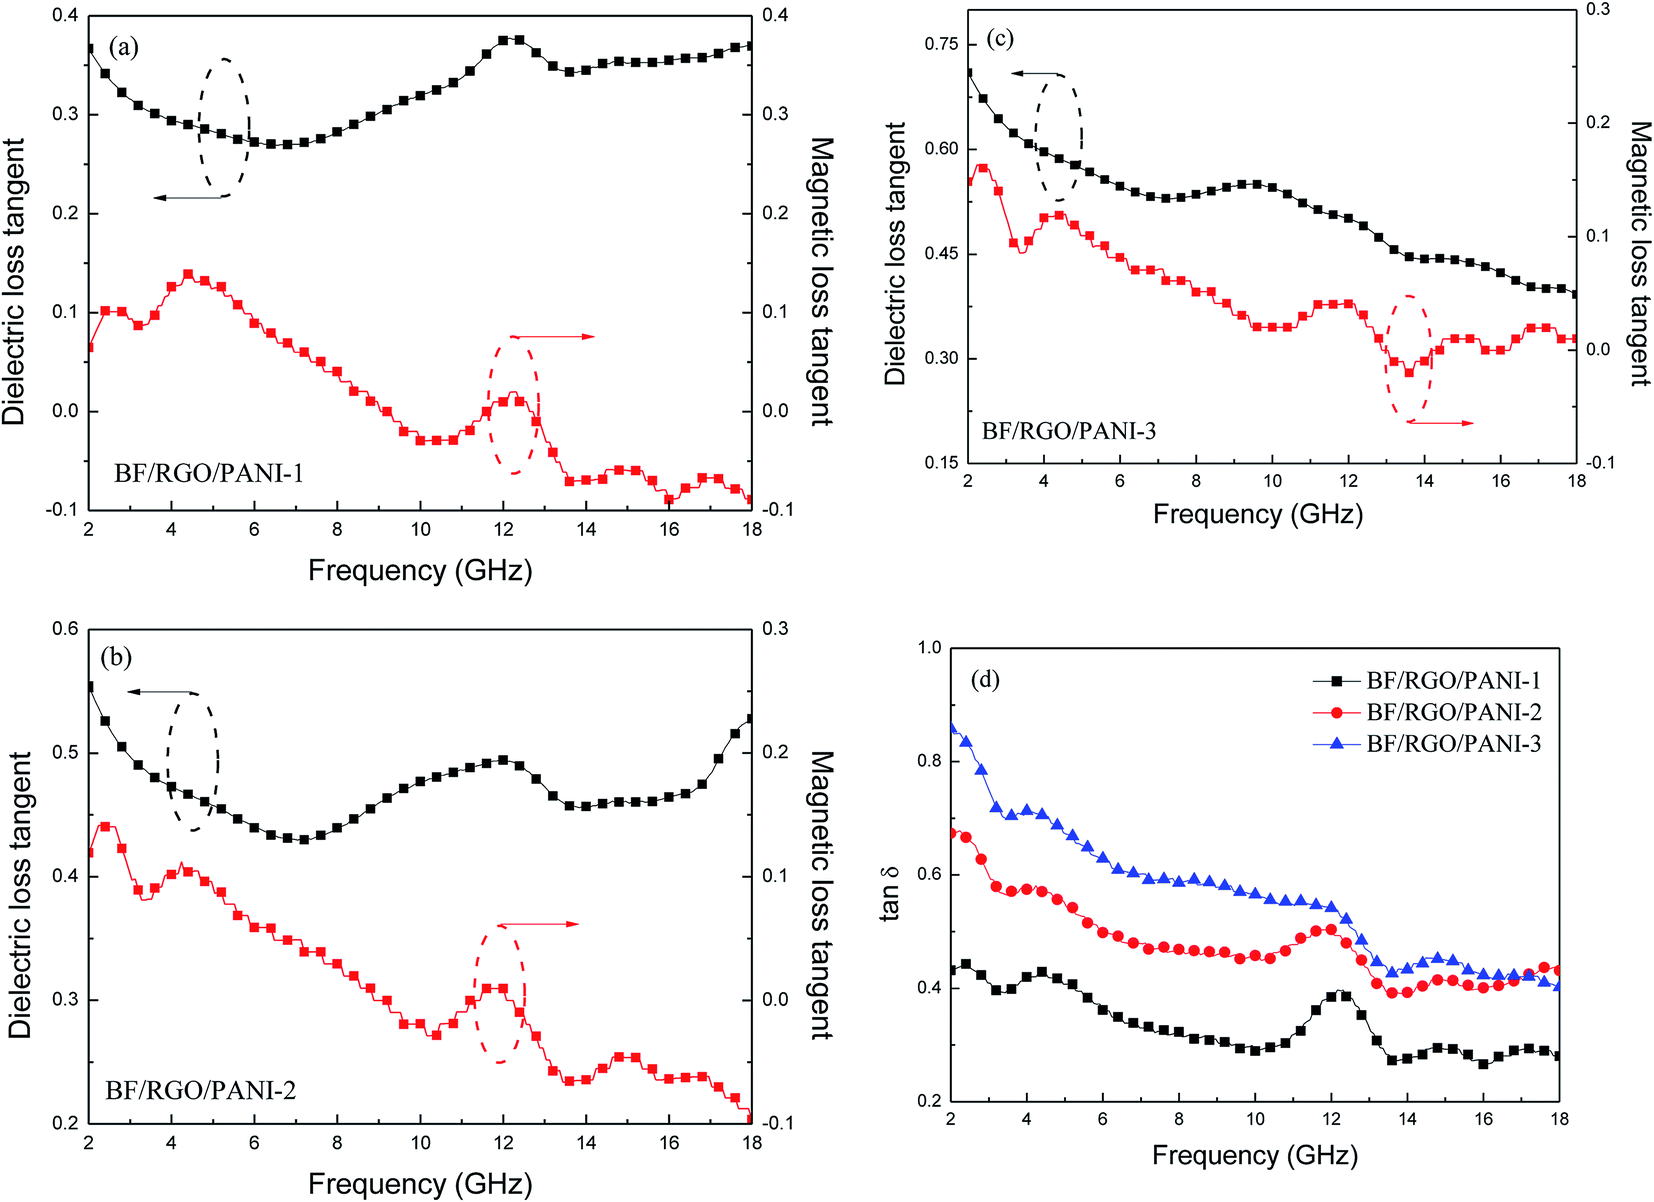
The absorption mechanism is analyzed by the following two factors. First, the electromagnetic loss characteristic can be ascribed to both dielectric loss and magnetic loss. The dielectric loss (tanδe) and magnetic loss (δm) and loss tangents (tanδ) of BF/RGO/PANI nanocomposites are presented in Fig. 11. Almost all the tanδe, tanδm, and tanδ display a decreasing trend with increasing frequency, and the tanδe and tanδ show an increasing trend when the amount of PANI is increased. Clearly, the increase of tanδ of BF/RGO/PANI nanocomposites means enhancement of electromagnetic loss.
 |
| | Fig. 11 Frequency dependence of the tanδe, tanδm and tanδ of BF/RGO/PANI nanocomposites with different components (a–d). | |
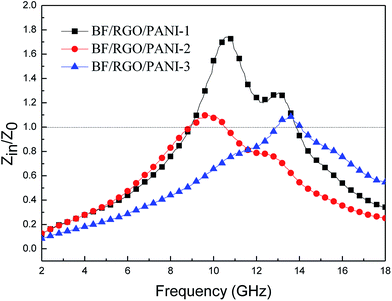
Second, the impedance matching characteristic is another important factor in terms of the microwave absorption properties of the absorbing materials. Appropriate impedance matching can enhance the microwave absorption properties of materials, and the input impedance can be expressed as:34
| |
 | (7) |
where
Γ is the interface reflection coefficient,
Zin is the input impedance of contact interface of free space and material, and
Z0 is the intrinsic impedance of free space. For the nonreflecting condition
Zin =
Z0 (
Γ = 0), which indicates that the value of the relative input impedance |
Zin/
Z0| is nearer to 1, the impedance matching characteristic of material is improved. In this study,
Zin can be expressed as:
| |
 | (8) |
where
f0 is the frequency,
d is the absorbing layer thickness,
c is the velocity of an electromagnetic wave
in vacuo,
εr is the complex permittivity, and
μr is the complex permeability. From
Fig. 12, we can see that the impedance matching characteristic of BF/RGO/PANI nanocomposites gradually transforms from out of balance to balance, and the relative input impedance of BF/RGO/PANI-3 nanocomposites is the closest to 1. This demonstrates that the electromagnetic wave can more easily enter the BF/RGO/PANI-3 nanocomposites.
 |
| | Fig. 12 Relative input impedance of BF/RGO/PANI nanocomposites with different components. | |
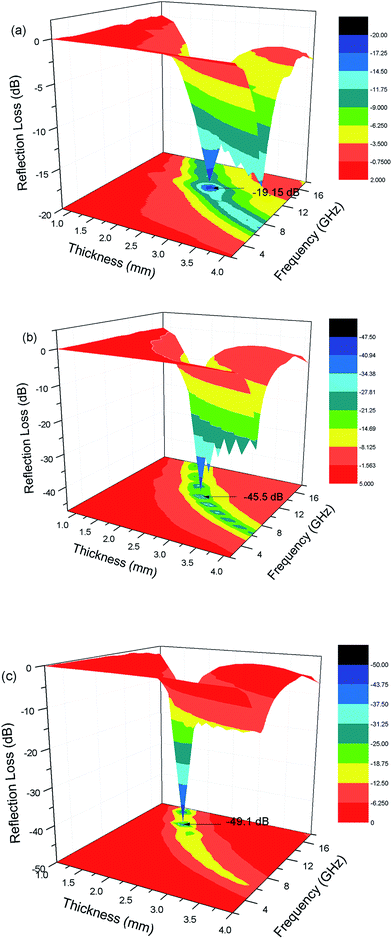
According to the transmission line theory, the reflection loss (RL) curves can be calculated from the relative complex permeability and permittivity with a given frequency range and a given absorber thickness (d) by the following equation:27
| |
 | (9) |
In eqn (9), Zin is the input impedance of the absorber, Z0 is the impedance of free space, μr and εr are the relative complex permeability and permittivity, f is the frequency of electromagnetic wave, d is the thickness of the absorber, and c is the velocity of light in vacuo. The RL value of −10 dB is comparable to 90% microwave absorption. Therefore, materials with RL values of less than −10 dB absorption are considered to be suitable electromagnetic wave absorbers.
The reflection loss of the samples with different components and thicknesses versus frequency are shown in Fig. 13. In Fig. 13a, it can be seen that the minimum reflection loss of BF/RGO/PANI-1 was −19.1 dB at a frequency of 12.16 GHz with a thickness of 2.6 mm, and the reflection loss was below −10 dB at 10.7–13.7 GHz with a bandwidth of 3 GHz. In Fig. 13b, the minimum reflection loss of BF/RGO/PANI-2 was −45.5 dB at 10.56 GHz with a thickness of 2.6 mm, and the reflection loss was below −10 dB at 9.05–13.35 GHz with a bandwidth of 4.3 GHz. Fig. 13c demonstrates that the minimum reflection loss of BF/RGO/PANI-3 reached −49.1 dB near the frequency of 14.08 GHz with a thickness of 1.9 mm, and the reflection loss was below −10 dB at 12.4–16.72 GHz with a bandwidth of 4.32 GHz. Compared with BaFe12O19/RGO, the as-prepared samples possess better microwave absorption properties.35 According to the following formula: fm = c(2πμ′′d)−1, where fm is the frequency of the minimum reflection loss peak and d is the matching thickness, it is clear that the matching thickness for absorbing properties of nanocomposites has a regulatory role and reflection loss peaks move to low frequency with increasing matching thickness.36,37 Therefore, it can be seen in Fig. 11 that all peaks of the samples shift to the lower frequency as the thickness of the absorber increases. This type of change is beneficial, because the frequency range of absorption can be adjusted according to the requirements by altering the thickness of the material.
 |
| | Fig. 13 The calculated reflection loss curves of (a) BF/RGO/PANI-1, (b) BF/RGO/PANI-2 and (c) BF/RGO/PANI-3. | |
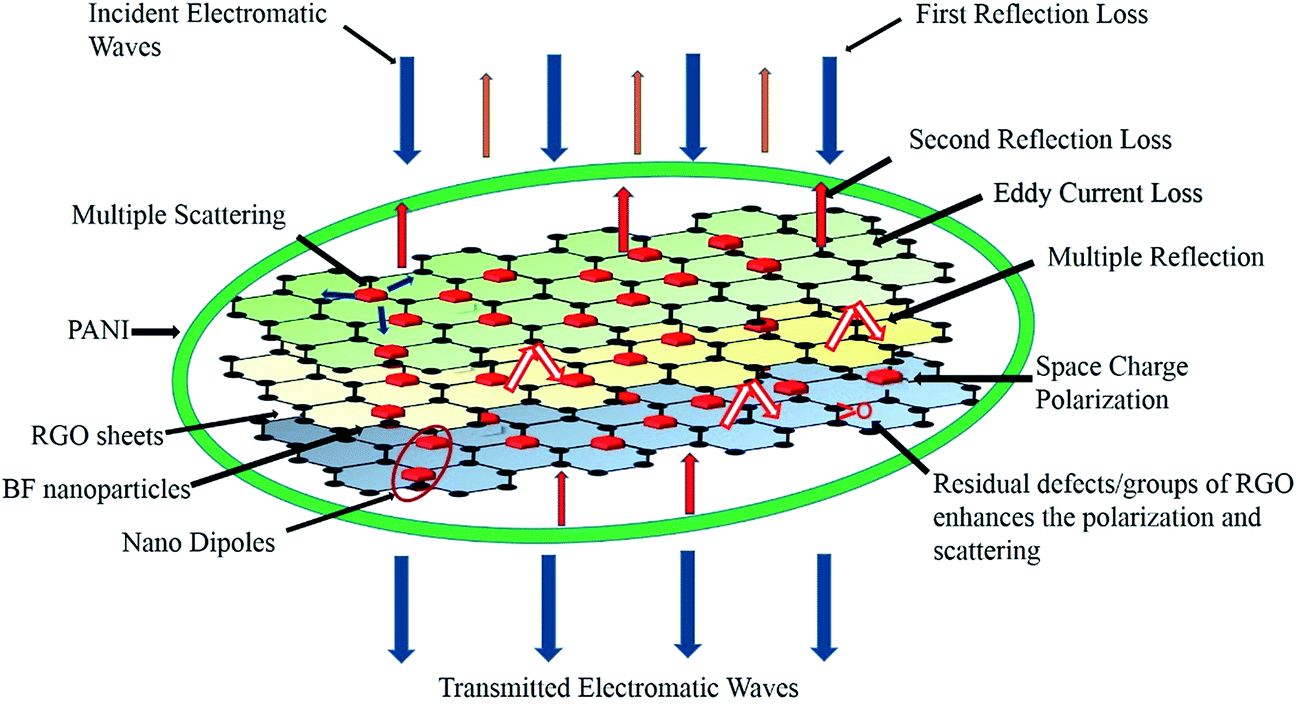
The performance of a microwave absorber depends predominantly upon two factors: the energy consumption and matching characteristics.27 The increase of energy consumption of BF/RGO/PANI nanocomposites increased with an increase in PANI content. Moreover, the RGO sheets with a large specific surface area and high aspect ratio can form a complete conductive network for dispersing charges. Furthermore, the existence of residual defects/groups in RGO sheets and multiple reflections can enhance the microwave absorption ability of the composites.38 Second, the BF nanoparticles decorated on the surface of RGO have high dispersion, which can enhance magnetic loss.27 When the incident electromagnetic wave hits the BF/RGO/PANI nanocomposites, an oscillating current was formed due to movement of the carrier of RGO. The BF nanoparticles decorated on the surface of RGO can also be used as a multi-pole polarization center, strengthening the electronic polarization of the nanocomposites and regulating the incident electromagnetic wave, which is conducive to strong absorption of the electromagnetic wave.39 Meanwhile, the presence of a PANI coating layer enhances the Debye dipole relaxation of RGO, and the conjugated electron clouds of the PANI molecular chains are transferred to RGO by electronic polarization to form electron tunneling between PANI and RGO. This has a tunnel effect and enhances the absorption of BF/RGO/PANI nanocomposites for the electromagnetic wave; as described in the previous work. The synergetic effect among BF nanoparticles, RGO sheets, and PANI could adjust both the complex permittivity and permeability, which is beneficial for the impedance match. Conductivity is another important factor in the optimal matching of impedance.22 Both high and low conductivity leads to bad microwave absorption. Highly conductive materials result in the skin effect, which increases the reflection on the surface of absorbers and decreases the absorption. Graphene is highly conductive, which means that the microwave absorption of graphene is poor. In the present work, graphene was decorated with BF nanoparticles and coated by PANI, which reduced the conductivity of the graphene-based composites to some extent, and improved the impedance matching. The microwave absorption mechanism as discussed above is shown in Scheme 1. In the work of BF/RGO/PANI nanocomposites, BF/RGO/PANI-3 nanocomposites possess better impedance matching and loss capacity. Hence, BF/RGO/PANI-3 nanocomposites have the best microwave absorption properties.
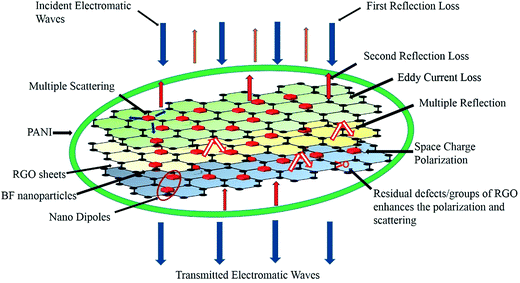 |
| | Scheme 1 Schematic representation of the microwave attenuation mechanism in BF/RGO/PANI nanocomposites. | |
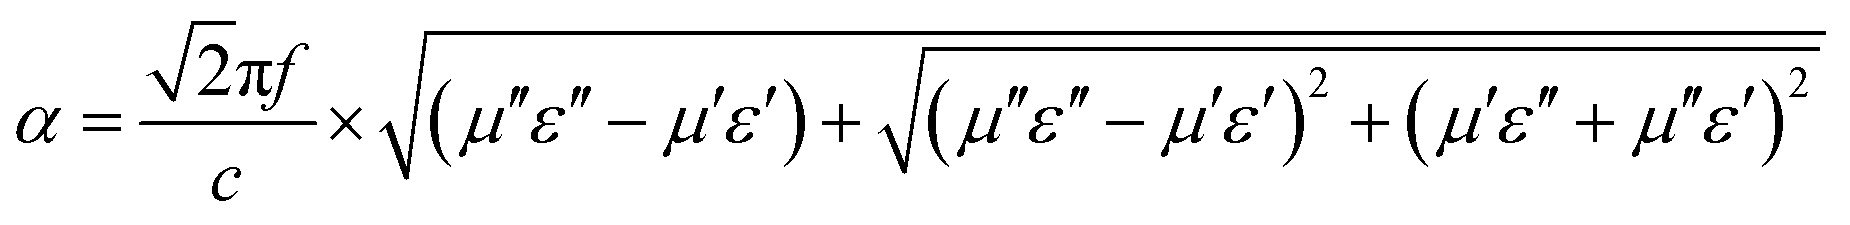
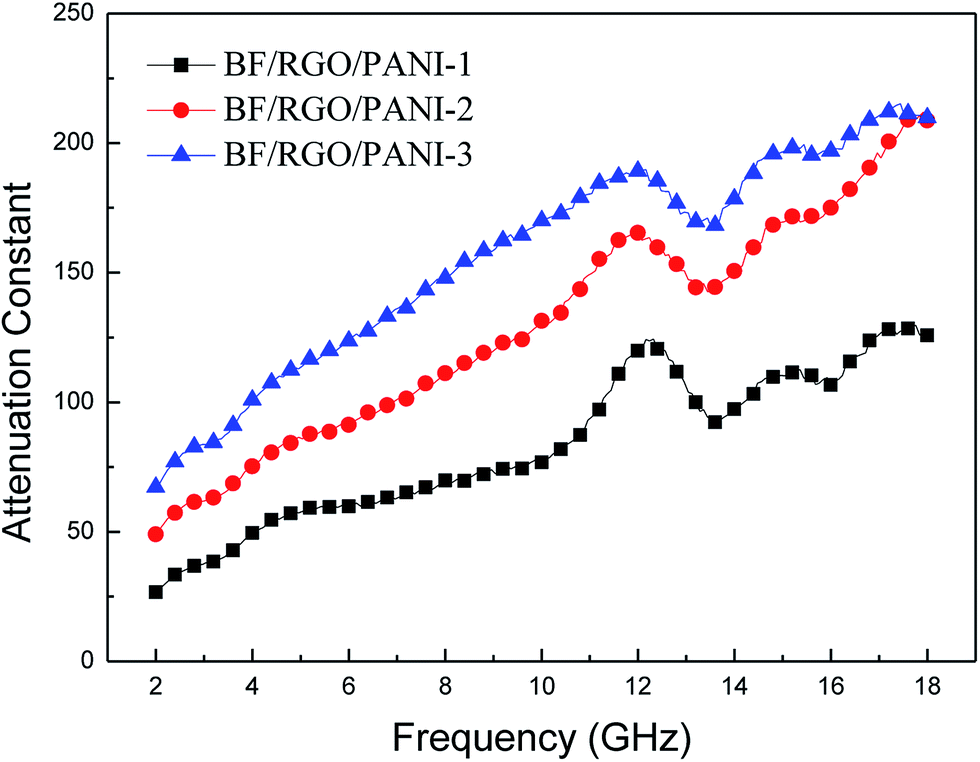
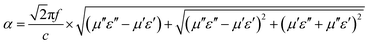
Meanwhile, the attenuation constant α is another essential factor for an outstanding absorber. The α can be defined as:39
| |
 | (10) |
where
f is the frequency of electromagnetic wave propagation and
c is the velocity of light. As shown in
Fig. 14, all samples exhibit a similar trend. BF/RGO/PANI-3 nanocomposites have the highest
α, leading to the most outstanding microwave absorption.
 |
| | Fig. 14 Microwave attenuation constants (α) of BF/RGO/PANI nanocomposites with different components. | |
4. Conclusions
When BF nanoparticles are decorated with RGO and composited with PANI, the presence of the interfacial polarization between BF/RGO and PANI can help enhance microwave absorption performance. The increase in PANI content in BF/RGO/PANI nanocomposites can help enhance the energy attenuation and improve the impedance match. BF/RGO/PANI-3 nanocomposites exhibit a better microwave absorption performance. The minimum reflection loss was up to −49.1 dB at 14.08 GHz with a thickness of 1.9 mm, and the absorption bandwidths exceeding −10 dB were 4.32 GHz. Thus, the BF/RGO/PANI nanocomposites have significant potential for application in the microwave absorption field.
References
- Y. J. Chen, Y. Li, M. C. Yip and N. Tai, Compos. Sci. Technol., 2013, 80, 80–86 CrossRef CAS.
- A. Baniasadi, A. Ghasemi, A. Nemati, M. A. Ghadikolaei and E. Paimozd, J. Alloys Compd., 2014, 583, 325–328 CrossRef CAS.
- M. Verma, A. P. Singh, P. Sambyal, B. P. Singh, S. K. Dhawanb and V. Choudhary, Phys. Chem. Chem. Phys., 2015, 17, 1610–1618 RSC.
- P. B. Liu, Y. Huang and X. Sun, ACS Appl. Mater. Interfaces, 2013, 5, 12355–12360 CAS.
- T. K. Gupta, B. Singh, R. B. Mathur and S. R. Dhakate, Nanoscale, 2014, 6, 842–851 RSC.
- J. Xiang, J. Li, X. Zhang, Q. Ye, J. Xu and X. Shen, J. Mater. Chem. A, 2014, 2, 16905–16914 CAS.
- Z. H. Yang, Z. W. Li, L. H. Yu, Y. H. Yang and Z. C. Xu, J. Mater. Chem. C, 2014, 2, 7583–7588 RSC.
- T. T. Qi, C. C. Huang, S. Yan, X. J. Li and S. Y. Pan, Talanta, 2015, 144, 1116–1124 CrossRef CAS PubMed.
- J. H. Luo, Y. Xu and D. D. Gao, Solid State Sci., 2014, 37, 40–46 CrossRef CAS.
- Y. Xie, X. W. Hong, Y. H. Gao, M. J. Li, J. M. Liu, J. Wang and J. Lu, Synth. Met., 2012, 162, 677–681 CrossRef CAS.
- X. S. Liu, P. Hernández-Gómez, Y. X. Deng, K. Huang, X. B. Xu, S. X. Qiu and D. Zhou, J. Magn. Magn. Mater., 2009, 321, 2421–2424 CrossRef CAS.
- J. H. Luo, Mater. Lett., 2012, 80, 162–164 CrossRef CAS.
- S. Ounnunkad, Solid State Commun., 2006, 138, 472–475 CrossRef CAS.
- S. S. R. Inbanathan, V. Valthyanathan, J. A. Chelvane, G. Markandeyulu and K. K. Bharathi, J. Magn. Magn. Mater., 2014, 353, 41–46 CrossRef CAS.
- J. Wang, H. Zhang, S. X. Bai, K. Chen and C. R. Zhang, J. Magn. Magn. Mater., 2007, 312, 310–313 CrossRef CAS.
- X. G. Huang, J. Chen, J. Zhang, L. X. Wang and Q. T. Zhang, J. Alloys Compd., 2010, 506, 347–350 CrossRef CAS.
- Y. C. Si and E. T. Samulski, Nano Lett., 2008, 8, 1679–1682 CrossRef CAS PubMed.
- P. Blake, P. D. Brimicombe, R. R. Nair, T. J. Booth, D. Jiang, F. Schedin, L. A. Ponomarenko, S. V. Morozov, H. F. Gleeson, E. W. Hill, A. K. Geim and K. S. Novoselov, Nano Lett., 2008, 8, 1704–1708 CrossRef PubMed.
- K. Singh, A. Ohlan, V. H. Pham, R. Balasubramaniyan, S. Varshney, J. Jang, S. H. Hur, W. M. Choi, M. Kumar, S. K. Dhawan, B. S. Kong and J. S. Chung, Nanoscale, 2013, 5, 2411–2420 RSC.
- C. G. Hu, Z. Y. Mou, N. Chen, Z. L. Dong, M. J. Hu and L. T. Qu, Phys. Chem. Chem. Phys., 2013, 15, 13038–13043 RSC.
- A. Tadjarodi, H. Kerdari and M. Imani, J. Alloys Compd., 2013, 554, 284–292 CrossRef CAS.
- P. Bhattacharya, S. Dhibar, G. Hatui, A. Mandal, T. Das and C. K. Das, RSC Adv., 2014, 4, 17039–17053 RSC.
- Y. Wang, X. M. Wu, W. Z. Zhang and S. Huang, Synth. Met., 2015, 210, 165–170 CrossRef CAS.
- R. K. Mudsainiyan, S. K. Chawla, S. S. Meena, N. Sharma, R. Singh and A. Das, Ceram. Int., 2014, 40, 16617–16626 CrossRef CAS.
- R. K. Pandey and V. Lakshminarayanan, J. Phys. Chem. A, 2009, 113, 21596–21603 CAS.
- L. C. Li, X. Chen, X. X. Liang and B. Hao, Synth. Met., 2010, 160, 28–34 CrossRef CAS.
- J. H. Luo, P. Shen, W. Yao, C. F. Jiang and J. G. Xu, Nanoscale Res. Lett., 2016, 11, 141 CrossRef PubMed.
- X. Sun, J. P. He, G. X. Li, J. Tang, T. Wang, Y. X. Guo and H. R. Xue, J. Mater. Chem. C, 2013, 1, 765–777 RSC.
- K. Singh, A. Ohlan, V. H. Pham, R. Balasubramaniyan, S. Varshney, J. Jang, S. H. Hur, W. M. Choi, M. Kumar, S. K. Dhawan, B. S. Kong and J. S. Chung, Nanoscale, 2013, 5, 2411–2420 RSC.
- M. S. Cao, J. Yang, W. L. Song, D. Q. Zhang, B. Wen, H. B. Jin, Z. L. Hou and J. Yuan, ACS Appl. Mater. Interfaces, 2012, 4, 6949–6956 CAS.
- J. Liu, W. Q. Cao, H. B. Jin, J. Yuan, D. Q. Zhang and M. S. Cao, J. Mater. Chem. C, 2015, 3, 4670–4677 RSC.
- G. X. Tong, F. T. Liu, W. H. Wu, F. F. Du and J. G. Guan, J. Mater. Chem. A, 2014, 2, 7373–7382 CAS.
- X. J. Zhang, G. S. Wang, W. Q. Cao, Y. Z. Wei, J. F. Liang, L. Guo and M. S. Cao, ACS Appl. Mater. Interfaces, 2014, 6, 7471–7478 CAS.
- J. H. Shen, J. T. Feng, L. C. Li, G. X. Tong and Y. B. He, J. Alloys Compd., 2015, 632, 490–499 CrossRef CAS.
- Y. Wang, Y. Huang, Q. F. Wang, Q. He and M. Zong, J. Sol-Gel Sci. Technol., 2013, 67, 344–350 CrossRef CAS.
- Z. T. Zhu, X. Sun, H. R. Xue, H. Guo, X. L. Fan, X. C. Pan and J. P. He, J. Mater. Chem. C, 2014, 2, 6582–6591 RSC.
- G. X. Tong, W. H. Wu, J. G. Guan, H. S. Qian, J. H. Yuan and W. Li, J. Alloys Compd., 2011, 509, 4320–4326 CrossRef CAS.
- X. H. Li, J. Feng, Y. P. Du, J. T. Bai, H. M. Fan, H. L. Zhang, Y. Peng and F. S. Li, J. Mater. Chem. A, 2015, 3, 5535–5546 CAS.
- Y. T. Zhao, L. Liu, K. D. Jiang, M. T. Fan, C. Jin, J. N. Han, W. H. Wu and G. X. Tong, RSC Adv., 2017, 19, 11222–11812 Search PubMed.
|
| This journal is © The Royal Society of Chemistry 2017 |
Click here to see how this site uses Cookies. View our privacy policy here. 
 Open Access Article
 This Open Access Article is licensed under a Creative Commons Attribution-Non Commercial 3.0 Unported Licence
 *,
Yue Zuo,
Pan Shen,
Zhu Yan and
Kang Zhang
*,
Yue Zuo,
Pan Shen,
Zhu Yan and
Kang Zhang