 Open Access Article
Preparation of cationic polymeric nanoparticles as an effective adsorbent for removing diclofenac sodium from water
Tao Liu ,
Zhihai Xie*,
Yu Zhang,
Jin Fan and
Qing Liu
Key Laboratory of Synthetic & Natural Functional Molecular Chemistry of the Ministry of Education, College of Chemistry & Material Science, Northwest University, No. 1 Xuefu Road, Xi'an 710127, Shanxi, China. E-mail: xiezhihai8@163.com; Fax: +86-029-81535026; Tel: +86-029-8303287
First published on 3rd August 2017
Abstract
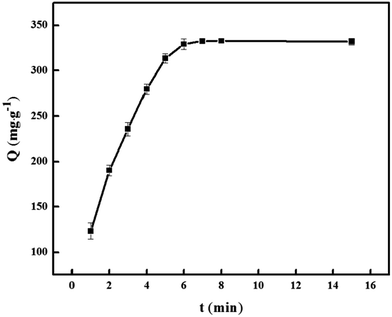
New cationic polymeric nanoparticles (PNPs) were synthesized by precipitation polymerization using [2-(methacryloyloxy)ethyl] trimethylammonium chloride and ethylene glycol dimethacrylate for adsorption of diclofenac sodium. The PNPs were characterized using FTIR, SEM, TEM, and their specific surface areas and thermal stabilities were measured. The adsorption capacity of PNPs was studied by static adsorption experiments. The adsorption equilibrium was achieved within only 7 min, and quantitative desorption required 3 min using 0.1 mol L−1 NaOH/methanol (1![[thin space (1/6-em)]](https://www.rsc.org/images/entities/char_2009.gif) :
:![[thin space (1/6-em)]](https://www.rsc.org/images/entities/char_2009.gif) 1, v/v) as eluent. The maximum adsorption capacity of the PNPs for diclofenac sodium was 334.2 mg g−1. The specific surface area for the PNPs was 192.5 m2 g−1. The isothermal adsorption model and the kinetic model were well fitted with the Langmuir adsorption model and a pseudo-second order kinetic model, and the adsorption mechanism was also discussed in detail. The PNPs could be used repeatedly for 6 cycles without a significant decrease in adsorption capacity. The prepared PNPs can be considered to be a promising sorbent for the adsorption of diclofenac sodium from water samples.
1, v/v) as eluent. The maximum adsorption capacity of the PNPs for diclofenac sodium was 334.2 mg g−1. The specific surface area for the PNPs was 192.5 m2 g−1. The isothermal adsorption model and the kinetic model were well fitted with the Langmuir adsorption model and a pseudo-second order kinetic model, and the adsorption mechanism was also discussed in detail. The PNPs could be used repeatedly for 6 cycles without a significant decrease in adsorption capacity. The prepared PNPs can be considered to be a promising sorbent for the adsorption of diclofenac sodium from water samples.
1 Introduction
Diclofenac sodium (DS) is an important non-steroidal anti-inflammatory drug. It is widely used to reduce inflammation and as an analgesic in conditions such as in arthritis or acute injuries. Due to its wide use, it is one of the pharmaceuticals most commonly found in aquatic environments.1,2 Despite its presence in small amounts as a pharmaceutical residue in bodies of water, the potential effect on the environment should not be neglected. The complete removal of DS is impossible in conventional water treatment plants due to its high polarity and solubility in water. Thus, it is important to develop effective methods to remove DS from aquatic environments.So far, a variety of methods such as adsorption,3–7 biodegradation,8 oxidation,9 and membrane filtration10 have been employed to remove different organic micropollutants from wastewater. Amongst these techniques, adsorption using solid adsorbents is an effective method for the removal of organic micropollutants from water.11 One of the most commonly used adsorbents for the removal of contaminants is activated carbon (AC).12,13 However, AC has lack of adsorption selectivity and difficulty in regeneration, which limit its applications in the removal of organic micropollutants. Additionally, ion exchange resins,14 clay minerals,15 and some inorganic materials with mesoporous structures, such as hexagonal mesoporous silicates have also been used to remove micropollutants.16 The adsorption procedures for these adsorbents are however, time consuming. Therefore, the development of high performance, low cost adsorbents has attracted fair amount of interest, in the treatment of organic pharmaceuticals.
Nanoparticles are used as adsorbents because of their small particle sizes, large specific surface areas and high density of surface active sites, good hydrodynamic performances.17,18 These nanomaterials such as Fe3O4 nanoparticles,19 SiO2-coated Fe3O4 nanocomposites,20,21 and carbon nanotubes22 have been used for the removal of organic pollutants and DS in water. However, these nanoparticles adsorbents have some shortcomings, such as high preparation cost, strict operational condition, and high energy consumption. These drawbacks restrict the application of nanoparticles adsorbents in wastewater treatment. In recent years, the polymers and polymeric nanoparticles containing various functional groups, such as carboxyl (–COOH), hydroxyl (–OH), and amino (–NH2), have been used for removing various kinds of contaminations from waste water.23–26 The imprinted microspheres and nanoparticles have been synthesized for the extraction of DS from human urine.27 So far, the polymeric nanoparticles containing quaternary ammonium salts for removal of DS have not been reported.
In this paper, from the viewpoint that possibly existed electrostatic attraction between the adsorbents and DS, the polymeric nanoparticles containing quaternary ammonium (PNPs) were synthesized by precipitation polymerization using [2-(methacryloyloxy)-ethyl]trimethylammonium chloride and ethylene glycol dimethacrylate for adsorption of DS. The adsorption and desorption of the PNPs for DS were studied in detail. The adsorption models were simulated, so as to establish the kinetic and thermodynamic equations.
2 Experimental
2.1 Chemicals and materials
Diclofenac sodium (DS), ibuprofen, naproxen, meclomen, phenylacetic acid, [2-(methacryloyloxy)ethyl]trimethylammonium chloride (DMC), and dimethyldiallylammonium chloride (DADMAC) were purchased from Aladdin Chemical Reagent (Los Angeles, USA). Ethyleneglycol dimethacrylate (EGDMA) was supplied by Xiya Reagent (Chengdu, China). 2,2′-Azobis-isobutyronitrile (AIBN) was obtained from Shanpu Chemical Industry (Shanghai, China). Hydrochloric acid, sodium hydroxide, methanol, and ammonia solution (28.0%) were provided by Kemiou Chemical Reagent (Tianjin, China). Standard stock solution of DS (1000.0 mg L−1) was prepared by dissolving of 0.1000 g DS in 100.0 mL deionized water. Standard working solutions were prepared by appropriate dilutions of the stock solution. Deionized water was used for the preparation of all the solutions.2.2 Apparatus
Absorbances were recorded on a UV-2550 spectrophotometer using a 1.0 cm quartz cell (Shimadzu, Japan). The FTIR spectra of the sample, in the form of KBr pellets, were obtained by a Tensor 27 spectrometer (Bruker, Germany). The SEM image was investigated by SU-8010 SEM (Hitachi, Japan). TEM images were obtained using a H-600 TEM (Hitachi, Japan). Zeta potential values were determined by a DB-525 Analyzer (Brookhaven, USA). Fluorescence intensities were recorded using a F-4500 fluorospectrophotometer (Hitachi, Japan). The specific surface area was determined by a TriStar II 3020 surface area analyzer (Micromeritics, America). The thermal stability was measured using a STA 449C thermogravimetric analyzer (Netzsch, Germany).2.3 Synthesis of the polymer nanoparticles
PNPs were prepared by precipitation polymerization method. DMC and EGDMA were added to 50 mL of methanol/water solution (4![[thin space (1/6-em)]](https://www.rsc.org/images/entities/char_2009.gif) :
:![[thin space (1/6-em)]](https://www.rsc.org/images/entities/char_2009.gif) 1, v/v), and stirred at room temperature for 30 min. This was followed by the addition of AIBN (40 mg) initiator. The polymerization was allowed to proceed under nitrogen atmosphere while stirring at 55 °C for 12 h. The product was washed with methanol and deionized water, respectively. And then the product was dried under vacuum at 80 °C.
1, v/v), and stirred at room temperature for 30 min. This was followed by the addition of AIBN (40 mg) initiator. The polymerization was allowed to proceed under nitrogen atmosphere while stirring at 55 °C for 12 h. The product was washed with methanol and deionized water, respectively. And then the product was dried under vacuum at 80 °C.
2.4 Adsorption experiment
PNPs (30.0 mg) and DS (500.0 mg L−1, 25.0 mL, pH 7) were taken in a 50 mL beaker. The mixture was stirred for 7 min at room temperature and then filtered. The concentration of DS in the filtrate was measured spectrophotometrically at 275 nm. The adsorption capacity was calculated using the following equation:
 | (1) |
3 Results and discussion
3.1 The selection of monomer
DS is organic acid and can exist in water in the forms of anions or neutral molecules at different pH values (pKa = 4.2). Therefore, the cationic monomers, DMC and DADMAC were chosen to prepare two different kinds of PNPs to obtain high adsorption efficiency. A series of PNPs (PNPs/DMC or PNPs/DADMAC) were prepared using different molar ratios of DMC![[thin space (1/6-em)]](https://www.rsc.org/images/entities/char_2009.gif) :
:![[thin space (1/6-em)]](https://www.rsc.org/images/entities/char_2009.gif) EGDMA or DADMAC
EGDMA or DADMAC![[thin space (1/6-em)]](https://www.rsc.org/images/entities/char_2009.gif) :
:![[thin space (1/6-em)]](https://www.rsc.org/images/entities/char_2009.gif) EGDMA. The maximum adsorption capacity of PNPs/DMC was 334.2 mg g−1 with 4
EGDMA. The maximum adsorption capacity of PNPs/DMC was 334.2 mg g−1 with 4![[thin space (1/6-em)]](https://www.rsc.org/images/entities/char_2009.gif) :
:![[thin space (1/6-em)]](https://www.rsc.org/images/entities/char_2009.gif) 5 molar ratio of DMC and EGDMA, and the PNPs/DADMAC was only 19.87 mg g−1. Therefore, DMC was chosen as cationic monomer, and the PNPs (PNPs/DMC) were prepared with a 4
5 molar ratio of DMC and EGDMA, and the PNPs/DADMAC was only 19.87 mg g−1. Therefore, DMC was chosen as cationic monomer, and the PNPs (PNPs/DMC) were prepared with a 4![[thin space (1/6-em)]](https://www.rsc.org/images/entities/char_2009.gif) :
:![[thin space (1/6-em)]](https://www.rsc.org/images/entities/char_2009.gif) 5 (DMC
5 (DMC![[thin space (1/6-em)]](https://www.rsc.org/images/entities/char_2009.gif) :
:![[thin space (1/6-em)]](https://www.rsc.org/images/entities/char_2009.gif) EGDMA) molar ratio in further experiments. The schematic representation of synthesis of the PNPs was illustrated in Fig. 1.
EGDMA) molar ratio in further experiments. The schematic representation of synthesis of the PNPs was illustrated in Fig. 1.
3.2 Characterization of PNPs
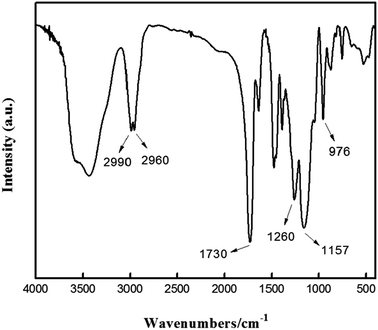
The FTIR spectrum of PNPs was shown in Fig. 2. The peaks at 2960 cm−1 and 2990 cm−1 could be assigned to the symmetric and asymmetric stretching vibrations of C–H of the methylene groups, and the strong stretching vibration peak at 1730 cm−1 was due to C![[double bond, length as m-dash]](https://www.rsc.org/images/entities/char_e001.gif) O of the ester group.28 The peaks due to the symmetric and asymmetric stretching vibrations of C–O appeared at 1260 cm−1 and 1157 cm−1, respectively. The peak at 976 cm−1 was the stretching vibration of C–N in DMC.29 These results indicated that PNPs were formed due to the co-polymerization of DMC and EGDMA.
O of the ester group.28 The peaks due to the symmetric and asymmetric stretching vibrations of C–O appeared at 1260 cm−1 and 1157 cm−1, respectively. The peak at 976 cm−1 was the stretching vibration of C–N in DMC.29 These results indicated that PNPs were formed due to the co-polymerization of DMC and EGDMA.
The SEM and TEM images of PNPs were shown in Fig. 3. The diameters of the polymeric particles were in the range of 30–60 nm and the shape of granules was irregularly spherical. The PNPs were agglomerate with each other.
The specific surface area of the PNPs was determined by N2 adsorption–desorption measurement. The specific surface area for the PNPs was 192.5 m2 g−1.
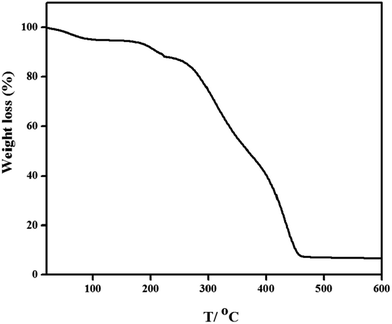
The thermogravimetric analysis (TGA) curve was shown in Fig. 4. The TGA curve of the PNPs showed two weight loss stages from 20 °C to 600 °C. The first weight loss stage in the temperature range of 20–220 °C was due to the dehydration of the water residues in the PNPs. The high weight decrease in the second stage from 220 to 600 °C was assigned to the loss of the PNPs.
3.3 Adsorption properties
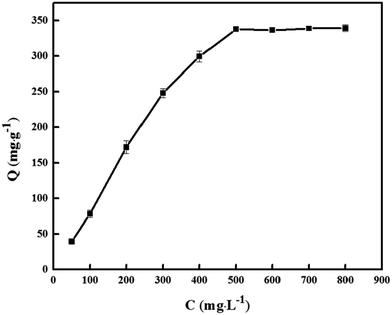 | ||
| Fig. 6 Isothermal adsorption curve of PNPs. Conditions: PNPs, 30.0 mg; pH 7.0; stirring time, 7 min. | ||
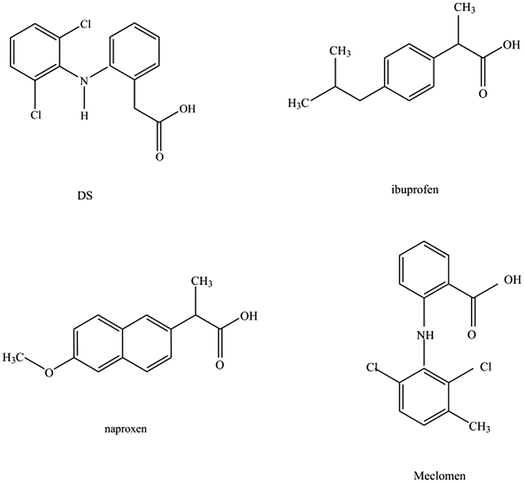
In addition, the adsorption capacities of PNPs for the structural analogues of DS, such as ibuprofen, naproxen, meclomen and phenylacetic acid (Fig. 7) were also determined under non-competitive conditions at room temperature (pH 7). The saturated adsorption capacity were 117.5 mg g−1, 200.3 mg g−1, 184.3 mg g−1 and 105.3 mg g−1, respectively. The PNPs have good adsorption capacities to the analogues, but the tendency of PNPs to bind DS is greater than the other examined in this study under the same conditions.
The Langmuir and Freundlich adsorption isotherm models were used to analyze the adsorption behaviors of DS on PNPs. The thermodynamic data at different temperatures were listed in Table 1. The Langmuir model was better fitted to the adsorption isotherms of DS than the Freundlich model at the investigated temperatures, since the R2 values of the Langmuir isotherm model were greater than those of the Freundlich isotherm model. The calculated value of 344.8 mg g−1 (Qe,cal), estimated from the Langmuir adsorption isotherm model, was close to the experimental value of 334.2 mg g−1 (Qe,exp). The results illustrated that monolayer adsorption was the main mechanism of adsorption of DS on the PNPs.31
| T/K | Langmuir | Freundlich | ||||
|---|---|---|---|---|---|---|
| KL (L mg−1) | Qmax (mg g−1) | R2 | KF (mg g−1) | n | R2 | |
| 283 | 0.1578 | 343.1 | 0.9932 | 72.21 | 3.126 | 0.7345 |
| 293 | 0.1663 | 344.8 | 0.9996 | 73.11 | 3.323 | 0.7253 |
| 303 | 0.1723 | 345.2 | 0.9821 | 74.45 | 3.561 | 0.7521 |
| 313 | 0.1803 | 345.6 | 0.9978 | 75.56 | 3.589 | 0.7657 |
To further study the adsorption kinetics of the PNPs for DS (whether the adsorption is dominated by a physical or chemical mechanism), the pseudo-first-order and pseudo-second-order equation were used to fit the experimental data.
The experimental data were fitted to the kinetics models mentioned above, and the obtained parameters were listed in Table 2. The value of R2 in the pseudo-second-order model was closer to 1 than that of pseudo-first-order model. The results indicated that the applicability of the pseudo-second-order kinetic model was feasible for describing the adsorption process of DS on PNPs, which suggested that the adsorption rate was controlled by chemical adsorption.32
| Kinetic models | Kinetic equation | Qe (mg g−1) | k | R2 |
|---|---|---|---|---|
| Pseudo-first-order | ln(Qe − Q) = −0.3672t + 5.0049 | 148.9 | 0.3672/(min−1) | 0.6038 |
| Pseudo-second-order | t/Q = 0.002632t + 0.0040124 | 380.2 | 0.001725/(mg g−1 min−1) | 0.9844 |
3.4 Desorption properties
Using methanol/0.3 mol L−1 HCl (1![[thin space (1/6-em)]](https://www.rsc.org/images/entities/char_2009.gif) :
:![[thin space (1/6-em)]](https://www.rsc.org/images/entities/char_2009.gif) 1, v/v) as the eluent, the maximum elution efficiency of 40.21% was achieved. Methanol/0.1 mol L−1 ammonia (1
1, v/v) as the eluent, the maximum elution efficiency of 40.21% was achieved. Methanol/0.1 mol L−1 ammonia (1![[thin space (1/6-em)]](https://www.rsc.org/images/entities/char_2009.gif) :
:![[thin space (1/6-em)]](https://www.rsc.org/images/entities/char_2009.gif) 1, v/v) as the eluent, the elution efficiency was 62.97%. The solutions containing methanol/NaOH solutions (1
1, v/v) as the eluent, the elution efficiency was 62.97%. The solutions containing methanol/NaOH solutions (1![[thin space (1/6-em)]](https://www.rsc.org/images/entities/char_2009.gif) :
:![[thin space (1/6-em)]](https://www.rsc.org/images/entities/char_2009.gif) 1, v/v) with different concentrations of NaOH (0.01 to 0.5 mol L−1) were selected as the eluents. The elution efficiency reached 81.58% when NaOH solution was 0.1 mol L−1. Thus, the solution containing equal volumes of methanol and 0.1 mol L−1 NaOH was chosen as the eluent in the later experiments.
1, v/v) with different concentrations of NaOH (0.01 to 0.5 mol L−1) were selected as the eluents. The elution efficiency reached 81.58% when NaOH solution was 0.1 mol L−1. Thus, the solution containing equal volumes of methanol and 0.1 mol L−1 NaOH was chosen as the eluent in the later experiments.
![[thin space (1/6-em)]](https://www.rsc.org/images/entities/char_2009.gif) :
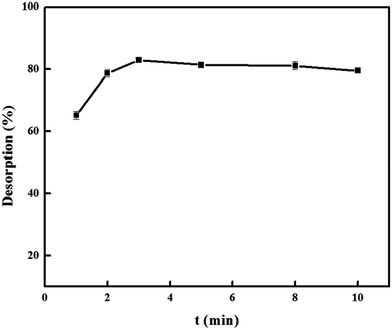
:![[thin space (1/6-em)]](https://www.rsc.org/images/entities/char_2009.gif) 1, v/v) in the range of 5.0, 10.0, 15.0, 20.0, and 25.0 mL were tested and the results were shown in Fig. 9. It was found that 5.0 mL was sufficient for complete desorption of DS. To ensure that desorption of DS from the PNPs was complete, the elution time was investigated in the 1–10 min. As shown in Fig. 10, it was observed that the complete elution was achieved after 3 min.
1, v/v) in the range of 5.0, 10.0, 15.0, 20.0, and 25.0 mL were tested and the results were shown in Fig. 9. It was found that 5.0 mL was sufficient for complete desorption of DS. To ensure that desorption of DS from the PNPs was complete, the elution time was investigated in the 1–10 min. As shown in Fig. 10, it was observed that the complete elution was achieved after 3 min.
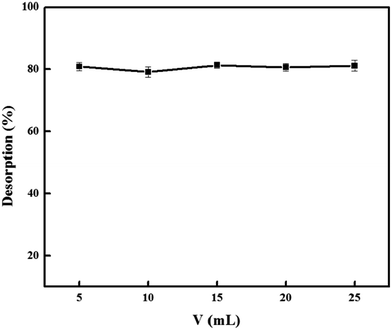 | ||
| Fig. 9 Effect of elution volume on desorption efficiency. Condition: PNPs, 30.0 mg; DS, 500.0 mg L−1; volume, 25.0 mL; pH 7.0; stirring time, 7 min; desorption time, 3 min. | ||
3.5 Regeneration of PNPs
The reusability of adsorbent is an important parameter for commercial applications, especially for cost-effectiveness. To determine the reusability of PNPs, adsorption and desorption experiments were carried out for 6 cycles. From Table 3, the adsorption capacity decreased to only 3.5% in sixth cycle, as compared to the first cycle. The results indicated that the PNPs had excellent stability and practical application.| Times | 1 | 2 | 3 | 4 | 5 | 6 |
| Q (mg g−1) | 334.2 | 331.7 | 329.5 | 326.4 | 323.1 | 322.5 |
3.6 Maximum sample volume and enrichment factor
In order to obtain a higher enhancement factor, the possibility of adsorption for DS from the large sample volume was examined. For this purpose, different volumes (200–1000 mL) of sample containing 0.05000 mg DS were subjected to the adsorption procedure while the volume of eluent was kept constant at 5.0 mL. It was found that up to 1000.0 mL of aqueous sample the recovery was quantitative (>90%). Thus, the sample volume of 1000 mL could be subjected to the adsorption procedure and the enrichment factor for DS was 200 by this method.3.7 Effect of coexisting substances
Under the optimal conditions, various coexisting substances were examined for effect on the adsorption capacity of PNPs for DS. The permitted relative deviation from adsorption capacity was ±5%. The experimental results were summarized in Table 4. The results show that the coexisting substances normally present in water do not interfere.| Interfering substances | Concentration (mg L−1) | Relative error (%) | Interfering substances | Concentration (mg L−1) | Relative error (%) |
|---|---|---|---|---|---|
| a Sodium dodecyl benzene sulfonate. | |||||
| Na+ | 2000 | 1.6 | Cl− | 2000 | 3.4 |
| K+ | 2000 | 3.2 | SO42− | 500 | 4.1 |
| Ca2+ | 1000 | 1.1 | NO3− | 1000 | 3.1 |
| Mg2+ | 1000 | 2.6 | CO32− | 1000 | 2.2 |
| Al3+ | 200 | 1.8 | Glucose | 300 | −1.9 |
| Fe2+ | 100 | −2.7 | Saccharose | 250 | −4.7 |
| Cu2+ | 100 | −2.2 | Starch | 250 | −2.9 |
| Mn2+ | 100 | −1.7 | Uric acid | 50 | −4.2 |
| Zn2+ | 100 | −2.8 | Urea | 150 | −2.8 |
| SDBSa | 450 | −1.2 | OP-10 | 400 | −3.2 |
3.8 Adsorption mechanism
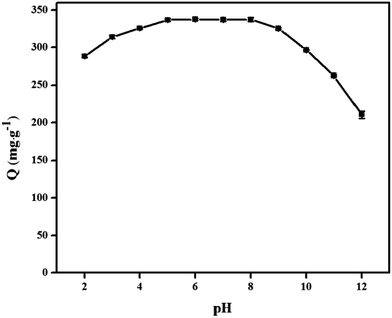
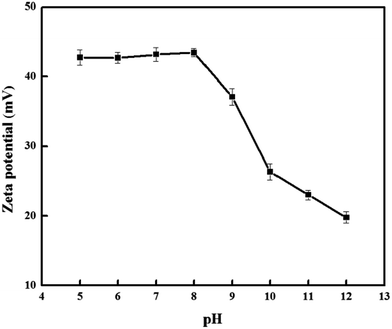
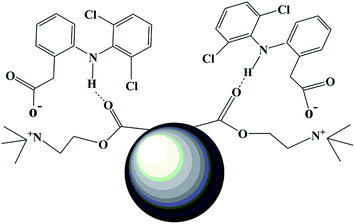
Understanding the adsorption mechanism is important, not only to understand the basics of adsorption but commercial applications of adsorption technologies. From Fig. 5, the adsorption capacity at pH values lower than the pKa of DS was smaller than that at pH of 5.0, because DS was in the form of neutral molecules (–COOH). On increasing the pH from 5.0 to 8.0, the adsorption capacity reached maximum and kept constant due to DS in the form of anions (–COO−) at pH > pKa, finally decreased at pH > 8.0. The zeta potential of the PNPs (shown in Fig. 11) indicated that there was a positive surface charge on PNPs over a wide pH range, but surface positive charge decreased at pH > 8.0. It was also consistent with the result that the adsorption capacities decreased gradually with the increase of pH due to the decrease of surface positive charge of PNPs from 9.0 to 12.0. The results suggested that the electrostatic interactions between anionic DS and cationic PNPs could be the main driving forces for adsorption. In addition, the hydrogen of secondary amine in DS molecule combined with the oxygen atom in the carbonyl group of PNPs by hydrogen bonds.34 Therefore, plausible adsorption mechanism is shown in Fig. 12.3.9 Comparison with other sorbents
The prepared PNPs sorbent was also compared with other sorbents reported in literature. The comparison of adsorption capacities, adsorption times, desorption times and enrichment factors of different kinds of sorbents, were presented in Table 5. It was clear that the adsorption capacity of the PNPs, prepared in this study, was much higher. Additionally, adsorption time and desorption time were also very fast, because of the nature of nanoparticles.| Sorbents | Qmax (mg g−1) | Adsorption time (min) | Desorption time (min) | Enrichment factor | Ref. |
|---|---|---|---|---|---|
| Activated carbon | 8.799 | 30 | — | — | 12 |
| Carbon nanotube | 24.01 | 60 | — | — | 22 |
| Bentonite hybrid material | 18.99 | 15 | — | — | 16 |
| Carbon xerogel | 80.0 | 2880 | — | — | 9 |
| Ion exchange resins | 3.18 | 1440 | — | — | 14 |
| Nanoparticles polymer | 150.4 | 40 | — | 4 | 27 |
| Magnetic polymer | 116.0 | 6 | 7 | 100 | 20 |
| 2-Vinylpyridine polymer | 324.8 | 120 | — | 500 | 2 |
| 1-Vinylimidazo polymer | 10.32 | 60 | 10 | 10 | 23 |
| Methacrylic acid polymer | — | 30 | 8 | 100 | 24 |
| Clay mineral | 15.9 | 1440 | — | — | 15 |
| PNPs | 334.2 | 7 | 3 | 200 | This work |
4 Conclusions
In this paper, PNPs were synthesized using DMC and EGDMA, by precipitation polymerization method. The prepared PNPs were utilized to adsorb DS. The most significant characteristics of PNPs were high adsorption capacity, fast adsorption and desorption of DS, probably due to the nature of its nanoparticles. It was speculated that PNPs could be utilized as a potential sorbent for separation and enrichment DS from aquatic environments.Conflict of interest
The authors declare no competing financial interest.References
- L. Figueiredo, G. L. Erny, L. Santos and A. Alves, Talanta, 2016, 146, 754–765 CrossRef CAS PubMed.
- C. M. Dai, X. F. Zhou, Y. L. Zhang, S. G. Liu and J. Zhang, J. Hazard. Mater., 2011, 198, 175–181 CrossRef CAS PubMed.
- B. C. Pires, F. V. A. Dutra, T. A. Nascimento and K. B. Borges, React. Funct. Polym., 2017, 113, 40–49 CrossRef CAS.
- M. J. Ahmed, J. Environ. Manage., 2017, 190, 274–282 CrossRef CAS PubMed.
- A. Khan, J. Wang, J. Li, X. Wang, Z. Chen, A. Alsaedi and X. Wang, Environ. Sci. Pollut. Res., 2017, 24, 1–21 CrossRef PubMed.
- M. Zhou, Q. Li, S. Zhong, J. Chen, H. Lin and X. L. Wu, Mater. Chem. Phys., 2017, 198, 186–192 CrossRef CAS.
- X. L. Wu, P. Xiao, S. Zhong, K. Fang, H. Lin and J. Chen, RSC Adv., 2017, 7, 28145–28151 RSC.
- S. T. Lee, B. Yang, J. Y. Kim, J. H. Park and M. H. Moon, J. Chromatogr. A, 2015, 1409, 218–225 CrossRef CAS PubMed.
- S. Álvarez, R. S. Ribeiro, H. T. Gomes, J. L. Sotelo and J. García, Chem. Eng. Res. Des., 2015, 95, 229–238 CrossRef.
- N. Suriyanon, P. Punyapalakul and C. Ngamcharussrivichai, Chem. Eng. J., 2013, 214, 208–218 CrossRef CAS.
- S. W. Nam, C. Jung, H. Li, M. Yu, J. R. Flora, L. K. Boateng and Y. Yoon, Chemosphere, 2015, 136, 20–26 CrossRef CAS PubMed.
- S. Larous and A. H. Meniai, Int. J. Hydrogen Energy, 2016, 41, 10380–10390 CrossRef CAS.
- J. L. Sotelo, G. Ovejero, A. Rodríguez, S. Álvarez, J. Galán and J. García, Chem. Eng. J., 2014, 240, 443–453 CrossRef CAS.
- K. A. Landry, P. Sun, C. H. Huang and T. H. Boyer, Water Res., 2015, 68, 510–521 CrossRef CAS PubMed.
- K. Sun, Y. Shi, H. Chen, X. Wang and Z. Li, J. Hazard. Mater., 2017, 323, 567–574 CrossRef CAS PubMed.
- D. Tiwari, Chem. Eng. J., 2015, 263, 364–373 CrossRef.
- X. L. Wu, P. Xiao, S. Zhong, K. Fang, H. Lin and J. Chen, RSC Adv., 2017, 7, 28145–28151 RSC.
- L. Ma, Y. Peng, B. Wu, D. Lei and H. Xu, Chem. Eng. J., 2013, 225, 59–67 CrossRef CAS.
- S. Ansari and M. Karimi, Talanta, 2017, 167, 470–485 CrossRef CAS PubMed.
- A. A. Pebdani, A. M. H. Shabani and S. Dadfarnia, J. Iran. Chem. Soc., 2016, 13, 155–164 CrossRef CAS.
- X. L. Wu, Y. Shi, S. Zhong, H. Lin and J. R. Chen, Appl. Surf. Sci., 2016, 378, 80–86 CrossRef CAS.
- X. Hu and Z. Cheng, Chin. J. Chem. Eng., 2015, 23, 1551–1556 CrossRef CAS.
- V. Manzo, K. Ulisse, I. Rodríguez, E. Pereira and P. Richter, Anal. Chim. Acta, 2015, 889, 130–137 CrossRef CAS PubMed.
- A. A. Pebdani, A. M. H. Shabani, S. Dadfarnia and S. Khodadoust, Spectrochim. Acta, Part A, 2015, 147, 26–30 CrossRef CAS PubMed.
- Y. He, T. Xu, J. Hu, C. J. Peng, Q. Yang, H. L. Wang and H. L. Liu, RSC Adv., 2017, 7, 30500–30505 RSC.
- X. Song, L. Li, Z. Geng, L. Zhou and L. Ji, J. Environ. Chem. Eng., 2017, 5, 16–25 CrossRef CAS.
- S. Noee, N. Salimraftar, M. Abdouss and G. Riazi, Polym. Int., 2013, 62, 1711–1716 CrossRef CAS.
- S. Sadeghi and M. Jahani, Food Chem., 2013, 141, 1242–1251 CrossRef CAS PubMed.
- M. M. Gou, L. Shen and Y. J. Xing, Dyeing Finish., 2012, 38, 6–9 CAS.
- C. M. Dai, S. U. Geissen, Y. L. Zhang, Y. J. Zhang and X. F. Zhou, Environ. Pollut., 2011, 159, 1660–1666 CrossRef CAS PubMed.
- F. Hayeeye, M. Sattar, W. Chinpa and O. Sirichote, Colloids Surf., A, 2017, 513, 259–266 CrossRef CAS.
- J. Fu, Z. Chen, M. Wang, S. Liu, J. Zhang, J. Zhang, R. P. Han and Q. Xu, Chem. Eng. J., 2015, 259, 53–61 CrossRef CAS.
- Y. Zhang, Z. H. Xie, X. X. Teng and J. Fan, J. Sep. Sci., 2016, 39, 1559–1566 CrossRef CAS PubMed.
- Z. H. Xiong, L. Wang, J. G. Zhou and J. M. Liu, Acta Phys.-Chim. Sin., 2010, 26, 2890–2898 CAS.
| This journal is © The Royal Society of Chemistry 2017 |


