 Open Access Article
The effect of powder grain size on the microstructure and electrical properties of 8 mol% Y2O3-stabilized ZrO2
Jianxing Zhang,
Xiaowei Huang *,
He Zhang,
Qiannan Xue,
Hong Xu,
Liangshi Wang* and
Zongyu Feng
General Research Institute for Nonferrous Metals, State Key Lab of Nonferrous Metals & Processes, No. 2 Xinjiekou Wai Str., 100088, Beijing, China. E-mail: hxw0129@126.com; wls1657@163.com
First published on 10th August 2017
Abstract
To improve the electrical properties of an 8 mol% yttria-stabilized zirconia (8YSZ) electrolyte, nanocrystalline (10–100 nm) 8YSZ powders were synthesized via a hydrothermal method followed by heat treatment at temperatures ranging from 800 °C to 1200 °C. Note that all the powders maintained the single-cubic phase structure, as observed via the results of the XRD and Raman spectra. Moreover, the annealing procedure of the powders caused the yttrium concentration of the surface to slightly increase, as observed via X-ray photoelectron spectroscopy (XPS). Moreover, according to the morphology shown in the SEM images and the electrochemical impedance spectroscopy (EIS), the powder grain size had an effect on the microstructure of the electrolytes fabricated via the conventional sintering method. In addition, it further influenced the relative density and conductivity of the electrolytes, which both first increased and then decreased with the increase in the powder grain size in the range of 10–100 nm. This showed that the powders with 50–80 nm grain size exhibited the best performance since it was not easy to induce grain coarsening in ceramics. The electrolyte sintered by these powders showed uniform and hexagonal grains with a mean size of 0.97 μm and a relative density of over 99%. Because of a large sum of grain boundaries and point defects, the electrolyte had a good conductivity of 174.1 mS cm−1 at 1000 °C measured by the four-probe DC method. In addition, the activation energy (0.955 eV) is lower than that for other samples; this suggests that 8 mol% Y2O3-stabilized ZrO2 has more advantages at lower working temperatures for SOFCs.
1. Introduction
Nowadays, Y2O3-stabilized ZrO2 (YSZ) has been regarded as the most reliable system of oxide-ion electrolytes for solid-oxide fuel cells (SOFCs),1–3 gas sensors,4 and oxygen pumps.5 Although electrolytes with various doping amounts of Y2O3 have been studied for different applications, the electrolyte with an 8 mol% doping amount of Y2O3 has the highest conductivity among them, which is an established electrolyte in SOFCs at high working temperatures (∼800–1000 °C).6,7 Currently, considerable efforts have been made in the fabrication of the 8YSZ electrolyte to enhance its ionic conductivity and mechanical properties. Although many researchers8,9 have investigated the influence of the electrolyte grain size on the microstructure and properties of the electrolyte in detail, lower attention has been paid to the effect of the initial powder grain size. Some recent results have indicated that a change in the initial powder grain size can change not only the microstructure of the YSZ electrolyte but also its properties.10,11 According to the phase diagram of ZrO2–Y2O3,12,13 the phase structure of 8YSZ should be the cubic phase. However, a small amount of monoclinic phase structure of ZrO2 is frequently detected after the 8YSZ powders are sintered. The monoclinic phase nanopowder shows a more difficult densification, coarser microstructure, and lower electrical conductivity as compared to the tetragonal and cubic phase YSZ nanopowders.14,15 Hence, it is essential to investigate the effect of the grain size of the powders with a single-cubic phase structure on the microstructure and electrical properties of the 8YSZ electrolytes.In this study, the single-cubic phase structured 8YSZ powders were prepared via the hydrothermal method. Moreover, the powder grain size was controlled by an additional heat treatment at different temperatures. Furthermore, in this study, we systematically investigated the effect of the powder grain size on the microstructure and electrical properties of the 8YSZ electrolyte sintered through conventional sintering.
2. Experimental
2.1. Preparation
Zirconium oxychloride (ZrOCl2·8H2O, A.R., Tianyao Chemical Plant, China) and yttrium chloride hexahydrate (YCl3·6H2O, A.R., Beijing Chemical Plant, China) were used as the starting materials. In accordance with the stoichiometric composition of (ZrO2)0.92(Y2O3)0.08, Zr4+ and Y3+ were coprecipitated at pH = 9 by sodium hydroxide in an aqueous solution at 60 °C. The precipitate was filtered and washed with distilled water until no Cl− ion could be detected by the AgNO3 solution. The filter cake was adequately stirred in an appropriate amount of distilled water and transferred into a polytetrafluoroethylene (PTFE) autoclave for a hydrothermal treatment at 200 °C for 20 h. After being cooled down to room temperature, the specimen was washed with ethyl alcohol and dried at 80 °C for 12 h. The powders were pretreated at different temperatures (800 °C, 900 °C, 1000 °C, 1100 °C, and 1200 °C) for 2 h in air followed by ball milling in water to improve the agglomeration caused by high temperatures. The green compacts were fabricated in rods with 60 mm × 6 mm × ∼4 mm size for the four-probe DC method and pellets with a diameter of 13 mm size (∼2 mm thick) for the two-probe AC impedance method by uniaxially pressing the milled powders under a pressure of 160 MPa in a closed die. Finally, 8YSZ ceramics were obtained via sintering at 1400 °C for 4 h in motionless air with gradual heating and cooling to minimize the thermal shock and cracking. Platinum lead wire and platinum paste were chosen as electrode materials. Before the investigation of the electrical properties, specimens with electrodes were first calcined at 900 °C for 1 h to remove the polymeric components and strengthen the combination of specimens and electrodes.2.2. Apparatus and methods
The crystal structure was identified by a powder X-ray diffractometer (XRD, X-Pert-MRD, PANalytical) with Cu-Kα radiation (λ = 1.5418) and Raman spectrometer (LabRAM Aramis, HORIBA Jobin Yvon). The mean grain size (Dmean) of the powders was estimated according to the Scherrer equation:
 | (1) |
The elemental composition of the powder particle surface was analysed by X-ray photoelectron spectroscopy (XPS, ESCALAB 250Xi). The spectra were obtained using the Al Kα (1486.6 eV) X-ray source. The apparent solid densities of the green compacts and the as-sintered ceramics were evaluated using an analytical balance (NewClassic MF, Mettler Toledo) according to the Archimedean method and compared with the theoretical density (ρcal = 5.95 g cm−3) from the lattice parameters obtained via XRD measurements. The specific surface areas of the powders were measured by BET-N2 (ST-8, Beijing Beifen Huapu Analysis Equipment Technology Co., Ltd, China), which could also be compared with the theoretical external surface area calculated from the mean particle size (Dmean) and YSZ density according to the following equation:
 | (2) |
The morphology of the as-prepared powders was characterized by transmission electron microscopy (TEM, G2 F20/FEI, TECNAI), and scanning electron microscopy (SEM, Hitachi S-4800) was employed to observe the morphology of the as-sintered ceramics. The average grain size of the ceramics was the average value of more than 100 grains measured via image analysis using the SEM images. The electrical properties of the YSZ ceramics were determined in air by the four-probe DC method (Bloom Energy Co. Ltd, USA) and the electrochemical two-probe AC impedance method in a VSP electrochemical workstation (Bio-Logic, France) over the frequency range from 0.1 Hz to 800 KHz with a potential of 10 mV. The dependence of ionic conductivity (σ) on temperature (T) can be represented by the Arrhenius relationship as follows:
 | (3) |
3. Results and discussion
3.1. Crystal growth and evaluation of YSZ powders
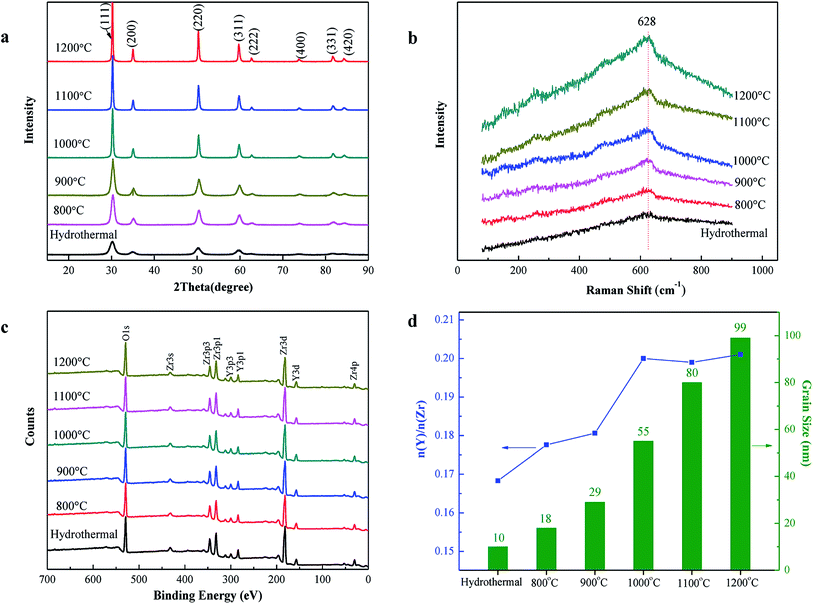
The hydrothermal method is a more preferable method because it leads to highly homogeneous distribution of the chemical constituents in crystals and weak agglomeration of the particles.16 Typical XRD patterns of the powders obtained by hydrothermal and an additional treatment at different temperatures are presented in Fig. 1(a). All diffraction peaks appearing in the patterns can be well indexed as the cubic structure of yttria-stabilized zirconia. However, the cubic structure of YSZ is difficult to be distinguished from the tetragonal phase only via the XRD patterns. Because the X-ray scattering factor of oxygen is smaller than that of zirconium, X-ray diffraction is insensitive to the tetragonal-cubic structural change in zirconia compounds. However, Raman scattering is a powerful tool that can be used to further confirm the crystal structure. As can be seen from Fig. 1(b), only a broad peak at near 628 cm−1 was clearly observed, which was the typical peak of the cubic phase.17,18 In addition, sharper diffraction peaks of the XRD patterns indicate grain growth with an increase in the temperature of heat treatment. According to the Scherrer equation, the mean grain sizes of the as-prepared powders were calculated. The mean grain size of the powders directly prepared via the hydrothermal method is about 10 nm. After an additional heat treatment at different temperatures from 800 °C to 1200 °C, the average grain sizes increased from 18 to 99 nm (Fig. 1(d)).The XPS survey spectra of the YSZ powders exhibit the peaks associated with Zr, Y, and O (Fig. 1(c)). The main peaks of Zr (Zr 3d) and Y (Y 3d) were chosen for quantification of the composition of the powder surface. The Y/Zr composition ratios slightly increased with the increase in the annealing temperature (Fig. 1(d)); this implies that not only the crystal growth but also a trace amount of surface segregation of yttrium occurred during the annealing procedure. Especially, in the temperature range from 800 to 1000 °C, the Y/Zr composition ratios increased apparently, whereas the yttrium segregation tended to attain equilibrium at temperatures higher than 1000 °C. The segregation phenomenon of yttrium is bound to cause significant changes in the chemical composition and defect disorder of the YSZ surface layer. However, the difference in the segregation should be miniscule after all the powders were sintered at 1400 °C because of the yttrium equilibrium segregation.
For directly comparing the effect of 8YSZ powders with different grain sizes on the microstructure and electrical properties of the electrolyte, it is necessary to have not only the single-phase structure but also the same soft agglomerates in the powders. However, a very high temperature of heat treatment may lead to the formation of a strong bond between fine crystallites and makes some soft agglomerates of powders strengthen to form hard agglomerates.19,20 The BET surface area of the powders formed by the hydrothermal method at 200 °C was 100.4 m2 g−1, and it gradually decreased from 70.1 to 4.4 m2 g−1 with an increase in temperature of heat treatment from 800 to 1200 °C (Fig. 2). Taking further advantage of the grain sizes obtained from the XRD patterns, the theoretical external surface areas Sgrain of the powders were calculated, which could be compared to the specific surface areas SBET measured by the BET method. As can be seen from the graph, both curves are extremely close; this suggests that to some extent, the particles are very well spherical and weekly agglomerated.
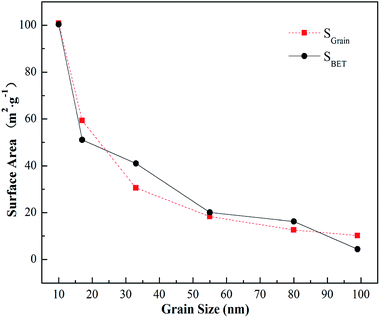 | ||
| Fig. 2 Grain size dependence of specific surface area of the powders. Sgrain is calculated by the grain size and SBET is measured by the BET method. | ||
Fig. 3 shows the TEM images of the powders. Apparently, it was observed that the 8YSZ powders synthesized by the hydrothermal method were composed of homogeneous and weakly agglomerated spherical nanocrystals with an ultrafine primary particle size of about 10 nm. Moreover, it was also clear that the crystals grew larger with an increase in the temperature of heat treatment, and the sizes of the crystals are in agreement with the results of the XRD data. However, it is inevitable that some agglomerates are still present because of the high temperature. Moreover, as can be seen from the selected area electron diffraction (SAED), the powders are all very well crystallized and present a cubic phase.
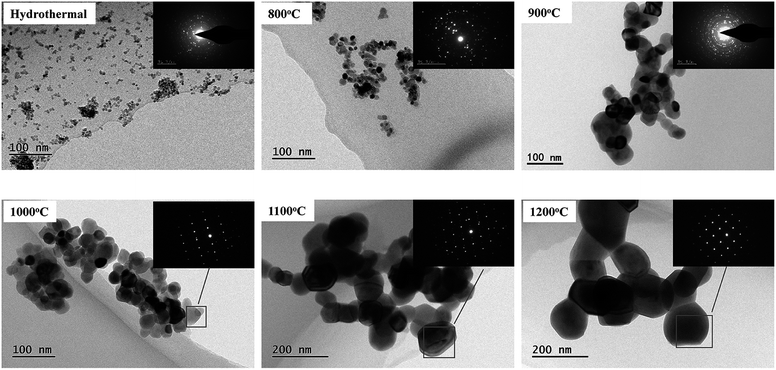 | ||
| Fig. 3 TEM images and SAED of the powders formed by the hydrothermal method and an additional heat treatment at different temperatures. | ||
3.2. Densification and microstructure of YSZ electrolytes
Fig. 4 shows the relative densities of the YSZ green compacts and the sintered compacts at 1400 °C formed using the powders with different grain sizes. The homogeneous packing of the fine powders with a grain size of less than 55 nm appears to be more difficult because of lack of powder flowability, affected by the interparticle force, resulting in the inhomogeneous large cavities. On the other hand, the cavities in the coarse 80 and 99 nm powder compact may be larger than those of the intermediate 55 nm powder compact, even while speculating homogeneous initial packing. The change trends of relative densities of both the YSZ green compact and the sintered compact are shown to first increase and then decrease with the increase in the powder grain sizes; this indicates that the density of the final sintered compact is strongly affected by that of the initial green compact. The densities of the sintered specimens are over 96% of the theoretical density, and the densest sample is that sintered using the 55 nm nanocrystalline powders, which has a relative density of about 99%.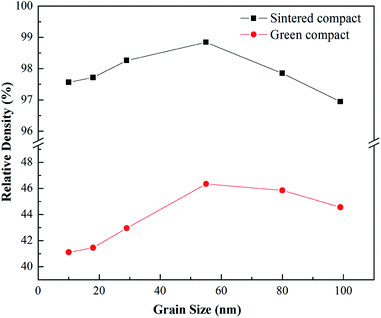 | ||
| Fig. 4 Relative densities of the YSZ green compact and the sintered compact at 1400 °C formed using powders with different grain sizes. | ||
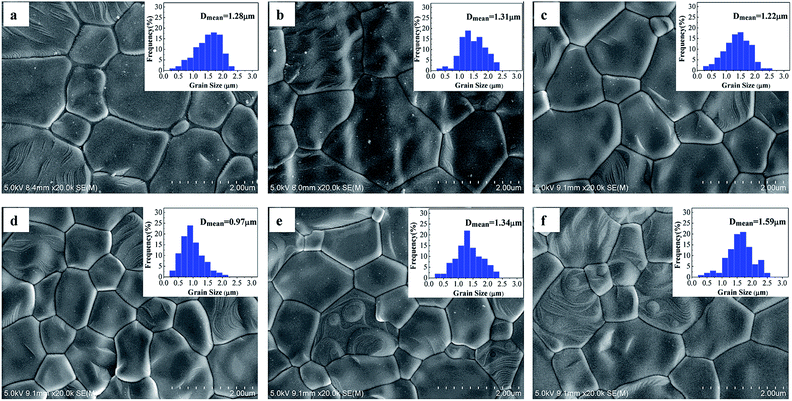
Moreover, the morphology and the grain size distribution of YSZ compacts sintered at 1400 °C are shown in Fig. 5. The grains of the densest sample with a 0.97 μm mean size are smallest and uniform (Fig. 5(d)). In contrast, the mean grain diameters of other compacts are slightly larger than 1 μm. This indicates that the grain coarsening of ceramics is detrimental to the densification of powders, whereas, the densification of nanocrystalline powders is regularly accompanied by strong grain growth. Theoretically, the densification of nanocrystalline powders depends on the discrepancy between the activation energies connected with the dominant densification and coarsening mechanisms.21,22 If the activation energy connected with densification is supposed to be lower than that connected with coarsening, densification is inferior to coarsening at high temperatures. On the other hand, grain growth has important contributions from the grain boundary motion and pore drag. In the case of the powder grain size from 10 to 55 nm, grain growth may be mainly dominated by pore drag, which is controlled by surface diffusion. Hence, the crystal grain grows faster because of the high surface free energy when the initial grain size is smaller. In addition, the yttrium surface segregation of the fine 10, 18, and 29 nm powders, which is against the crystal growth, is less than that of others, such that the crystal again grows faster, as shown in Fig. 5(a, b, and c), respectively. However, when the grain size of the powders becomes large enough, above 55 nm, the grain growth may be dominated by the intrinsic grain-boundary mobility. The driving force for grain boundary migration is mainly the interfacial energy of the grains.10 Because of the large initial grain size, the final grain size of the 80 or 99 nm powder compact is larger than that of the 55 nm powder compact, as shown in Fig. 5(d–f). From the abovementioned findings, the preference for the densification of 8YSZ is the powders with a grain size of about 55 nm.
3.3. Electrical properties of the YSZ electrolytes
The total conductivities of YSZ electrolytes sintered using the powders with different grain sizes are shown in Fig. 6, and the total activation energies are also separately calculated by the Arrhenius relationship, as shown in Table 1. It is obvious that the YSZ electrolyte fabricated using the powders with a 55 nm grain size have higher conductivity (174.1 mS cm−1 at 1000 °C) and lower activation energy (0.955 eV) than others. The low activation energy of the electrolyte indicates that it has more advantages at a lower working temperature. Li Q. et al.15 reported an activation energy of 1.14 eV for the 8YSZ sample sintered under a high pressure at 1273 K with a small amount of monoclinic phase. Because of less symmetry, the monoclinic phase is the less conducting phase as compared to the cubic phase, leading to a decrease in the electrical conductivity of 8YSZ. In fact, the conductivity of the solid electrolyte consists of grain conductivity and grain boundary conductivity. However, the intergranular region holds the key to the total conductivity of the electrolyte. Generally, low conductivity of the grain boundary makes the conductivity of the electrolyte undesirable as well. The conductivity of the grain interior is usually higher by two or three times that of the grain boundary.23 Electrochemical impedance spectroscopy (EIS) is an important and effective means to determine the conductivity of the grain boundary.24 As shown in Fig. 7, the YSZ electrolytes were also measured by EIS. There are no significant differences in the conductivity of the grain interior among the YSZ electrolytes, whereas the conductivity of the grain boundary changes clearly. The increased grain boundary volume fraction and altered point defect thermodynamics of nanocrystalline electrolytes can cause novel transport properties to some extent.25 Therefore, the grain boundary conductivity of the 8YSZ electrolyte shows a strong dependence upon the powder grain size of the electrolyte, whereas the grain-size dependence for the grain interior conductivity is not obvious.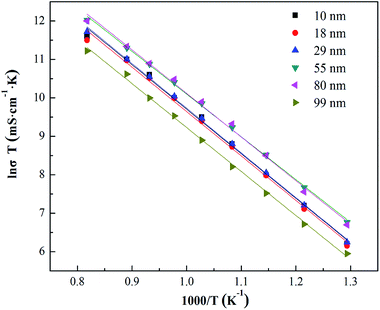 | ||
| Fig. 6 Temperature dependence of the total conductivity of YSZ electrolytes sintered using the powders with different grain sizes, measured via the four-probe DC technique. | ||
| Samples | Hydrothermal | 800 °C | 900 °C | 1000 °C | 1100 °C | 1200 °C |
|---|---|---|---|---|---|---|
| Grain size (nm) | 10 | 18 | 29 | 55 | 80 | 99 |
| Conductivity (mS cm−1, 1000 °C) | 137.8 | 139.3 | 149.8 | 174.1 | 169.2 | 110.5 |
| Activation energy (eV) | 0.991 | 0.992 | 0.998 | 0.955 | 0.973 | 0.982 |
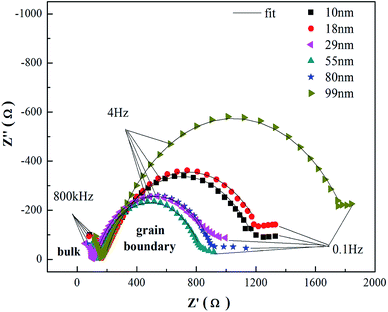 | ||
| Fig. 7 Impedance spectroscopy at 500 °C of the electrolytes sintered using the powders with different grain sizes. | ||
A simple model, such as the brick layer model, was built to determine the relationship between the microstructure of the electrolyte and the intergranular conductivity.26 It can be used to understand the electrical properties of intergranular region using eqn (4).
| σapp,gb = σsp,gbdgA/δgbS | (4) |
Based on this eqn (4), speculating that the grain boundary thickness δgb and specific intergranular conductivity σsp,gb remain constant during sintering, when the grain size dg increases gradually, the intergranular area decreases accordingly, which can result in the decrease of the total effective conducting area A. Because A is reduced as the square of the grain size, but dg is increased as the first power of grain size, the increase in the rate of dg is much slower than the decrease in the rate of A. Hence, the grain boundary conductivity would quickly decrease with the increasing grain size. This explains that grain coarsening is detrimental to the conductivity of the YSZ electrolyte.
4. Conclusions
Homogeneous 8YSZ nanopowders with a single-cubic phase structure were successfully prepared via the hydrothermal method followed by heat treatment at different temperatures. The relative densities of the sintered electrolytes first increased and then decreased with the increasing powder grain sizes in the range of 10–100 nm, which were between 96% and 99%. The differences in the density resulted from the significant differences in the microstructure of the 8YSZ electrolytes. Because of weakening of the grain coarsening of ceramics, 50–80 nm grain-sized 8YSZ powders were beneficial to be sintered into uniform and hexagonal grains with 0.97 μm mean size via the conventional sintering method. Moreover, benefiting from the densification and the microstructure, a large sum of grain boundaries and point defects caused higher conductivity and lower activation energy than those of others; this suggests that 8 mol% Y2O3-stabilized ZrO2 has more advantages at lower working temperatures for SOFCs.Acknowledgements
The authors gratefully acknowledge the financial support received from the Rare-earth Adjustment Upgrade Projects of Ministry of Industry and Information Technology of China and Beijing Nova Program Z161100004916108.References
- N. Mahato, A. Banerjee, A. Gupta, S. Omar and K. Balani, Prog. Mater. Sci., 2015, 72, 141–337 CrossRef CAS.
- A. Choudhury, H. Chandra and A. Arora, Renewable Sustainable Energy Rev., 2013, 20, 430–442 CrossRef CAS.
- J. C. Ruizmorales, D. Marrerolópez, J. Canalesvázquez and J. T. S. Irvine, RSC Adv., 2011, 1, 1403–1414 RSC.
- T. Liu, X. Zhang, L. Yuan and J. Yu, Solid State Ionics, 2015, 283, 91–102 CrossRef CAS.
- M. Schelter, J. Zosel and W. Oelßner, et al., Journal of Sensors and Sensor Systems, 2016, 5, 319–324 CrossRef.
- S. P. S. Badwal and F. T. Ciacchi, Ionics, 2000, 6, 1–21 CrossRef CAS.
- T. H. Etsell and S. N. Flengas, Chem. Rev., 1970, 70, 339–376 CrossRef CAS.
- C. Peters, A. Weber, B. Butz, D. Gerthsen and E. Ivers-Tiffée, J. Am. Ceram. Soc., 2009, 92, 2017–2024 CrossRef CAS.
- J. Lian, J. E. Garay and J. Wang, Scr. Mater., 2007, 56, 1095–1098 CrossRef CAS.
- J. Kanters, U. Eisele and J. Rödel, Acta Mater., 2000, 48, 1239–1246 CrossRef CAS.
- A. K. Pandey and K. Biswas, Ceram. Int., 2014, 40, 14111–14117 CrossRef CAS.
- J. R. Brandon and R. Taylor, Surf. Coat. Technol., 1991, 46, 75–90 CrossRef CAS.
- M. Asadikiya, H. Sabarou, M. Chen and Y. Zhong, RSC Adv., 2016, 6, 17438–17445 RSC.
- M. Trunec, K. Castkova and P. Roupcova, J. Am. Ceram. Soc., 2013, 96, 3720–3727 CrossRef CAS.
- Q. Li, T. Xia, X. D. Liu, X. F. Ma, J. Meng and X. Q. Cao, Mater. Sci. Eng., B, 2007, 138, 78–83 CrossRef CAS.
- K. Byrappa and M. Yoshimura, Handbook of Hydrothermal Technology, 2013, vol. 53, pp. 615–762 Search PubMed.
- Q. Xue, X. Huang, L. Wang, J. Dong, H. Xu and J. Zhang, Mater. Des., 2017, 114, 297–302 CrossRef CAS.
- H. Fujimori, M. Yashima, S. Sasaki, M. Kakihana, T. Mori, M. Tanaka and M. Yoshimura, Chem. Phys. Lett., 2001, 346, 217–223 CrossRef CAS.
- W. H. Rhodes, Chem. Informationsdienst, 1981, 12, 19–22 Search PubMed.
- A. R. Hanifi, M. Zazulak, T. H. Etsell and P. Sarkar, Powder Technol., 2012, 231, 35–43 CrossRef CAS.
- N. J. Shaw and R. J. Brook, J. Am. Ceram. Soc., 1986, 69, 107–110 CrossRef CAS.
- L. Feng, S. H. Lee, H. Wang and H. S. Lee, J. Eur. Ceram. Soc., 2015, 35, 4073–4081 CrossRef CAS.
- M. Han, X. Tang, H. Yin and S. Peng, J. Power Sources, 2007, 165, 757–763 CrossRef CAS.
- M. Aoki, Y. M. Chiang, I. Kosacki, J. R. Lee, H. Tuller and Y. Liu, J. Am. Ceram. Soc., 1996, 79, 1169–1180 CrossRef CAS.
- N. H. Perry and T. O. Mason, Solid State Ionics, 2010, 181, 276–284 CrossRef CAS.
- X. J. Chen, K. A. Khor, S. H. Chan and L. G. Yu, Mater. Sci. Eng., A, 2002, 335, 246–252 CrossRef.
| This journal is © The Royal Society of Chemistry 2017 |

