 Open Access Article
Creative Commons Attribution 3.0 Unported Licence
One-pot synthesis of 3D hierarchical porous Li3V2(PO4)3/C nanocomposites for high-rate and long-life lithium ion batteries†
Yi Chengab,
Wei Zhouab,
Kai Feng *ac,
Hongzhang Zhanga,
Xianfeng Li
 ac and
Huamin Zhang*ac
aDivision of Energy Storage, Dalian Institute of Chemical Physics, Chinese Academy of Sciences, Zhongshan Road 457, Dalian 116023, China. E-mail: fengkai17@dicp.ac.cn; zhanghm@dicp.ac.cn
bUniversity of Chinese Academy of Sciences, Beijing 100039, China
cCollaborative Innovation Center of Chemistry for Energy Materials, Dalian, 116023, China
First published on 4th August 2017
Abstract
Li3V2(PO4)3 (abbreviated as LVP) is considered as a prospective cathode material for next-generation Li ion batteries due to its high specific capacity and high operating potential. However, its low electronic conductivity and the difficulty in morphology control restrict its widespread application. Carbon coating has been proved to be an effective method for solving these problems. However, too thick a carbon layer will act as a barrier for Li+ diffusion. 3D hierarchical porous materials with unique electronic and structural properties have exhibited outstanding advantages. However, most methods employed for fabricating the hierarchical porous materials need templates and need acid or alkali to remove the template afterwards. This is detrimental to the LVP material because the LVP reacts with both acid and alkali. Here we present a rational design for a hierarchical porous LVP/C nanocomposite via a one-pot process, in which F127 molecules and the LVP colloids induce self-assembly. After high-temperature annealing, the mesoporous structure was developed due to the decomposition of the F127 and then the LVP/C clusters piled up to form stacked macropores. As a cathode for Li ion batteries, the LVP/C nanocomposite exhibited excellent cycle stability (96% capacity retention over 800 cycles) and enhanced high-rate performance (117 mA h g−1 at 20C). This method provides a new approach for synthesizing high-performance 3D hierarchical porous cathode materials used in other energy storage applications.
1. Introduction
Lithium-ion batteries (LIBs) have dominated the market of portable electronic devices and are now being considered as power sources for electric vehicles and large-scale energy storage systems, due to their durable cycle life and high energy density.1–4 However, the biggest blocking effect for further development of LIBs is the cathode materials, because they have much lower specific capacity than the anode. The first batch of commercial LIBs used LiCoO2 as the cathode material. But its high cost, toxicity and safety problems prevented its practical application in large scale appliances.5 Recently, lithium-based phosphates (e.g., Li3Fe2(PO4)3,6 Li3V2(PO4)7 and LiCoPO4)8 have offered particularly interesting possibilities as next-generation cathode materials for large-scale LIB applications. The framework of these polyanion materials is constructed of a rigid [PO4]3− network, which helps to stabilize the crystal structure of the materials. Furthermore, the incorporation of the [PO4]3− groups can also raise the working voltage by the “inductive effect”.9 Among these phosphate compounds, monoclinic Li3V2(PO4)3 (LVP) is proposed as a highly promising one, owing to its exceedingly high theoretical specific capacity (197 mA h g−1 when all three Li+ are extracted from the material lattice), high operating voltage and thermodynamically stable structure.10–13 Nevertheless, LVP still faces some challenges. Firstly, the [VO6] octahedra in LVP are separated with each other by [PO4]3− groups, resulting in low intrinsic electronic conductivity, which is a big drawback for its electrochemical performance.14–16 Secondly, the complicated synthesis process and the difficulty in morphology control are limiting its large-scale application.17,18 Carbon coating has been proved to be an effective method for solving the above problems.19,20 On the one hand, the surface carbon layer can observably improve the electronic conductivity of the LVP. On the other hand, the carbon layer could effectively control the growth of the LVP particles and keep the particles in small sizes.21–23 However, too thick a carbon layer will act as a barrier for Li+ diffusion,24 thus limiting the electrochemical performance of the material, especially at high charge–discharge rates. Contrarily, the hierarchical porous material with unique structure and electronic conductivity properties has exhibited outstanding advantages in energy storage.25,26 In the hierarchical porous architecture, the large macropores can act as electrolyte reservoirs, whilst the mesopores offer penetration channels for the electrolyte to get into the electrode materials, which is good for the contact between the electrolyte and the electrode materials, thus facilitating Li+ diffusion and reducing charge transfer resistance.27 Besides, the unique structure also acts as a rigid skeleton for active particles, thus preventing aggregation and controlling the particle in nano size. Many methods have been reported to synthesize hierarchical porous material. Hyeon, et al. have synthesized a macro–meso–micro hierarchical porous carbon by using SiO2 colloidal sol as the template.28 Yi, et al. reported a meso–macro porous carbon by adding Al2O3 hard template and the surface area of the synthesized carbon could reach 950 m2 g−1.29 However, all these methods need template removers such as acids and alkaline, which makes the synthesis process complicated, and also caused contaminations.30 Besides, the existence of a template remover may destroy the structure of the LVP, due to the fact that LVP reacts with both alkali and acid. What is more, most of these methods are only suitable for pure carbon materials or anode materials, because their elemental compositions and structural constructions are simple. But for the cathode, especially for LVP, the elemental compositions are complex, which makes structural adjustment difficult. Therefore, it is meaningful and challenging to develop a mild and simple method for synthesizing hierarchical porous LVP/C composites.31,32Herein, we present a facile synthesis of 3D hierarchical porous LVP/C nano composites (LVP-HPC) via a one-pot method. The triblock copolymer F127 is used as surfactant and pore former. The hydrophilic PEO block of F127 could be adsorbed around the LVP hydrophilic colloids, which induce a self-assembly process. During the next high-temperature annealing process, the F127 decompose along with LVP in situ crystallization. As a result, the template remover is completely avoided. The LVP crystals are wrapped in the continuous conductive porous carbon, which ensures fast electron/Li+ transfer and controls the particles in nano sizes. As cathodes for LIBs, the LVP-HPC showed outstanding long-term cycle stability and high-rate performance compared to the simple carbon-coated LVP sample.
2. Experimental
2.1 Sample synthesis
The LVP-HPC was prepared with a facile sol–gel method. Firstly, NH4VO3 and citric acid were dissolved in deionized water at 80 °C with continuous stirring to prepare the VOC2O4 sols. Secondly, Li2CO3 and H3PO4 were added into the prepared VOC2O4 sols to form the LVP precursor sols. Thirdly, the precursor sols were impregnated into the F127 colloidal sol to form a homogeneous gel through intense stirring for 4 h and then the gel was dried at 100 °C for 24 h. Finally, the dried gel was first heated at 350 °C in a tube furnace under flowing Ar for 4 h to expel H2O. The resulting powder was then annealed at 750 °C for 10 h under the Ar atmosphere. During the high-temperature annealing process, the mesoporous structure was developed due to the decomposition of the F127 and then the LVP/C clusters formed stacked macropores. At the same time, LVP was crystallized in situ. Finally, a LVP-HPC nano composite was obtained without any subsequent treatments. For comparison, LVP–C was also prepared by the same method, but without the adding of the F127.2.2 Materials characterization
Powder X-ray diffraction (XRD) using Cu Kα radiation was employed to identify the crystalline phase of the samples. The experiments were performed by using the step mode with a step size of 0.02° in the 2θ range of 10–90°. Brunauer–Emmett–Teller (BET) surface area was measured by analysis of N2 adsorption–desorption isotherms, using the BET analyzer (BET, AutoSorbiQ2). Pore size distribution was obtained from the adsorption branches of the isotherms by the Barrett–Joyner–Halenda (BJH) method. A scanning electron microscope (SEM, JEO 4800) and a transmission electron microscope (TEM, JEM-2100) were used to observe the morphology of the sample. Raman spectra were recorded with a Bruker Optics Senterra Labram spectrometer. Electronic conductivity of the powder samples were tested by a digital four point probe tester (SX1934 (SZ-82)).2.3 Electrochemical measurements
The electrochemical measurements were carried out with CR2016 coin cells with lithium foil as the anode and 1 M LiPF6 in ethylene carbonate, dimethyl carbonate and ethylmethyl carbonate (EC/DMC/EMC, 1![[thin space (1/6-em)]](https://www.rsc.org/images/entities/char_2009.gif) :
:![[thin space (1/6-em)]](https://www.rsc.org/images/entities/char_2009.gif) 1
1![[thin space (1/6-em)]](https://www.rsc.org/images/entities/char_2009.gif) :
:![[thin space (1/6-em)]](https://www.rsc.org/images/entities/char_2009.gif) 1 vol.) as electrolyte by an automatic battery tester system (Land, Wuhan, China). The cathode was prepared with 80 wt% active materials, 10 wt% super P conductive additives and 10 wt% polyvinyl difluoride (PVDF) binder pasted on an Al foil. After dried in vacuum at 120 °C, the electrode was punched into a disc (12 mm diameter). The active mass loading of the electrodes ranged from 1.5 to 2.0 mg cm−2. Celgard 2325 membrane was used to separate the cathode and the anode. Electrochemical impedance spectroscopic (EIS) spectra were recorded on a Solartron 1287 test system in the frequency range from 105 Hz to 0.1 Hz. Cyclic voltammetry (CV) curves were conducted by an electrochemical work station (CHI600).
1 vol.) as electrolyte by an automatic battery tester system (Land, Wuhan, China). The cathode was prepared with 80 wt% active materials, 10 wt% super P conductive additives and 10 wt% polyvinyl difluoride (PVDF) binder pasted on an Al foil. After dried in vacuum at 120 °C, the electrode was punched into a disc (12 mm diameter). The active mass loading of the electrodes ranged from 1.5 to 2.0 mg cm−2. Celgard 2325 membrane was used to separate the cathode and the anode. Electrochemical impedance spectroscopic (EIS) spectra were recorded on a Solartron 1287 test system in the frequency range from 105 Hz to 0.1 Hz. Cyclic voltammetry (CV) curves were conducted by an electrochemical work station (CHI600).
3. Results and discussion
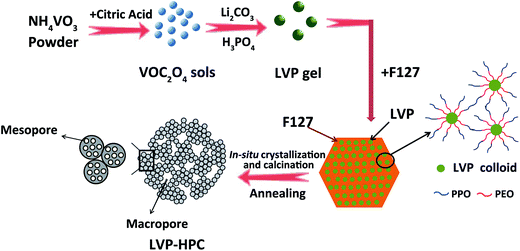
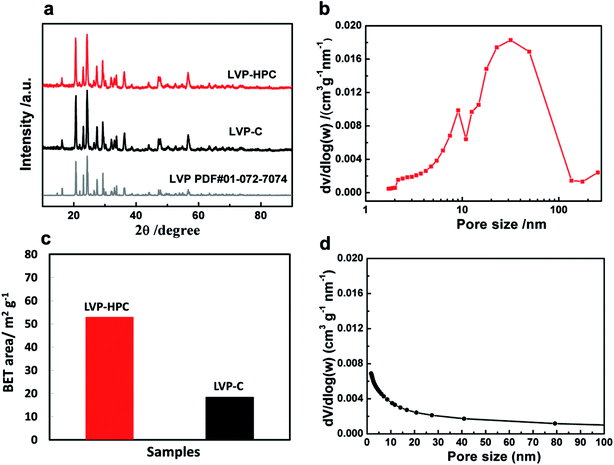
Fig. 1 schematically illustrates the formation procedures of the LVP-HPC. Firstly, VOC2O4 sols were prepared by dissolving NH4VO3 and citric acid in deionized water at 80 °C. Secondly, a mixed Li2CO3 and NH4H2PO4 solution was added into the prepared VOC2O4 sols to form LVP hydrophilic homogeneous colloids. The core of the F127 molecule was the hydrophobic PPO block and the shell of the molecule was composed of the PEO block that could be protonated.33 When F127 was introduced, the hydrophilic PEO block was adsorbed around the LVP hydrophilic colloids and the PPO block was outward, which could induce a self-assembly process and resulted in a uniform nano morphology. Finally, in the high-temperature annealing process, F127 decomposed to form abundant mesopores and LVP was crystallized in situ. At the same time, the LVP/C clusters piled up to form stacked macropores. Finally, the hierarchical porous structure was developed.Fig. 2a shows the X-ray diffraction (XRD) patterns of the samples. It can be seen that the samples all have high degree of crystalline after annealing and all diffraction peaks are indexed to the monoclinic LVP phase (space group: P21/n) (JCPDS no. 01-072-7074),34,35 suggesting high purity of the samples. The definite porous structure of the LVP samples was analyzed via the Brunauer–Emmett–Teller (BET) method. As shown in Fig. 2b, pores sizes in the LVP-HPC are mainly below 10 nm and there are also some macropores with sizes below 100 nm. However, the LVP–C sample exhibited unobvious pore distribution with pore volume of only 0.08 cm3 g−1, as listed in Table 1. Fig. 2c displays that the BET surface area of the LVP-HPC is 53.2 m2 g−1, whereas the LVP–C only has a surface area of 18.4 m2 g−1. These XRD and BET results confirmed that desirable single-phase monoclinic LVP structure and a well-defined hierarchical porous architecture have been successfully fabricated in the LVP-HPC.
| Samples | BET surface area (m2 g−1) | Total pore volume (cm3 g−1) |
|---|---|---|
| LVP-HPC | 53.22 | 0.14 |
| LVP–C | 18.47 | 0.08 |
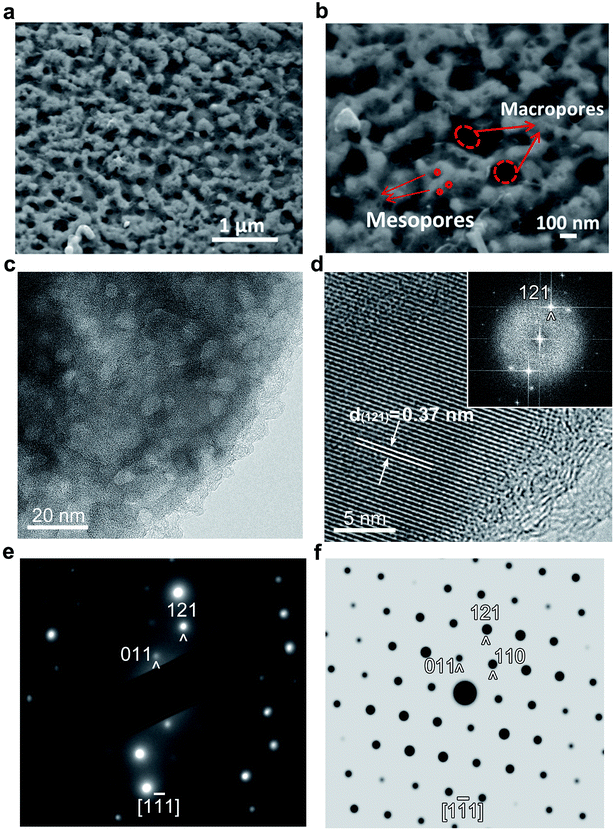
The morphology and microstructure of the LVP-HPC were investigated by SEM and TEM. The uniform morphology and the abundant macropores observed in the low-magnification image (Fig. 3a) demonstrate the successful construction of a porous LVP/C composite through the introducing of the F127. The higher magnification SEM image (Fig. 3b) exhibits a more complicated nanostructure. The composite is made up of numerous LVP/C clusters between which macropores are formed, and the LVP/C clusters are further made up of LVP and abundant mesoporous carbon. Also, mesopores can be clearly seen from the TEM images. Fig. 3c shows that abundant mesopores are uniformly distributed in the LVP-HPC and the pore size is about 8–10 nm, which is consistent with the result of BET. The high-resolution TEM (HRTEM) image (Fig. 3d) displays a lattice fringe with d-spacing of 0.37 nm, corresponding to the (121) planes of monoclinic LVP crystals. Fig. 3e is the corresponding selected area electron diffraction (SAED) pattern. The sharp diffraction spots reflect that the as-synthesized sample is well-crystallized and the diffraction pattern can be definitely indexed to the LVP phase (JCPDS no. 01-072-7074). But the view direction is slightly deviated from the [1![[1 with combining macron]](https://www.rsc.org/images/entities/char_0031_0304.gif) 1] orientation compared with the simulated diffraction pattern (Fig. 3f). On the contrary, the reference sample LVP–C is aggregated severely (Fig. S1†) and there is no porous structure existing. The SEM and TEM images proved that a hierarchical porous structure with macropores and abundant micropores is formed. The macropores can act as electrolyte reservoirs and the mesopores are extended into the particles, thus making sure that every LVP particle can be immersed in the electrolyte, leading to a good contact between the electrode materials and the electrolyte.
1] orientation compared with the simulated diffraction pattern (Fig. 3f). On the contrary, the reference sample LVP–C is aggregated severely (Fig. S1†) and there is no porous structure existing. The SEM and TEM images proved that a hierarchical porous structure with macropores and abundant micropores is formed. The macropores can act as electrolyte reservoirs and the mesopores are extended into the particles, thus making sure that every LVP particle can be immersed in the electrolyte, leading to a good contact between the electrode materials and the electrolyte.
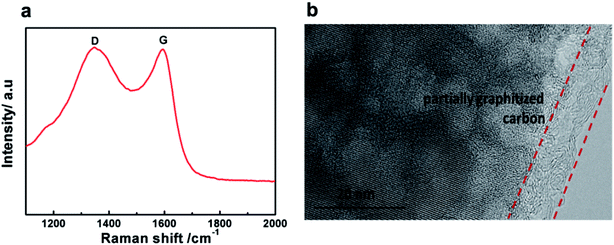
Raman spectra were recorded to study the nature of the carbon formed in the LVP-HPC sample. As shown in Fig. 4a, the pattern shows two broad peaks at around 1350 cm−1 and 1590 cm−1, which are due to D bands and G bands of carbonaceous materials, respectively. The D band is due to the A1g mode that is related to the breakage of symmetry at the edges of graphite carbon, and the G band of carbonaceous materials is attributed to the E2g zone center mode of crystalline graphite. The relative intensity of the D and G bands, ID/IG, provides useful information on the crystallinity of carbonaceous materials.36 The ID/IG value of the LVP-HPC is about 0.91, indicating that the porous carbon is partially graphitized. And the graphitized carbon can also be seen from the TEM images, as shown in Fig. 4b. The graphitized carbon can offer good electron conductivity for LVP. The carbon content of the LVP-HPC is about 6.1%, as seen from the TG curve (Fig. S2†).
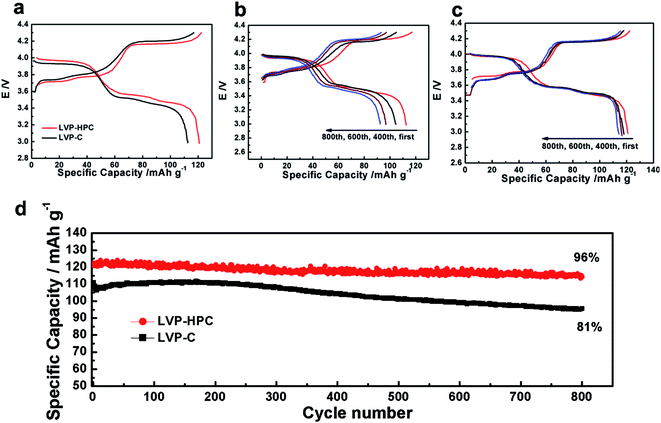
The initial charge–discharge curves of the samples are shown in Fig. 5a. When charged to 4.3 V, all the electrodes exhibited three charge flat plateaus and correspondingly three discharge plateaus, which were due to two Li+ extraction/insertion during the charge and discharge process. Each voltage platform owns to series of reversible electrochemical reactions (eqn (1–3)).9,11
| Li3V2(PO4)3 ↔ Li2.5V2(PO4)3 + 0.5Li+ + 0.5e− | (1) |
| Li2.5V2(PO4)3 ↔ Li2V2(PO4)3 + 0.5Li+ + 0.5e− | (2) |
| Li2V2(PO4)3 ↔ LiV2(PO4)3 + Li+ + e− | (3) |
The extraction of the first Li atom involves two steps due to the existence of an ordered phase of the Li2.5V2(PO4)3,37 which occurs at 3.6 and 3.7 V vs. Li/Li+. The subsequent one Li extraction (4.1 V vs. Li/Li+) corresponds to a two-phase process of Li2V2(PO4)3/LiV2(PO4)3. Fig. 5a shows that the first discharge specific capacity of LVP-HPC is 123 mA h g−1 at 0.5C, which is much higher than that of LVP–C (112 mA h g−1). Notably, the LVP-HPC exhibited outstanding cycle performance. When cycled at a rate of 0.5C, the LVP-HPC achieved capacity retention of nearly 96% after 800 cycles. However, the LVP–C only retained 82% of the initial capacity. In order to investigate the voltage plateau change during the cycles, the charge–discharge curves of the samples at different cycle numbers were investigated. It can be seen from Fig. 5c that the initial galvanostatic voltage profile of the LVP-HPC does not show obvious changes and the voltage difference between charge and discharge shows little increase with the increasing of cycle numbers, indicating low polarization and excellent cycle stability of the LVP-HPC electrode. But for the LVP–C, the voltage gap between charge and discharge plateaus becomes bigger and bigger and the capacities fade rapidly, as shown in Fig. 5b. The excellent cycle performance of the LVP-HPC is contributed to the fact that the stable porous structure can release volume expansion during the Li+ extraction/insertion.24,38,39
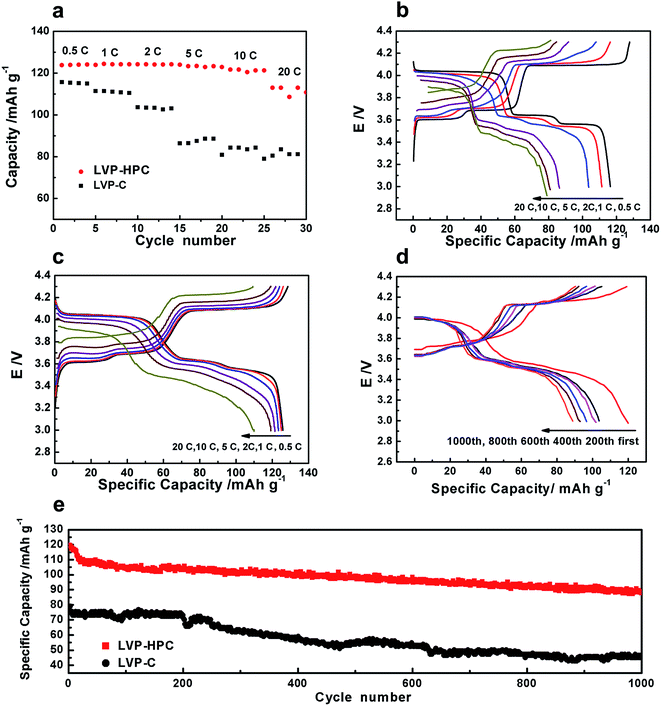
The high rate performances of the samples are shown in Fig. 6. As shown in Fig. 6a, the LVP-HPC exhibited almost no capacity fading when the rate was ≤10C. Even at 20C, a discharge specific capacity of 117 mA h g−1 was still retained, which was 96% of the initial specific capacity at 0.5C, suggesting an excellent high-rate performance. But the reference sample LVP–C showed fast capacity fading with the rate increasing and it only exhibited 80 mA h g−1 at 20C. For the purpose of evaluating the polarization of the samples, charge–discharge curves at different rates are also presented (Fig. 6c). By comparing with LVP–C (Fig. 6b), LVP-HPC showed little change of the voltage gap with rate increasing and complete discharge/charge plateaus could be clearly detected at high rates, suggesting that there was a small polarization of the LVP-HPC electrode. The outstanding rate performance of the LVP-HPC can be contributed to the fast ion diffusion and electron transfer in the unique framework.
Considering practical applications, high-rate long cycle property of the LVP-HPC was investigated. Fig. 6e shows that the LVP-HPC exhibited much better high-rate cycle performance than the reference sample. After 1000 cycles, the LVP-HPC still maintained more than 80% of the initial capacity at a high rate of 10C. However, LVP–C only exhibited the capacity retention of 57%. Fig. 6d shows the charge–discharge curves of LVP-HPC at different cycles. It can be seen that complete plateaus were still observed after 200, 400, 600, 800 and 1000 cycles, suggesting an excellent cycle stability of the LVP-HPC.
To explore the reasons for the excellent electrochemical performances of the LVP-HPC, EIS analysis and CV curves were used to investigate the kinetic properties. As shown in Fig. 7a, the Nyquist plots of the LVP-HPC and LVP–C all have a semicircle and a sloping line. The charge transfer resistance can be estimated from the semicircle in the high-middle frequency region in the EIS spectra. The value of the diameter of the semicircle on the Z′ axis is approximated to be the charge transfer resistance (Rct).40,41 As displayed in Fig. 7a, the charge transfer resistance of LVP-HPC is about 55 Ω, which is much smaller than those of the LVP–C (98 Ω). This indicates that the unique structure of the LVP-HPC indeed enhanced the charge transfer of the LVP. The electronic conductivity of the sample has been further tested by the four-point probe method. Table 2 shows that electronic conductivity of LVP-HPC is 1.82 × 10⁻⁵, much higher than those of the LVP–C (9.01 × 10⁻⁶), which further indicates that the unique porous carbon structure promoted electron transfer. The Li+ diffusion in the electrode bulk is related to sloping line in the low frequency region.42 The diffusion coefficient of the Li+ (D) can be calculated from the following equations:
| D = R2T2/2A2F4n4C2σ2 | (4) |
| Z′ = Re + Rct + σω−1/2 | (5) |
| Ip = 2.6 × 10⁵n3/2D1/2ACov1/2 |
 | ||
| Fig. 7 (a) Electrochemical impedance spectroscopy (EIS) spectra of the LVP-HPC and LVP–C; (b) fitting lines of the Z′ and ω−1/2; (c) CV curves of LVP-HPC and LVP–C. | ||
| Samples | Rct (Ω) | σ | DLi+ (cm2 s−1)/EIS | Electronic conductivity (S cm−1) |
|---|---|---|---|---|
| a Rct: charge transfer resistance. σ: Warburg factor. DLi+: diffusion coefficient of Li+. | ||||
| LVP-HPC | 55 | 20.36 | 2.26 × 10⁻¹² | 9.0 × 10⁻⁶ |
| LVP–C | 98 | 42.73 | 5.12 × 10⁻¹³ | 1.82 × 10⁻⁵ |
Based on the above results, the long-term cycle performance and high-rate performance of the LVP-HPC can be attributed to three factors. Firstly, the highly conductive porous carbon framework decreased the electron transfer resistance; simultaneously, the microporous and mesoporous bi-channels provided rapid Li ion diffusion pathways. The good electron/ion transport pathways greatly facilitated the Li+ diffusion and reduced the Rct, resulting in excellent rate performance. Secondly, the large surface area (53 m2 g−1) and pore volume increased the electrode–electrolyte contact area, thus providing more active sites for electrochemical reactions. Thirdly, the hierarchical porous structure reduced self-aggregation of LVP particles, and the stable porous structure could rapidly accommodate the volume change during the Li+ extraction/insertion, leading to a remarkable long cycle life.
4. Conclusions
In summary, we present here a mild and simple synthesis approach of 3D hierarchical porous LVP/C nano composites. The porous structure is directly resulting from decomposition of the F127, accompanying with the crystallization of LVP. Such a hierarchical porous architecture can provide fast electron/ion pathways as well as large electrode–electrolyte contact areas for fast Li+ diffusion and electron transfer. Simultaneously, the porous structure can effectively release volume expansion during the charge–discharge process. All these advantages can render excellent electrochemical performances. As an electrode material, the LVP-HPC retained 96% capacity of the initial capacity after 800 cycles. Even at a high rate of 20C, it could also delivers 117 mA h g−1, which was almost 94% of the capacity at a low rate of 0.5C. This kind of novel hierarchical micro–mesoporous nano structure and the effective synthesis strategy can be further used for preparing the other cathode materials with high performance.Conflict of interest
There are no conflicts of interest to declare.Acknowledgements
The authors acknowledge the financial supports from National Natural Science Foundation of China (No. 51403209, 51677176, 51673199, 21406221, 21501171), CAS Open Lab Foundation (FCLT201602), Youth Innovation Promotion Association of CAS (2015148), Youth Innovation Foundation of DICP (ZZBS201615), and Dalian Science and Technology Star Program (2016RQ026).Notes and references
- R. Zhang, Y. Zhang, K. Zhu, F. Du, Q. Fu, X. Yang, Y. Wang, X. Bie, G. Chen and Y. Wei, ACS Appl. Mater. Interfaces, 2014, 6, 12523–12530 CAS.
- Y. Gogotsi and P. Simon, Science, 2011, 334, 917–918 CrossRef CAS PubMed.
- J. B. Goodenough and K.-S. Park, J. Am. Chem. Soc., 2013, 135, 1167–1176 CrossRef CAS PubMed.
- X. Miao, H. Ni, H. Zhang, C. Wang, J. Fang and G. Yang, J. Power Sources, 2014, 264, 147–154 CrossRef CAS.
- E. Antolini, Solid State Sci., 2004, 170, 159–171 CAS.
- J. Wang, J. Yang, Y. Tang, R. Li, G. Liang, T.-K. Sham and X. Sun, J. Mater. Chem. A, 2013, 1, 1579–1586 CAS.
- D. Li, M. Tian, R. Xie, Q. Li, X. Fan, L. Gou, P. Zhao, S. Ma, Y. Shi and H.-T.-H. Yong, Nanoscale, 2014, 6, 3302–3308 RSC.
- Q. D. Truong, M. K. Devaraju, T. Tomai and I. Honma, ACS Appl. Mater. Interfaces, 2013, 5, 9926–9932 CAS.
- A. Yamada, S. C. Chung and K. Hinokuma, J. Electrochem. Soc., 2001, 148, A224–A229 CrossRef CAS.
- L. Mai, S. Li, Y. Dong, Y. Zhao, Y. Luo and H. Xu, Nanoscale, 2013, 5, 4864–4869 RSC.
- J. Kim, J. K. Yoo, Y. S. Jung and K. Kang, Adv. Energy Mater., 2013, 3, 1004–1007 CrossRef CAS.
- J. Su, X.-L. Wu, J.-S. Lee, J. Kim and Y.-G. Guo, J. Mater. Chem. A, 2013, 1, 2508–2514 CAS.
- W. Duan, Z. Hu, K. Zhang, F. Cheng, Z. Tao and J. Chen, Nanoscale, 2013, 5, 6485–6490 RSC.
- H. Huang, S. C. Yin, T. Kerr, N. Taylor and L. F. Nazar, Adv. Mater., 2002, 14, 1525–1528 CrossRef CAS.
- S. Lee and S. S. Park, J. Phys. Chem. C, 2012, 116, 25190–25197 CAS.
- S. C. Yin, H. Grondey, P. Strobel, M. Anne and L. F. Nazar, J. Am. Chem. Soc., 2003, 125, 10402–10411 CrossRef CAS PubMed.
- G. Yang, H. Liu, H. Ji, Z. Chen and X. Jiang, J. Power Sources, 2010, 195, 5374–5378 CrossRef CAS.
- X. Du, W. He, X. Zhang, Y. Yue, H. Liu, X. Zhang, D. Min, X. Ge and Y. Du, J. Mater. Chem., 2012, 22, 5960–5969 RSC.
- G. Yang, H. Ni, H. Liu, P. Gao, H. Ji, S. Roy, J. Pinto and X. Jiang, J. Power Sources, 2011, 196, 4747–4755 CrossRef CAS.
- H. Liu, G. Yang, X. Zhang, P. Gao, L. Wang, J. Fang, J. Pinto and X. Jiang, J. Mater. Chem., 2012, 22, 11039–11047 RSC.
- B. Pei, Z. Jiang, W. Zhang, Z. Yang and A. Manthiram, J. Power Sources, 2013, 239, 475–482 CrossRef CAS.
- S. Wang, Z. Zhang, Z. Jiang, A. Deb, L. Yang and S.-i. Hirano, J. Power Sources, 2014, 253, 294–299 CrossRef CAS.
- L. Wang, Y. Li, Z. Han, L. Chen, B. Qian, X. Jiang, J. Pinto and G. Yang, J. Mater. Chem. A, 2013, 1, 8385–8397 CAS.
- R. Zhang, Y. Zhang, K. Zhu, F. Du, Q. Fu, X. Yang, Y. Wang, X. Bie, G. Chen and Y. Wei, ACS Appl. Mater. Interfaces, 2014, 6, 12523–12530 CAS.
- T. J. Kempa, R. W. Day, S.-K. Kim, H.-G. Park and C. M. Lieber, Energy Environ. Sci., 2013, 6, 719–733 CAS.
- A. I. Hochbaum, R. Chen, R. D. Delgado, W. Liang, E. C. Garnett, M. Najarian, A. Majumdar and P. Yang, Nature, 2008, 451, 163–167 CrossRef CAS PubMed.
- J. Yang, X.-y. Zhou, Y.-l. Zou and J.-j. Tang, Electrochim. Acta, 2011, 56, 8576–8581 CrossRef CAS.
- S. B. Yoon, K. Sohn, J. Y. Kim, C. H. Shin, J. S. Yu and T. Hyeon, Adv. Mater., 2002, 14, 19–21 CrossRef CAS.
- P. Kim, J. B. Joo, W. Kim, S. K. Kang, I. K. Song and J. Yi, Carbon, 2006, 44, 389–392 CrossRef CAS.
- A. Pan, H. B. Wu, L. Yu and X. W. D. Lou, Angew. Chem., Int. Ed., 2013, 125, 2282–2286 CrossRef.
- L.-Q. Mai, A. Minhas-Khan, X. Tian, K. M. Hercule, Y.-L. Zhao, X. Lin and X. Xu, Nat. Commun., 2013, 4, 2932 Search PubMed.
- L. Shen, X. Zhang, E. Uchaker, C. Yuan and G. Cao, Adv. Energy Mater., 2012, 2, 691–698 CrossRef CAS.
- S. Peng, J.-Y. Lin, M.-H. Cheng, C.-W. Wu and I. M. Chu, Mater. Sci. Eng., C, 2016, 69, 421–428 CrossRef CAS PubMed.
- R. von Hagen, A. Lepcha, S. Xuefeng, W. Tyrra and S. Mathur, Nano Energy, 2013, 2, 304–313 CrossRef CAS.
- Y. Cheng, X. Ni, K. Feng, H. Zhang, X. Li and H. Zhang, J. Power Sources, 2016, 326, 203–210 CrossRef CAS.
- Z. Jian, W. Han, X. Lu, H. Yang, Y. S. Hu, J. Zhou, Z. Zhou, J. Li, W. Chen and D. Chen, Adv. Energy Mater., 2013, 3, 156–160 CrossRef CAS.
- W. F. Howard and R. M. Spotnitz, J. Power Sources, 2007, 165, 887–891 CrossRef CAS.
- H. Liu, D. Su, R. Zhou, B. Sun, G. Wang and S. Z. Qiao, Adv. Energy Mater., 2012, 2, 970–975 CrossRef CAS.
- Y. Shi, C. Hua, B. Li, X. Fang, C. Yao, Y. Zhang, Y. S. Hu, Z. Wang, L. Chen and D. Zhao, Adv. Funct. Mater., 2013, 23, 1832–1838 CrossRef CAS.
- C. Deng, S. Zhang, S. Yang, Y. Gao, B. Wu, L. Ma, B. Fu, Q. Wu and F. Liu, J. Phys. Chem. C, 2011, 115, 15048–15056 CAS.
- Y. Cheng, K. Feng, W. Zhou, H. Zhang, X. Li and H. Zhang, Dalton Trans., 2015, 44, 17579–17586 RSC.
- J. Huang, L. Yang, K. Liu and Y. Tang, J. Power Sources, 2010, 195, 5013–5018 CrossRef CAS.
- S.-C. Yin, H. Grondey, P. Strobel, M. Anne and L. F. Nazar, J. Am. Chem. Soc., 2003, 125, 10402–10411 CrossRef CAS PubMed.
- K. Feng, Y. Cheng, M. Wang, H. Zhang, X. Li and H. Zhang, J. Mater. Chem. A, 2015, 3, 19469–19475 CAS.
- H. Wang, Y. Li, C. Huang, Y. Zhong and S. Liu, J. Power Sources, 2012, 208, 282–287 CrossRef CAS.
Footnote |
| † Electronic supplementary information (ESI) available. See DOI: 10.1039/c7ra06706b |
| This journal is © The Royal Society of Chemistry 2017 |

