DOI:
10.1039/C7RA06696A
(Paper)
RSC Adv., 2017,
7, 41403-41418
CuII complex of emodin with improved anticancer activity as demonstrated by its performance on HeLa and Hep G2 cells†
Received
15th June 2017
, Accepted 8th August 2017
First published on 24th August 2017
Abstract
Emodin, a hydroxy-9,10-anthraquinone, resembles anthracycline anticancer drugs at the core and possesses anticancer activities. A CuII complex of emodin [CuII(emod)2]2− was synthesized and its crystal structure was determined by Rietveld refinement of the PXRD data by using an appropriate structural model based on spectroscopy. This is the third report on the crystal structure of a hydroxy-9,10-anthraquinone with a 3d-transition metal ion. Since the formation of reactive oxygen species (ROS) by anthracycline-based anticancer drugs is important for antitumor activity and given the fact that the generation of ROS is responsible for cardiotoxic side effects, it is essential to be able to control their formation. Complex formation decreases ROS generation and could thereby lead to a decrease in cardiotoxic side effects. However, in an attempt to decrease complications, there is also the possibility of compromising the therapeutic efficacy. For this reason, the activities of emodin and its modified form [Cu(II) complex] were studied on the carcinoma cell lines HeLa and Hep G2 to see how they compared with each other in terms of performance. Studies were also performed on WI 38 lung fibroblast normal cells. The studies revealed that, in spite of the decreased ROS formation, followed by the DCFDA assay, the Cu(II) complex showed better activity on carcinoma cell lines. This suggests that the complex has other attributes that enable it to perform better than emodin. Consequently, one such attribute, namely DNA binding, was thoroughly investigated by varying the ionic strength and the temperature of the medium. It was found that the complex was able to bind DNA better than emodin, and, more importantly, since both generate a good amount of anionic species in solution under increased ionic strength of the medium, both bind DNA better; the increase in binding with increase in ionic strength being higher for the complex. The study suggests that with a substantial decrease in ROS generation by the complex, there are likely to be less toxic side effects, which is a key advantage of the complex, leading to an improvement in the therapeutic index. The complex showed almost no activity on WI 38 normal cells.
1. Introduction
Cu is a key essential trace element in biological systems.1–6 Both monovalent and divalent forms of Cu are important with regard to different aspects of the life cycle of a cell.1–4 In cancer, for example, both Cu(II) and Cu(I) compounds are reported to influence the functioning in cells to a much greater extent than other metal ions.6–10 Cancer cells desperately try to procure copper, with copper being intricately involved in several processes that help such cells to proliferate and survive.6–10 For this reason, studies on a contemporary approach to cancer chemotherapy tend to observe, learn, and utilize the hints or clues provided by cancer cells with regard to their likes and dislikes, in order to be able to use the information against such cells in the treatment of the disease.3,6–10 Decreasing the bio-availability of copper for example, has been used as an anti-angiogenic and anticancer strategy with very impressive results.11 Most often, the full potential of an anticancer agent is not realized owing to problems related to cellular uptake.9–12 When this is addressed, the molecule is known to play havoc and could increase its efficacy many times higher. An interesting approach therefore is to link an established anticancer agent with a copper ion by forming an inorganic complex.13 By this, the cellular uptake could be increased since cancer cells interested in procuring copper ions prepare to take the compound in by developing an affinity for it.9–15 In the process, the anticancer agent linked to the metal ion is able to enter the cancer cell much more easily than on its own and can then initiate cell damage, thus showing anticancer activity.16–18 Once within the cell, this happens for the anticancer agent in a state bound to the metal ion or by dissociating from it inside the cell.16 Thus, by using a copper complex of an anticancer agent, the cell can be tempted to procure copper ions, thereby in the process assimilating the anticancer agent that will eventually kill it by disturbing one or more of the cellular pathways that help these cells to survive.16–18,20 Besides, the complexes have various other attributes that are most often not known for the ligand (the anticancer agent). Owing to this, their efficacy far exceeds that of the anticancer agent itself.16–20 This is one of the major reasons why copper complexes of anticancer agents have been so successful and shown superior anticancer activity to the anticancer agent itself, the one from which the complex was prepared.6,9,10,16–18,20 In the majority of cases, once inside the cell, it is the anticancer agent present in the complex that is beneficial for the anticancer action. However, its increased presence in the cell, an important criterion for efficacy, is because the copper complex has enhanced its cellular uptake.16–18
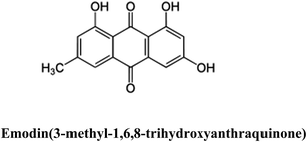
Emodin, a hydroxy-9,10-anthraquinone, is an effective anticancer agent, which closely resembles the core of anthracyclines (doxorubicin, daunorubicin, carminomycin, nogalamycin, to name a few).21–26 As part of our continuing effort to simplify anthracyclines and to improve their established anticancer activity, we decided to prepare a Cu(II) complex of emodin for the reasons mentioned above.16,18–20,24–33 Complexes of emodin have been prepared before but few researchers attempted to see if the metal-bound emodin was able to improve upon its existing attributes as an anticancer agent.34 This study tries to show by comparison that the complex formation of emodin is beneficial, as well as discusses aspects related to the structure, structure–activity relationships, biophysical interactions with DNA that were performed at different ionic strengths and temperatures, and a probable mechanism of action for emodin and its Cu(II) complex on cancer cells pertaining to the generation of reactive oxygen species (ROS).
A novel aspect of the present study was also to assess the structure of the complex obtained from powder X-ray diffraction data and to evaluate thermodynamic parameters related to the interaction of emodin and its Cu(II) complex with calf thymus DNA and the lack of stimulated ROS generation by the complex. The structure is novel since structures of metal complexes of hydroxy-9,10-anthraquinones are rare; there being only one report so far from a single crystal X-ray diffraction study.35 This one is the third structure of a metal complex of a hydroxy-9,10-anthraquinone with a 3d transition metal ion.16,36 A thermodynamic study was carried out to allow us to explain the trends observed in the binding of emodin and the complex with calf thymus DNA, which enables us to put our results in a proper perspective with that of established anthracyclines and their complexes. The reported decrease in ROS generation by the complex is important as it indicates that the complex might be less cardiotoxic.37,38
2. Experimental
2.1 Materials and instruments
Emodin (3-methyl-1,6,8-trihydroxyanthraquinone) was purchased from Sigma-Aldrich, USA, and purified by re-crystallization from methanol. Copper(II) nitrate, sodium bicarbonate, sodium chloride, methanol, and dimethyl sulfoxide were purchased from E. Merck, India. Tris buffer [tris(hydroxy methyl)amino methane] was obtained from Spectro Chem. (India) Pvt. Ltd. Calf thymus DNA was purchased from Sisco Research Laboratory, India. The calf thymus DNA was dissolved in triple distilled water and allowed to stand for 24 h. A molar extinction coefficient of 6600 M−1 cm−1 at 260 nm was used to determine the concentration of the DNA in solution. Absorbance was also measured at 280 nm and the ratio A260/A280 was found to be in the range 1.8 to 1.9. This indicated that no further purification for protein removal was required and that the DNA could be used as such. The quality of calf thymus DNA was also verified from the circular dichroism (CD) spectrum recorded at 260 nm using a CD spectropolarimeter (J815, JASCO, Japan). Tris buffer was prepared in triple distilled water.
2.2 Methods
2.2.1 Synthesis of the CuII complex of emodin. The stoichiometry of complex formation between CuII and emodin was determined with the help of the mole-ratio and Job's method of continuous variation (Fig. S1a and b in the ESI†). The complex was prepared by mixing Cu(II) nitrate (in water) and emodin (in methanol) in the ratio 1![[thin space (1/6-em)]](https://www.rsc.org/images/entities/char_2009.gif) :
:![[thin space (1/6-em)]](https://www.rsc.org/images/entities/char_2009.gif) 2, with adjusting the pH to approximately 6.0 using sodium bicarbonate. The mixture was stirred for 1 h at 40 °C and then allowed to stand overnight. A reddish brown solid was formed, which was filtered and washed with a 10% hot methanol–water mixture. The product was dried in a vacuum dessicator. Changes in the UV-Vis spectrum (Fig. S2, ESI†) were recorded on a JASCO V-630 spectrophotometer. IR spectra [Fig. S3, emodin; Fig. S4, the Cu(II) complex, ESI†] were recorded on a Perkin Elmer Spectrum Two FTIR spectrophotometer that suggested complex formation. Mass spectra (Fig. S5, ESI†) were recorded on a Micromass Q-Tofmicro™, Waters Corporation, while TGA (Fig. S6, ESI†) was performed using a MettlerToledo TGA/SDTA 851e, which provided further evidence in favor of complex formation. Magnetic susceptibility measurements of the powdered samples at room temperature (298 K) were recorded by the Gouy method using a Magway MSB MK1, Sherwood Scientific Ltd. The EPR spectrum of the complex (Fig. S7, ESI†) showing a g value of 2.058 was recorded on a JEOL JES-FA 200 ESR. Specifically for the analyses: UV-Vis spectra: λmax at 536 nm; MS (m/z): 600.9 considering 63Cu and 601.48 considering 65Cu [M]+.
2, with adjusting the pH to approximately 6.0 using sodium bicarbonate. The mixture was stirred for 1 h at 40 °C and then allowed to stand overnight. A reddish brown solid was formed, which was filtered and washed with a 10% hot methanol–water mixture. The product was dried in a vacuum dessicator. Changes in the UV-Vis spectrum (Fig. S2, ESI†) were recorded on a JASCO V-630 spectrophotometer. IR spectra [Fig. S3, emodin; Fig. S4, the Cu(II) complex, ESI†] were recorded on a Perkin Elmer Spectrum Two FTIR spectrophotometer that suggested complex formation. Mass spectra (Fig. S5, ESI†) were recorded on a Micromass Q-Tofmicro™, Waters Corporation, while TGA (Fig. S6, ESI†) was performed using a MettlerToledo TGA/SDTA 851e, which provided further evidence in favor of complex formation. Magnetic susceptibility measurements of the powdered samples at room temperature (298 K) were recorded by the Gouy method using a Magway MSB MK1, Sherwood Scientific Ltd. The EPR spectrum of the complex (Fig. S7, ESI†) showing a g value of 2.058 was recorded on a JEOL JES-FA 200 ESR. Specifically for the analyses: UV-Vis spectra: λmax at 536 nm; MS (m/z): 600.9 considering 63Cu and 601.48 considering 65Cu [M]+.
2.2.2 Physicochemical studies on emodin and the formation of the Cu(II) complex. The pH-metric titration of emodin was performed in the pH range 3.0 to 12.0 in the absence and presence of CuII. For titrations performed in the presence of CuII, the metal ion and emodin were taken in the ratio 1![[thin space (1/6-em)]](https://www.rsc.org/images/entities/char_2009.gif) :
:![[thin space (1/6-em)]](https://www.rsc.org/images/entities/char_2009.gif) 2 as determined earlier by experiments on the stoichiometry (Fig. S1a and b, ESI†). Changes in absorbance at 525 nm for emodin alone (Fig. S8, ESI†) and at 536 nm in the presence of CuII (Fig. 1) were fitted to eqn (1) below.
2 as determined earlier by experiments on the stoichiometry (Fig. S1a and b, ESI†). Changes in absorbance at 525 nm for emodin alone (Fig. S8, ESI†) and at 536 nm in the presence of CuII (Fig. 1) were fitted to eqn (1) below.| | |
Aobs = A1/(1 + 10pH−pK1 + 10pH−pK2 + 10pH−pK3) + A2/(1 + 10pK1−pH + 10pH−pK2 + 10pH−pK3) + A3/(1 + 10pK1−pH + 10pK2−pH + 10pH−pK3) + A4/(1 + 10pK1−pH + 10pK2−pH + 10pK3−pH)
| (1) |
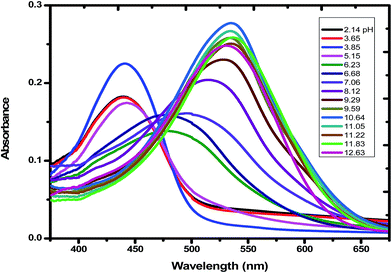 |
| | Fig. 1 Absorption spectra of emodin in aqueous solution in the presence of Cu(II) at different pH. The pH of each solution is shown in the inset of the figure. Emodin = 10 μM; Cu(NO3)2 = 5 μM; NaNO3 = 0.01 M; temperature = 300 K. | |
Considering emodin as LH3, A1, A2, A3, and A4 represent the absorbance due to LH3, LH2−, LH2−, and L3−, respectively. Fitting the experimental data according to eqn (1), pK1, pK2, and pK3 were 7.11 ± 0.08, 10.37 ± 0.50, and 10.85 ± 0.89, respectively (Fig. 2a) for emodin when titrated alone and 5.73 ± 0.38, 7.39 ± 0.19, and 10.87 ± 0.74, respectively (Fig. 2b), when titrated in the presence of CuII. The sharp decrease in pK2 for emodin from 10.37 when titrated alone to 7.39 in the presence of Cu(II), corresponding to the dissociation of phenolic –OH at C1, suggests complex formation.29 The third pK of emodin remained unchanged, even in the presence of Cu(II).
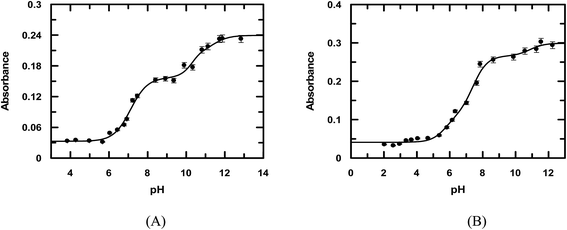 |
| | Fig. 2 pH-metric titration of emodin in the absence (A) and presence of CuII (B) as shown by the variation of absorbance at 525 nm and 536 nm, respectively. Emodin = 10 μM; Cu(II) = 5 μM; NaNO3 = 0.01 M; temperature = 300 K. The solid line is the fitted data according to eqn (1). | |
When emodin interacts with CuII following deprotonation of the phenolic –OH at C1 and the carbonyl at C9, as the phenolic –OH at C6 is already deprotonated, emodin interacts with CuII in the form LH2−. Using the pK2 of emodin obtained in the absence and presence of CuII, the formation constants β* and β were determined for the complex in solution.16,29
| | |
Cu2+ + 2LH3 ⇌ [Cu(LH)2]2− + 2H+
| (2) |
| |
 | (3) |
| | |
Cu2+ + 2LH− ⇌ {Cu(LH)2}2−
| (4) |
| |
 | (5) |
| |
 | (6) |
Using eqn (2)–(6), the effective stability constant (β) was found to be 1.0 × 10¹⁶ (log![[thin space (1/6-em)]](https://www.rsc.org/images/entities/char_2009.gif) β = 16.0).
β = 16.0).
2.3 X-ray powder diffraction measurements and the crystal structure of CuII(emod)2
Powder X-ray diffraction (PXRD) data were collected at an ambient temperature of 20 °C on a Bruker D8 Advance diffractometer operating in reflection mode with Cu Kα radiation of wavelength 1.5418 Å. The generator was set at 40 kV and 40 mA. Data were collected in the 2θ range of 4–50° (step size 0.02°) at a scan speed of 5 s per step. Indexing of the PXRD pattern was carried out using the NTREOR program of EXPO 2014.39 The indexing revealed that the complex crystallizes in a triclinic system with a = 14.394 Å, b = 11.986 Å, c = 7.044 Å and α, β, γ being 93.01°, 100.75°, and 73.93°, respectively.
The space group was obtained from statistical analysis of the powder patterns using the find space module of the EXPO 2014 software package.39 Statistical analysis showed that the most probable space group is P![[1 with combining macron]](https://www.rsc.org/images/entities/char_0031_0304.gif) . For this unit cell and space group, full pattern decompositions were performed using the Le Bail method, which gave a good fit between the calculated and experimental powder X-ray patterns. Structure solutions from the PXRD data were carried out using the simulated annealing technique (parallel tempering mode) as implemented in the program FOX,40 a Monte Carlo-based software package. The initial molecular structural model was first drawn using ACD/Chem Sketch. The geometry of the structure was then optimized with the help of MOPAC 2016 to arrive at the reference structural model for FOX.41 After going through a large number of successful cycles, we obtained the atomic coordinates from FOX. These were used as the input for the starting model for Rietveld structure refinement through the program GSAS42 with the EXPGUI43 interface. Peak shapes were described as pseudo-Voigt functions, while the backgrounds were fitted by the shifted Chebyshev function of the first kind with 36 points regularly distributed over the entire 2θ range. Initially the lattice parameters, the profile parameters, and the background coefficients were refined. After applying the soft constraints on the bond lengths and bond angles and planar restraints on the aromatic rings, the positions of the atoms were refined. Fixed isotropic displacement parameters of 0.04 Å2 for non-hydrogen atoms and 0.06 Å2 for hydrogen atoms were maintained. At the final stage of refinement, the preferred orientation correction was applied using a generalized spherical harmonic model. The final Rietveld plot is shown in Fig. 3.
. For this unit cell and space group, full pattern decompositions were performed using the Le Bail method, which gave a good fit between the calculated and experimental powder X-ray patterns. Structure solutions from the PXRD data were carried out using the simulated annealing technique (parallel tempering mode) as implemented in the program FOX,40 a Monte Carlo-based software package. The initial molecular structural model was first drawn using ACD/Chem Sketch. The geometry of the structure was then optimized with the help of MOPAC 2016 to arrive at the reference structural model for FOX.41 After going through a large number of successful cycles, we obtained the atomic coordinates from FOX. These were used as the input for the starting model for Rietveld structure refinement through the program GSAS42 with the EXPGUI43 interface. Peak shapes were described as pseudo-Voigt functions, while the backgrounds were fitted by the shifted Chebyshev function of the first kind with 36 points regularly distributed over the entire 2θ range. Initially the lattice parameters, the profile parameters, and the background coefficients were refined. After applying the soft constraints on the bond lengths and bond angles and planar restraints on the aromatic rings, the positions of the atoms were refined. Fixed isotropic displacement parameters of 0.04 Å2 for non-hydrogen atoms and 0.06 Å2 for hydrogen atoms were maintained. At the final stage of refinement, the preferred orientation correction was applied using a generalized spherical harmonic model. The final Rietveld plot is shown in Fig. 3.
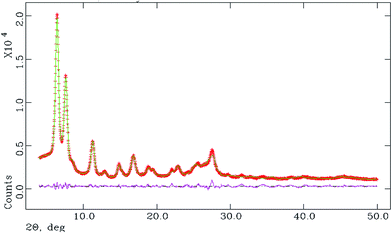 |
| | Fig. 3 Final Rietveld plot, where the red curve denotes the experimental pattern, green denotes the simulated pattern, and pink denotes the difference between the two. | |
2.4 Titration of emodin and the CuII complex with calf thymus DNA
2.4.1 At different ionic strengths of the medium. Both emodin and the complex were titrated with calf thymus DNA at different ionic strengths and the results were followed with the help of UV-visible spectroscopy. Compounds dissolved in DMSO were taken in a quartz cuvette containing 120 mM NaCl and Tris buffer with or without a definite concentration of DNA such that during the course of the titration the final volume of the solution was always 2000 μL. Concentration of the compounds was kept constant at 50 μM, while the content of calf thymus DNA was gradually increased (using a stock of strength 14![[thin space (1/6-em)]](https://www.rsc.org/images/entities/char_2009.gif) 500 μM) till saturation was reached. The results were analyzed using eqn (S1)–(S5), ESI.†16–20,29–33
500 μM) till saturation was reached. The results were analyzed using eqn (S1)–(S5), ESI.†16–20,29–33
2.4.2 At different temperatures for evaluation of the thermodynamic parameters. Titration of the compounds with DNA was performed at four different temperatures at a constant pH (∼7.87) and ionic strength of the medium. The temperature was controlled with the help of a Peltier TCC controller, Shimadzu, connected to a UV 1800 Shimadzu UV-Vis spectrophotometer (Model TCC-240A). The thermodynamic parameters, ΔH0 (van't Hoff enthalpy), ΔS0 (entropy), and ΔG0 (free energy) were determined using eqn (7)–(9).| |
ln![[thin space (1/6-em)]](https://www.rsc.org/images/entities/char_2009.gif) Kapp = (−ΔH0/RT) + (ΔS0/R) Kapp = (−ΔH0/RT) + (ΔS0/R)
| (7) |
| |
ΔG0 = −RT![[thin space (1/6-em)]](https://www.rsc.org/images/entities/char_2009.gif) ln ln![[thin space (1/6-em)]](https://www.rsc.org/images/entities/char_2009.gif) Kapp Kapp
| (8) |
where R and T are the universal gas constant and absolute temperature, respectively. The apparent binding constant [Kapp = Kd−1] was determined at different temperatures using eqn (S1)–(S5) (ESI†). A van't Hoff plot of ln![[thin space (1/6-em)]](https://www.rsc.org/images/entities/char_2009.gif) Kapp vs. 1/T gave a straight line, with ΔH0 and ΔS0 determined from the slope and intercept, respectively (eqn (7)). ΔG0 was obtained from eqn (8) and (9).44 It needs mentioning here that since we did not have access to an isothermal titration calorimeter (ITC), this prevented us from determining thermodynamic parameters that are model independent.
Kapp vs. 1/T gave a straight line, with ΔH0 and ΔS0 determined from the slope and intercept, respectively (eqn (7)). ΔG0 was obtained from eqn (8) and (9).44 It needs mentioning here that since we did not have access to an isothermal titration calorimeter (ITC), this prevented us from determining thermodynamic parameters that are model independent.
2.5 Estimation of ROS by the DCFDA assay
The cell permeant reagent 2′,7′-dichlorofluorescin diacetate (DCFDA) is a fluorogenic dye capable of measuring the activities of hydroxyl, peroxyl, and other reactive oxygen species (ROS) inside a cell.45–48 Upon diffusion in to the cell, DCFDA is de-acetylated by cellular esterases present to a non-fluorescent compound, which is later oxidized by ROS to 2′,7′-dichlorofluorescein (DCF) (another highly fluorescent compound), showing green fluorescence. This was detected using fluorescence spectroscopy. Excitation was done at 504 nm and the emission was measured at 529 nm using a spectrofluorimeter (Hitachi, Japan). A stock solution of DCFDA (10 mM) was prepared in methanol and diluted further with culture medium to a working concentration of 100 μM. Cells were seeded for 24 h prior to the start of the experiment and treated with 1× PBS (500 μL). Subsequently, ROS was induced by the free radical generator H2O2 (10 μM), incubating treated cells with it for a further 50 min. Cells treated in this manner were then treated with 25 μM emodin, [CuII(emodin)2]2−, and N-acetyl cysteine (NAC) (used as a positive control in the experiment) in a time-dependent manner starting with the well in which the compound was to be incubated for 60 min and finishing with the one in which compounds were to interact with cells for only 5 min. Compound addition was done in this manner to eventually record the fluorescence due to DCF at one time. After compound addition was over, 1× PBS was discarded. At this stage, DCFDA (100 μM) was added to the cells in all the wells, which were allowed to stand for 45 min in the dark at 37 °C. Subsequently, the cells were lysed with an alkaline solution and the fluorescence was recorded.
2.6 Cell culture and cell viability assay
Different carcinoma cell lines (HeLa and Hep G2) and a normal cell line (WI 38 lung fibroblast) procured from the National Centre for Cell Science located at Pune in India were cultured in DMEM medium (GIBCO, Invitrogen, Carlsbad, CA, US), supplemented with 10% fetal bovine serum (GIBCO) and an antibiotic mixture (1X). Cells were incubated in a humidified CO2 incubator at 37 °C and seeded in 96-well plates for 24 h prior to treatment with the compounds. After 24 h, each cell line was treated with emodin and [CuII(emod)2]2−, which were earlier dissolved in DMSO. The concentration of DMSO was less than 0.5%. Cell viability was checked 48 h after treatment with 3-(4,5-dimethylthiazol-2-yl)-2,5-diphenyltetrazolium bromide (MTT) in an assay named after it. Briefly, cells were washed with 1× PBS and treated with MTT for 4 h at 37 °C. Precipitates were dissolved in DMSO and the plates were analyzed on a Thermo MULTISKAN EX plate reader at 595 nm.
3. Results and discussion
3.1 Description of the X-ray crystal structure of C30H18O10 Cu
Structural analysis using PXRD data indicated that the CuII complex crystallizes in a monoclinic P![[1 with combining macron]](https://www.rsc.org/images/entities/char_0031_0304.gif) space group and that the asymmetric unit of the complex contains one CuII and two monoanionic LH2− units. The final crystallographic data and Rietveld refinement parameters are depicted in Table 1 and the asymmetric unit of the complex is presented in Fig. 4.
space group and that the asymmetric unit of the complex contains one CuII and two monoanionic LH2− units. The final crystallographic data and Rietveld refinement parameters are depicted in Table 1 and the asymmetric unit of the complex is presented in Fig. 4.
Table 1 Crystallographic data and Rietveld refinement parameters from the PXRD data analysis
| Formula |
C30H18CuO10 |
| Formula weight |
601.99 |
| Crystal system |
Triclinic |
| Space group |
P![[1 with combining macron]](https://www.rsc.org/images/entities/char_0031_0304.gif) |
| a/Å |
14.394(9) |
| b/Å |
11.986(6) |
| c/Å |
7.044(16) |
| α/° |
93.01(19) |
| β/° |
100.75(16) |
| γ/° |
73.93(5) |
| V/Å3 |
1147.2(27) |
| Z |
2 |
| ρcalc/g cm−3 |
1.743 |
| Temperature/K |
293 |
| Radiation/Å |
1.54184 |
| 2θ range/° |
4–50 |
| Rwp |
0.0463 |
| Rp |
0.0345 |
| χ |
2.20 |
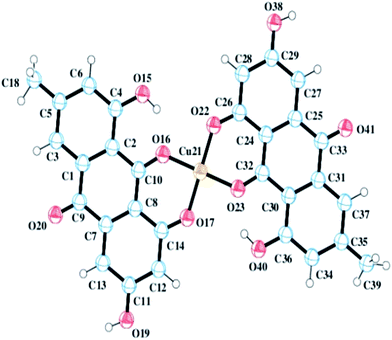 |
| | Fig. 4 A perspective view of CuII(emod)2 determined from the X-ray powder diffraction data. | |
Each CuII center showed a planar geometry having a coordination number of four. The coordination environment of CuII was satisfied by two deprotonated phenolic –OH groups (O17 and O22) of two different LH3 units and two carbonyl oxygen atoms (O16 and O23).
Selected bond lengths and bond angles are provided in Table 2. In the absence of a single crystal, we were forced to arrive at the structure of the Cu(II) complex of emodin from the X-ray powder diffraction data (CCDC number 1516190).16,35,36 We also performed thermo-gravimetric analysis, which indicated the absence of any water molecule in the structure. With the ligand itself having a planar geometry, all the evidence leads us to a planar structure, as established from the PXRD data.
Table 2 Selected bond lengths and bond angles of CuII(emod)2
| |
Bond lengths (Å) |
| Cu21–O16 |
1.735(4) |
| Cu21–O17 |
1.767(4) |
| Cu21–O22 |
1.767(4) |
| Cu21–O23 |
1.730(4) |
| |
Bond angles (°) |
| O16–Cu21–O17 |
91.61(19) |
| O16–Cu21–O22 |
88.40(19) |
| O16–Cu21–O23 |
178.39(19) |
| O17–Cu21–O22 |
176.22(19) |
| O17–Cu21–O23 |
88.38(19) |
| O22–Cu21–O23 |
91.72(19) |
3.2 Interaction of the compounds with calf thymus DNA
3.2.1 Binding of emodin and [CuII(LH)2]2− with calf thymus DNA at different ionic strengths of the medium. The titration of emodin and [CuII(LH)2]2− with calf thymus DNA was performed at five different ionic strengths of the medium to ascertain if there were any observable changes in the affinity of the compounds toward calf thymus DNA. The titration data was analyzed with the help of eqn (S1)–(S5) (ESI†).16–20,29–33 The titration results indicated a gradual decrease in absorbance upon the addition of calf thymus DNA to emodin (Fig. 5) and CuII(LH)22− (Fig. S9†). Note, the absorbance recorded at a particular point of the titration is a measure of the free form of the compound (Cf) in solution, while the change in absorbance is indicative of the compound bound to DNA (Cb).
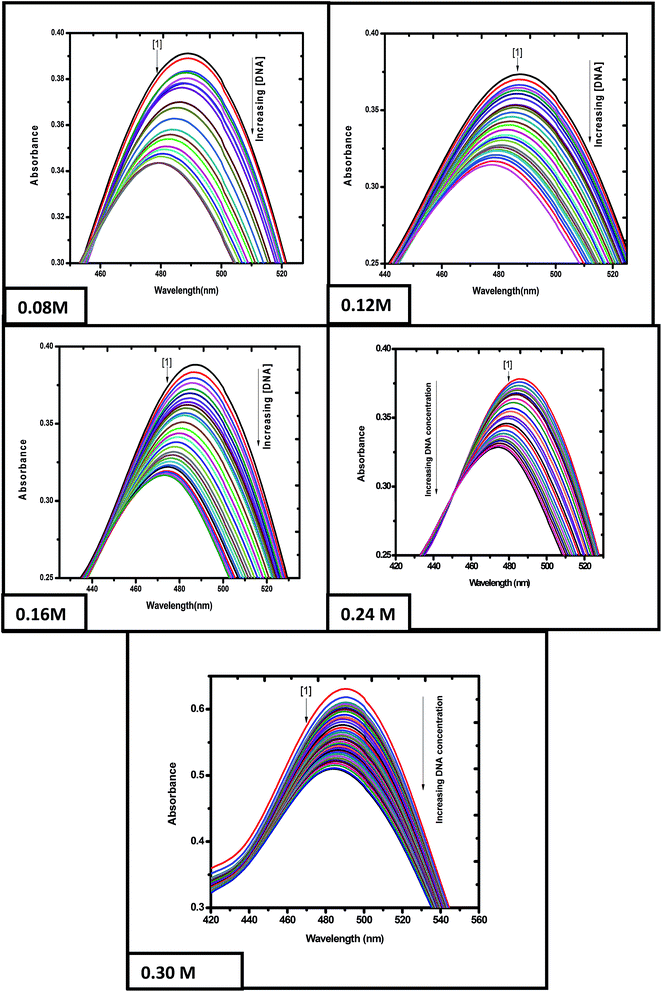 |
| | Fig. 5 Absorption spectra of emodin in the absence (1) and presence of calf thymus DNA. Spectra were recorded at different ionic strengths of the medium, showing a gradual decrease in absorbance upon adding DNA to an aqueous solution of the compound. Emodin = LH3 = 50 μM; NaCl = 120 mM; Tris buffer = 20 mM; T = 298 K. | |
Eqn (S2) (ESI†) was used to provide values for Kd and ΔAmax, i.e., the dissociation constant and the maximum change in absorbance, respectively, at each ionic strength of the medium (Fig. 6A being that for ionic strength = 0.12 M). The ratios of the changes in absorbance ΔA to ΔAmax for different ionic strengths were plotted against CD (the total concentration of calf thymus DNA in solution) and fitted to eqn (S4),† providing another set of values for Kd (Fig. 6B being a representative plot for ionic strength = 0.12 M). The inverse of Kd provides values for the apparent binding constant (Kapp) (Table 3). CL indicates the concentration of either emodin or its Cu(II) complex in solution.
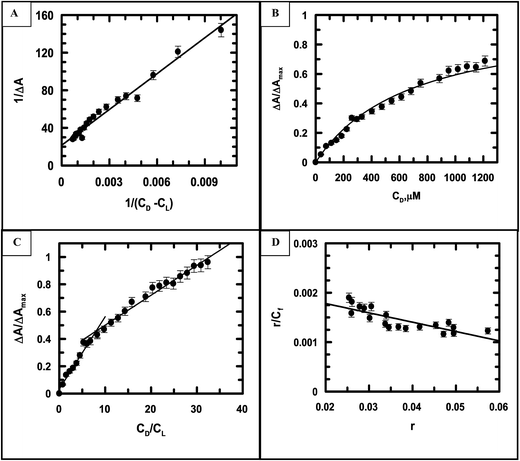 |
| | Fig. 6 (A) A double-reciprocal plot for the interaction of emodin with calf thymus DNA, leading to the evaluation of Kapp; reduced chi squared: 19. (B) Non-linear curve fitting analysis showing a plot of the normalized increase in the change of absorbance against the input concentration of DNA to evaluate the dissociation constant for the association of emodin with calf thymus DNA; reduced chi squared: 0.0006925. (C) Mole-ratio plot for the relative change in absorbance against the ratio of DNA to emodin; reduced chi squared: 0.0008547 and 0.0006546, respectively. (D) Scatchard plot for the interaction of emodin with calf thymus DNA; reduced chi squared: 1.798 × 10⁻⁸ at pH 7.87 (20 mM Tris–HCl buffer) at an ionic strength of 0.12 M. Emodin = LH3 = 50 μM; T = 298 K. | |
Table 3 Results of the binding parameters of emodin and [CuII(LH)2]2− with calf thymus DNA at different ionic strengths of the medium as studied with the help of UV-Vis spectroscopy
| Method |
Compounds |
Experimental ionic strength |
Kapp × 10−3 (M−1) from double-reciprocal plot |
Kapp × 10−3 (M−1) from non-linear curve fitting |
nb from mole ratio plot |
K′ × 10−4 (M−1) = Kapp × nb |
K′ × 10−4 (M−1) Scatchard plot |
nb Scatchard plot |
| UV-Vis |
Emodin |
0.08 |
1.28 ± 0.03 |
1.32 ± 0.13 |
8 |
1.04 |
2.40 ± 0.6 |
8.0 |
| 0.12 |
1.69 ± 0.10 |
1.67 ± 0.05 |
9 |
1.51 |
1.89 ± 0.3 |
9.0 |
| 0.16 |
2.24 ± 0.08 |
2.22 ± 0.17 |
8 |
1.86 |
2.03 ± 0.4 |
8.0 |
| 0.24 |
4.33 ± 0.04 |
3.00 ± 0.33 |
8 |
3.58 |
3.70 ± 1.5 |
8.0 |
| 0.30 |
7.20 ± 06 |
6.18 ± 0.12 |
8 |
6.69 |
5.20 ± 0.43 |
8.0 |
| Cu(emodin)2 |
0.08 |
3.30 ± 0.08 |
4.04 ± 0.33 |
20 |
7.42 |
14.32 ± 2.26 |
18.0 |
| 0.12 |
4.65 ± 0.10 |
5.49 ± 0.45 |
16 |
8.11 |
11.77 ± 5.58 |
14.0 |
| 0.20 |
7.53 ± 0.32 |
9.50 ± 1.74 |
14 |
11.92 |
12.13 ± 4.72 |
17.0 |
| 0.30 |
9.66 ± 1.03 |
6.75 ± 0.51 |
20 |
16.41 |
14.93 ± 4.19 |
10.0 |
| 0.50 |
11.25 ± 0.173 |
18.53 ± 0.001 |
18 |
26.80 |
25.98 ± 2.87 |
11.0 |
Fig. 6C indicates the site size for the interaction (nb) of emodin with calf thymus DNA at an ionic strength of 0.12 M. nb values for emodin interacting with calf thymus DNA at other ionic strengths of the medium were also evaluated (Table 3). The titration data were fitted to a modified form of the Scatchard equation (eqn (S5), ESI†), providing values for the overall binding constant (K*) at different ionic strengths.49 Fig. 6D present the case when the ionic strength was 0.12 M. K* for emodin interacting with calf thymus DNA was also obtained at other ionic strengths of the medium by multiplying Kapp with nb (Table 3).
Fig. 7A–D are the corresponding plots for the CuII complex of emodin interacting with calf thymus DNA at an ionic strength of 0.08 M, similar to Fig. 6 (for emodin). A comparison of the binding constant values for emodin and its Cu(II) complex with calf thymus DNA indicated that at all ionic strengths of the medium, the complex was significantly stronger in binding DNA than emodin alone (Table 3). Note, the values obtained for emodin were also in good agreement with those determined earlier.50
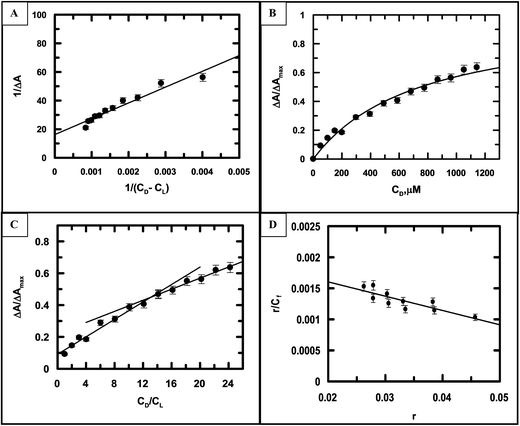 |
| | Fig. 7 (A) A double-reciprocal plot for the interaction of [CuII(LH)2]2− with calf thymus DNA, which enables the calculation of Kapp; reduced chi squared: 9.259. (B) Non-linear curve fitting of the plot of the normalized increase in the change in absorbance against the input concentration of DNA, which helped to calculate the dissociation constant for the association of [CuII(LH)2]2− with calf thymus DNA; reduced chi squared: 0.004466. (C) Mole-ratio plot for the relative change in absorbance against the ratio of DNA to [CuII(LH)2]2−; reduced chi squared: 0.000512, 0.001546. (D) Scatchard plot for the interaction of [CuII(LH)2]2− with calf thymus DNA at pH 7.87 (20 mM Tris–HCl buffer) at an ionic strength of 0.08 M. {CuII(LH)2}2− = 50 μM; T = 298 K. Reduced chi squared: 1.111 × 10⁻⁷. | |
A comparison of the site size of the interaction (nb) of emodin and its CuII complex with calf thymus DNA (Table 3) revealed that the values obtained for the complex at different ionic strengths of the medium were approximately double that obtained for emodin binding to calf thymus DNA, thus providing further evidence that two molecules of emodin are bound to CuII in the complex.16,35,36 If the mode of binding of a molecule and its metal complex with DNA is by intercalation, then it has been seen that the stoichiometry of complex formation can be realized from the number of nucleotides (nb) associated with the concerned molecule and its corresponding complex. In other words, if the number of nucleotides (nb) associated with a compound (ligand) and its metal complex during interaction with DNA is found, then from these two values one can have an idea of the number of ligands bound to the metal ion in the complex. Several earlier studies have indicated this to hold quite true, particularly when the complex is square planar.16,35,36
Since both compounds have a substantial amount of an anionic form present at physiological pH, as indicated by their respective pKa values, a marked increase observed in the binding constant values with DNA upon a gradual increase in the ionic strength of the medium would be significant.33 In the case of the complex, this trend in increase in the binding constant value corresponding to an increase in the ionic strength of the medium was much greater than that observed for emodin (Fig. 8).
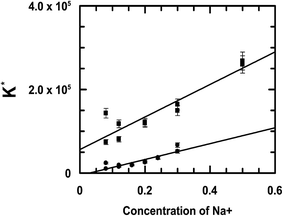 |
| | Fig. 8 Variation of the intrinsic binding constant of emodin (●) and CuII(emod)22− (■) interacting with calf thymus DNA at different ionic strengths of the medium as represented by the concentration of Na+. Emodin = [{CuII(emod)2}2−] = 50 μM; pH = 7.87 [Tris buffer] = 20 mM; T = 298 K. | |
With the help of an earlier study on the physicochemical attributes of purpurin (another hydroxy-9,10-anthraquinone) that we performed at an increased ionic strength of the medium, we showed that the pKa of the molecule increased, implying that its dissociation is suppressed.33 Similarly in the case of emodin, we also observed a gradual increase in pKa with increase in the ionic strength of the medium (Fig. S10, ESI†), suggesting a significant decrease in the presence of anionic species at pH 7.87. The same should also happen for the complex as well. Therefore, under such conditions of increased ionic strength of the medium, neutral forms of both compounds (emodin and CuII complex) are likely to predominate, resulting in an increase in binding constant values.33 In this regard, a prior knowledge of the interaction of NaCl with a negative polymer (DNA) is important to analyze the results obtained.51,52 Going by the pKa values of emodin obtained either in the absence or in the presence of CuII at different ionic strengths of the medium, it was seen that both emodin and the complex exist in two different forms in solution (neutral and anionic).16,18,30c Both forms interact independently with DNA. The anionic forms, owing to their negative charge, experience repulsion from DNA, while the neutral forms bind relatively better.16,32 Through earlier studies on hydroxy-9,10-anthraquinones, we showed that the tendency of the neutral form to bind to DNA is much greater than the anionic form, clearly suggesting that if the presence of the anionic form decreases following an increase in the ionic strength of the medium, the binding of hydroxy-9,10-anthraquinones to DNA improves substantially.15,18,30c,32 Hence, under the experimental conditions in which the DNA binding experiments were performed, the binding of emodin and its complex to DNA were quite naturally expected to be better. In fact, the same was found through experiments (Table 3). The dependence of the binding constants of the molecules with DNA on [Na+] is therefore an important aspect for these interactions.51,52 While the binding of cationic substances with DNA decreases with an increase in [Na+] (i.e., with the increase in the ionic strength of the medium), anionic substances tend to bind better. This is a consequence of the mutual relationship between the number and charge of counter cations immediately surrounding DNA and the number and charge of species that are to bind to it. Manning, in his pioneering work, suggested that cations, in order to partially neutralize the negative charge on the DNA phosphate backbone, are condensed around nucleic acids, i.e., confined close to the poly-anion backbone, but are not bound to a particular site.51 As a molecule intercalates, the lengthening of DNA is observed, with the result that the phosphates move further apart, requiring fewer screening counter ions for generating a stable system. For this reason, intercalation is reported to initiate the release of a certain number of condensed cations; here, dependence of the binding constant of a compound with DNA on [Na+] is well realized with eqn (10) (Friedman and Manning).51
| |
(∂log![[thin space (1/6-em)]](https://www.rsc.org/images/entities/char_2009.gif) K/∂log[Na+]) = −2nb(φ − φ*) − zφ* K/∂log[Na+]) = −2nb(φ − φ*) − zφ*
| (10) |
As NaCl concentration increases, two things happen simultaneously. Dissociation of the first proton on emodin both in the free state and in the form bound to CuII in the complex decrease, from which there is much fewer anionic species in solution, thus having a huge impact on the binding of the compounds to DNA (Fig. 8).33 The other aspect is that repulsion between the anionic forms of the compounds and DNA decrease enormously following an effective shielding of negative charges on phosphates present in DNA by Na+. The result is that there is better interaction between the compounds and the DNA, leading to an increase in the binding constant values (Fig. 8). Our findings on the binding constants for emodin and the complex with calf thymus DNA corresponding to an increase in the ionic strength of the medium clearly demonstrate that both factors mentioned above were operative, and as such the compounds showed such enhanced binding to calf thymus DNA (Fig. 8).53–55 It may therefore be said that emodin and the CuII complex are potential candidates for the development of good DNA binding agents that could be used to target and modify DNA so that processes like replication and RNA transcription are a lot restricted, consequently helping to retard the growth of rapidly multiplying cancer cells. Since emodin is known to possess anticancer activity and is also a simpler analog of anthracyclines, it remains to be seen if complex formation of emodin by CuII leads us to the generation of a better anticancer agent.24–28
3.2.2 Interaction of emodin and its CuII complex with calf thymus DNA at different temperatures. The titration of emodin and its CuII complex with calf thymus DNA (Fig. 9) was also performed at different temperatures. Fig. 10 presents a representation of a non-linear curve fitting analysis for each compound for titrations performed at 298 K. The binding constant and site size of the interaction were evaluated using eqn (S3) and (S4)† (Table 4).
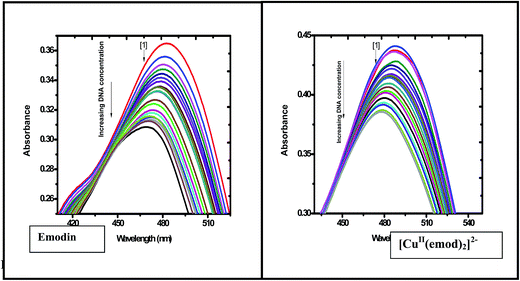 |
| | Fig. 9 Absorption spectra of emodin and [CuII(emod)2]2− in the absence and presence of calf thymus DNA recorded at 298 K at a constant pH and a constant ionic strength of the medium. A gradual decrease in absorbance was observed when calf thymus DNA was added to aqueous solutions of each compound at different temperatures, which was utilized to calculate the binding isotherms. Emodin = {CuII(LH)2}2− = 50 μM; NaCl = 120 mM; Tris buffer = 20 mM; pH ∼ 7.87. | |
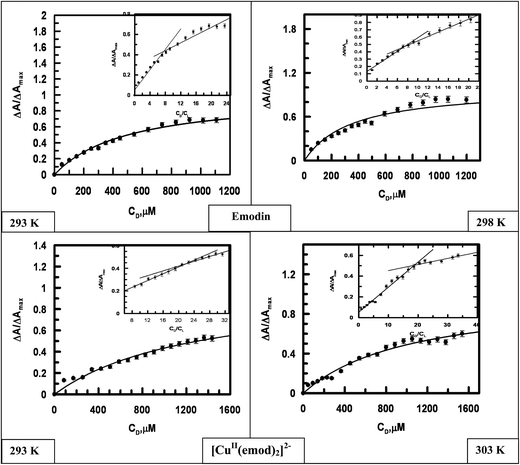 |
| | Fig. 10 Binding isotherms for the interaction of emodin and [CuII(emod)2]2− with calf thymus DNA at different temperatures, where ΔA/ΔAmax is plotted against the concentration of calf thymus DNA. The dark line is the fitted data obeying eqn (S4).† Inset: Plots for the normalized increase in absorbance as a function of the mole-ratio of calf thymus DNA to compounds at different temperatures. Emodin = {CuII(emod)2}2− = 50 μM; NaCl = 120 mM; Tris buffer = 20 mM, pH ∼ 7.87. | |
Table 4 Results of the binding parameters of emodin (LH3) and [CuII(LH)2]2− with calf thymus DNA at different temperatures studied with the help of UV-Vis spectroscopy
| Monitoring technique |
Compounds |
Temp (in K) |
Apparent binding constants Kapp × 10−3 (M−1) |
Site size (nb) from mole ratio plot |
Overall binding constant K* × 10−4 (M−1) [K* = Kapp × nb] |
Overall binding constant K′ × 10−4 (M−1) (from Scatchard plot) |
Site size (nb) Scatchard plot |
| From double-reciprocal plot |
From non-linear fit |
| UV-Vis |
LH3 |
293 |
2.17 ± 0.01 |
2.19 ± 0.05 |
8.0 |
1.74 |
3.01 ± 0.5 |
9.0 |
| 298 |
2.07 ± 0.01 |
2.09 ± 0.06 |
8.5 |
1.77 |
4.36 ± 1.19 |
8.0 |
| 300 |
1.83 ± 0.10 |
1.69 ± 0.09 |
8.0 |
1.41 |
1.89 ± 0.14 |
8.0 |
| 303 |
1.71 ± 0.80 |
1.70 ± 0.05 |
10.0 |
1.70 |
1.94 ± 0.34 |
8.0 |
| 308 |
0.57 ± 0.11 |
0.58 ± 0.01 |
9.0 |
0.52 |
1.49 ± 0.71 |
10.0 |
| CuII(LH2)22− |
293 |
0.79 ± 0.02 |
0.80 ± 0.02 |
20.0 |
1.60 |
1.15 ± 0.40 |
13.0 |
| 298 |
0.66 ± 0.24 |
0.76 ± 0.05 |
16.0 |
1.24 |
1.27 ± 1.00 |
14.0 |
| 303 |
1.02 ± 0.03 |
1.00 ± 0.03 |
18.0 |
1.81 |
1.39 ± 1.39 |
10.0 |
| 308 |
1.17 ± 0.03 |
1.24 ± 0.05 |
16.0 |
1.21 |
1.64 ± 0.58 |
11.0 |
Logs of the apparent binding constant (ln![[thin space (1/6-em)]](https://www.rsc.org/images/entities/char_2009.gif) Kapp) for emodin and its Cu(II) complex were plotted against 1/T (Fig. 11).
Kapp) for emodin and its Cu(II) complex were plotted against 1/T (Fig. 11).
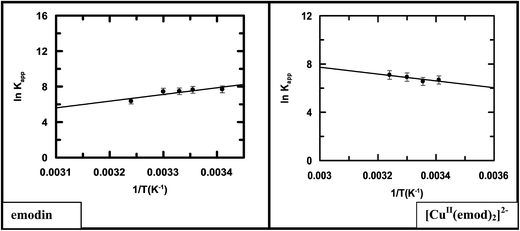 |
| | Fig. 11 Representative van't Hoff plots for the interaction of emodin and its CuII complex with calf thymus DNA in 20 mM Tris–HCl buffer at pH 7.87; reduced chi squared: 0.09867 (emodin), 0.02141 ([CuII(emod)2]2−). | |
Representative van't Hoff plots for each compound (Fig. 11) clearly indicated in the case of emodin that the binding affinity decreases with the increase in temperature, while for the complex, a very slight increase was observed. Therefore, following complex formation, there is a subtle difference in the interaction of the compounds with calf thymus DNA as manifested in the thermodynamics of the two interactions. This could be due to the considerable difference in the size of emodin and its CuII complex. Although the overall change in free energy of binding was negative and almost comparable, individual parameters like ΔH and ΔS, as evaluated from Fig. 11, have a completely opposite character (Table 5). The binding of emodin to DNA was characterized by a negative change in enthalpy, implying the association is enthalpy driven. In the case of the complex, however, the interaction with DNA was characterized by a positive enthalpy change, indicating the association was entropy driven, i.e., an increase in enthalpy tending to retard the process is compensated by an increase in entropy making it favorable.
Table 5 Thermodynamic parameters for the interaction of emodin (LH3) and the complex [CuII(LH)2]2− with calf thymus DNA in 20 mM Tris buffer at pH ∼ 7.87 at 298 K
| Compounds |
ΔG° (kcal per mole) |
ΔH° (kcal per mole) |
ΔS° (e.u.) |
| LH3 |
−4.463 |
−14.997 |
−35.35 |
| [CuII(LH)2]2− |
−3.984 |
5.620 |
32.23 |
In entropy-driven molecular interactions, the association leads to the release of minor groove-bound water from the hydration region as well as the release of counter ions from the bound surface of the interacting partners following intercalation (discussed earlier), leading to a gain in entropy.56–59 The positive change in enthalpy may be due to an energetically unfavorable distortion of the DNA backbone due to the breaking of hydrogen bonds and non-covalent interactions of solvent molecules and counter ions that existed in the unbound form of DNA. The binding site in some cases is characterized by the widening of the minor grooves to accommodate the complex.56–59 In entropy-driven DNA binding, hydrophobic interactions play a major role.60,61 For a small molecule like emodin, since the interaction was found to be allowed due to a change in enthalpy, i.e., ΔH < 0, ΔS < 0, van der Waals interactions or hydrogen bonds are probably the main forces involved in the binding of the molecule with calf thymus DNA, with the mode of binding being intercalation. The reason for the negative entropy change could be attributed to the fact intercalation of emodin between DNA bases, accompanied by a loss of translational and rotational degrees of freedom, and that solvent molecules then get trapped in an ensemble that involves DNA bases, solvent molecules, and emodin with a slight reorganization of the hydrogen bonds among the species.62–64 It is generally seen that, while groove binding is predominantly entropy driven, intercalation is enthalpy driven.63 The evaluated thermodynamic parameters explain the binding of the compounds when they separately interact with calf thymus DNA.
3.3 Generation of ROS by the compounds as followed by the DCFDA assay
Previous reports on emodin cover investigations of the molecule on different carcinoma cell lines, including HeLa and Hep G2 cells, to identify different mechanisms by which the molecule is active.24–27 One such mechanism involves the generation of reactive oxygen species (ROS) as a formidable pathway for antitumor activity.24–27 For this reason, we decided to induce ROS in HeLa cells that were previously treated with emodin or [CuII(emod)2]2− or NAC (N-acetyl cysteine) using H2O2; NAC being used in the experiment as a control. This was done as mentioned in Section 2.5. In all cases, the concentration of the compound used was 25 μM. We found that, with an increase in the time of interaction between the compounds and HeLa cells, the maximum ROS was generated in the case of emodin under identical conditions (Fig. 12). Quite interestingly, the amount of ROS generated in the presence of the complex was in between that of emodin and NAC. The trend for ROS generation in cells containing emodin and NAC were similar, i.e., a steady increase up to an interaction time of 30 min, followed by a plateau region. In the case of [CuII(emod)2]2−, however, the initial increase in ROS corresponding to an increase in the interaction time of the complex with HeLa cells was not seen. Rather, the amount of ROS generated in these cells remained more or less constant irrespective of the time of interaction of the complex with the cells.
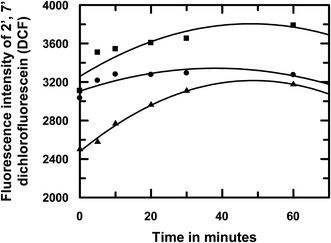 |
| | Fig. 12 Effect of emodin (■), [CuII(emod)2]2− (●), and NAC (▲) on ROS generation in HeLa cells induced with the help of H2O2 and thereafter followed by the DCFDA assay using fluorescence spectroscopy at pH 7.4. Concentration of each compound used in the experiment was 25 μM. NAC was used as the control in the experiment. | |
It was also seen that the ROS-quenching efficiency of the complex was comparatively lower than the established ROS quencher NAC, with the difference between them gradually decreasing as the time of interaction of the compounds with HeLa cells increased to 60 min (Fig. 12). At all interaction times, ROS formation in HeLa cells containing [CuII(emod)2]2− was lower than cells containing emodin and the difference got larger as the time of interaction of the compounds with cells increased, which served as evidence that the complex formation of emodin by Cu(II) was able to modulate the generation of reactive intermediates (semiquinone, etc.) on emodin. Hence, formation of the superoxide radical anion in solution would be lower in case of the complex. Since semiquinones and superoxide radical anions are essential for cytotoxic action on cancer cells it would be essential to see whether the efficacy of emodin as an anticancer agent is compromised due to complex formation following the substantial decrease in ROS generation. On the other hand, since semiquinone and superoxide radical anion formation decreases, the complex is likely to have a lot less toxic side effects, of which cardiotoxicity is of a major concern.37,38 Consequently, we tested the compounds [emodin and its CuII complex] on two distinctly different carcinoma cell lines: a cervical cancer cell line (HeLa) and a human liver tissue (hepatocellular carcinoma) Hep G2 cells. These were chosen since there were previous studies on emodin on these cell lines and our reports could thus be compared.24–27
3.4 Activity of the compounds on HeLa cells and Hep G2 cells followed by the MTT assay
The cell viability assay with emodin (LH3) and [CuII(LH)2]2− on both cell lines indicated that the complex is actually much more effective. This goes to show that, although there is a remarkable decrease in ROS generation due to the complex, it does not affect the efficacy of emodin; rather the complex formation enhances cell killing, as demonstrated by the MTT assay (Fig. 13). This is particularly important because the formation of ROS by emodin, shown to be of immense importance in the different mechanisms concerning the action of the compound on different cancer cell lines, decreases upon complex formation.24–27 The complex probably has several other attributes or is able to improve upon the existing qualities of emodin as an anticancer agent, such as it being a kinase inhibitor (of protein kinases CK2, p56lck, Her-2/neu, and Janus-activated kinase 2).25,28 Emodin was reported to inhibit several signaling pathways as well; the complex could perhaps do even better.25,28 We showed earlier with some metal complexes of hydroxy-9,10-anthraquinones that they inhibit human DNA topoisomerase enzymes.16,18 This complex of CuII with emodin, being an example of the type reported earlier, is likely to inhibit topoisomerase as well, which could be responsible for its showing such enhanced anticancer activity.16,18
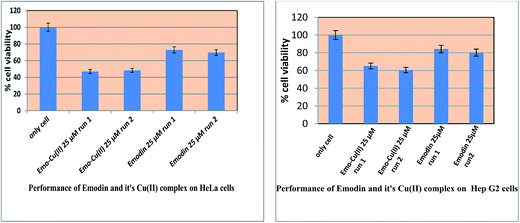 |
| | Fig. 13 Response for the action of emodin and [CuII(emod)2]2− on HeLa and Hep G2 cells. In both cases, cells were treated with the respective compound at the concentration indicated for 48 h and then the MTT assay was performed. | |
3.5 Activity of the compounds on WI 38 lung fibroblast (normal) cells followed by MTT assay
We performed a cell viability assay with emodin (LH3) and [CuII(LH)2]2− on WI 38 lung fibroblast (normal) cells and found that the complex was not active on the chosen normal cell line. In fact, the results showed that its activity was almost comparable to the control experiment performed where no compound was added to the cells (Fig. 14). However, emodin was more active on the chosen normal cells than the Cu(II) complex (Fig. 14). Therefore, going by the data on WI 38 lung fibroblast cells, we can say that the complex should not affect normal cells to a significant extent. This may be considered a huge gain in favor of complex formation. Since the complex produces relatively less ROS, exerts a greater efficacy than emodin on cancer cells, and is almost inactive on normal cells, it could be developed as a useful less costly alternative of anthracycline drugs with decreased toxic side effects.
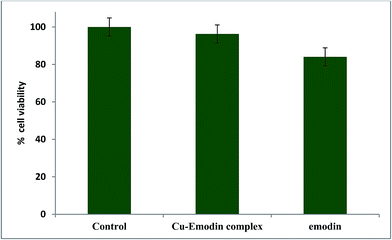 |
| | Fig. 14 Response for the action of emodin and [CuII(emod)2]2− on WI 38 lung fibroblast cells. Cells were treated with compounds (25 μM) for 48 h and then the MTT assay was performed. | |
4. Conclusions
A mononuclear complex of CuII with emodin [CuII(LH)2]2− was characterized with the help of physicochemical and spectroscopic techniques. The structure of the complex was solved from powder XRD data after an initial molecular structural model was created on the basis of spectroscopic evidence. The interaction of emodin and the complex with calf thymus DNA under different conditions of ionic strength of the medium indicated both compounds showed enhanced binding with an increase in the ionic strength of the medium; the effect being greater for the complex. Such an increase in binding constant values with the increase in ionic strength indicates that for both compounds, the anionic species present in solution decrease with the increase in the ionic strength of the medium. This is significant because the compounds may be used on cancer patients even in the presence of high electrolyte concentrations in body fluids; a situation cancer patients are usually in during chemotherapy. The thermodynamic parameters investigated on the interaction of emodin and the complex with calf thymus DNA justified the trends observed in the binding. The DCFDA assay for ROS formation by the compounds revealed low values for [CuII(LH)2]2− with respect to emodin. The study showed that despite the low values for ROS for [CuII(LH)2]2−, the complex was more potent in killing HeLa and Hep G2 cells compared to emodin. This is probably because the complex has other attributes too, such as increased cellular uptake, increased affinity for DNA, or the ability to affect one or more cellular mechanisms operating inside a cell, over that of emodin. A study on a normal cell line (WI 38) revealed that the complex was almost inactive on it. Since decreased ROS formation is often correlated to such molecules being less cardiotoxic, the complex formation of emodin with CuII may be viewed in that perspective as well. Hence, there is a very high possibility that [CuII(LH)2]2− might be active on cancer cells and yet have less toxic side effects.
Conflicts of interest
The authors declare no competing financial interests.
Abbreviations
| LH3 | Emodin or 3-methyl-1,6,8-trihydroxyanthraquinone |
| [CuII(LH)2]2− or [CuII(emod)2]2− | CuII complex of emodin or LH3 |
| ROS | Reactive oxygen species |
| NAC | N-Acetyl cysteine |
Acknowledgements
Financial support from DST, Govt. of West Bengal [794(Sanc.)1(10) ST/P/S&T/9G-23/2013] in the form of a research project to SD is gratefully acknowledged. BM expresses her gratitude to UGC, New Delhi for a Junior & Senior Research Fellowship. SS expresses his gratitude to DST, New Delhi for a DST-INSPIRE fellowship. SD, BM are grateful to DST, Government of India, New Delhi for the special grant provided to the Department of Chemistry, Jadavpur University in 2011 on the occasion of “The International Year of Chemistry” with which the powder X-ray diffractometer and HRMS facilities were purchased. Authors are grateful to Dr. Arup Gayen and his scholars for help in procuring PXRD data, to Prof. M. Ali and his research scholars for help in procuring mass spectrum, to Prof. Kausikisankar Pramanik and his scholars for recording EPR at these departmental facilities. SD is grateful to Dr. Shouvik Chattopadhyay of the Department of Chemistry, Jadavpur University for kindly providing the IR data of the compounds.
References
- R. J. P. Williams, The Biodistribution of Metal Ions, in Concepts and Models in Bioinorganic Chemistry, ed. H.-B. Kraatz and N. Metzler-Nolte, Wiley-VCH, Weinheim, 2006, pp. 1–24 Search PubMed
 .
. - T. J. Lyons, E. B. Gralla and J. S. Valentine, Biological Chemistry of Copper-Zinc Superoxide Dismutase and Its Link to Amyotrophic Lateral Sclerosis, in Metal Ions in Biological Systems, ed. A. Sigel and H. Sigel, Marcel Dekker Inc., New York-Basel, 1999, vol. 36, pp. 125–177 Search PubMed
 .
. - R. A. Festa and D. J. Thiele, Copper: an essential metal in biology, Curr. Biol., 2011, 21, R877–R883 CrossRef CAS PubMed
 .
. - S. Lutsenko, N. L. Barnes, M. Y. Bartee and O. Y. Dmitriev, Function and regulation of human copper-transporting ATPases, Physiol. Rev., 2007, 87, 1011–1046 CrossRef CAS PubMed
 .
. - M. C. Linder and M. Hazegh-Azam, Copper biochemistry and molecular biology, Am. J. Clin. Nutr., 1996, 63, 797S–811S CAS
 .
. - F. Tisato, C. Marzano, M. Porchia, M. Pellei and C. Santini, Copper in diseases and treatments, and copper-based anticancer strategies, Med. Res. Rev., 2010, 30, 708–749 CAS
 .
. - S. A. Lowndes and A. L. Harris, The role of copper in tumour angiogenesis, J. Mammary Gland Biol. Neoplasia., 2005, 10, 299–310 CrossRef PubMed
 .
. - V. L. Goodman, G. Brewer and S. Merajver, Control of copper status for cancer therapy, Curr. Cancer Drug Targets, 2005, 5, 543–549 CrossRef CAS PubMed
 .
. - C. M. Pellei, V. Gandin, M. Porchia, F. Tisato and C. Marzano, Advances in Copper Complexes as Anticancer Agents, Chem. Rev., 2014, 114, 815–862 CrossRef PubMed
 .
. - C. Marzano, M. Pellei, F. Tisato and C. Santini, Copper complexes as anticancer agents, Anti-Cancer Agents Med. Chem., 2009, 9, 185–211 CrossRef CAS PubMed
 .
. - A. Crowe, C. Jackaman, K. M. Beddoes, B. Ricciardo and D. J. Nelson, Rapid copper acquisition by developing murine mesothelioma: decreasing bioavailable copper slows tumor growth, normalizes vessels and promotes T cell infiltration, PLoS One, 2013, 8, e73684 CAS
 .
. - T. Lei, S. Srinivasan, Y. Tang, R. Manchanda, A. Nagesetti, A. Fernandez-Fernandez and A. J. McGoron, Comparing cellular uptake and cytotoxicity of targeted drug carriers in cancer cell lines with different drug resistance mechanisms, Nanomedicine, 2011, 7, 324–332 CrossRef CAS PubMed
 .
. - A. A. Kumbhar, A. T. Franks, R. J. Butcher and K. Franz, Light uncages a copper complex to induce nonapoptotic cell death, Chem. Commun., 2013, 49, 2460–2462 RSC
 .
. - S. Puig and D. J. Thiele, Molecular mechanisms of copper uptake and distribution, Curr. Opin. Chem. Biol., 2002, 6, 171–180 CrossRef CAS PubMed
 .
. - I. Iakovidis, I. Delimaris and S. M. Piperakis, Copper and its complexes in medicine: A biochemical approach, Mol. Biol. Int., 2011, 2011, 594529 Search PubMed
 .
. - P. Das, C. K. Jain, S. K. Dey, R. Saha, A. D. Choudhury, S. Roychowdhury, H. K. Majumder, S. Kumar and S. Das, Synthesis, crystal structure, DNA interaction and in vitro anticancer activity of a Cu(II) complex of purpurin: dual poison for human DNA topoisomerase I and II, RSC Adv., 2014, 4, 59344–59357 RSC
 .
. - T. Deb, P. K. Gopal, D. Ganguly, P. Das, M. Paul, M. B. Saha, S. Paul and S. Das, Enhancement of anti-leukemic potential of 2-hydroxyphenyl-azo-2′-naphthol (HPAN) on MOLT-4 cells through conjugation with Cu(II), RSC Adv., 2014, 4, 18419–18430 RSC
 .
. - P. Das, C. K. Jain, S. Roychoudhury, H. K. Majumder and S. Das, Design, synthesis and in vitro anticancer activity of a Cu(II) complex of carminic acid: a novel small molecule inhibitor of human DNA topoisomerase I and topoisomerase II, ChemistrySelect, 2016, 1, 6623–6631 CrossRef CAS
 .
. - D. Ganguly, C. K. Jain, R. C. Santra, S. Roychoudhury, H. K. Majumder and S. Das, The biological in vitro effect and selectivity shown by a CoII complex of 2-(2-hydroxyphenylazo)-indole-3′-acetic acid on three distinctly different cancer cells, RSC Adv., 2016, 6, 114906–114915 RSC
 .
. - D. Ganguly, C. K. Jain, R. C. Santra, S. Roychoudhury, H. K. Majumder, T. K. Mondal and S. Das, Anticancer activity of a complex of CuII with 2-(2-hydroxyphenylazo)-indole-3′-acetic acid on three different cancer cell lines: a novel feature for azocomplexes, ChemistrySelect, 2017, 2, 2044–2054 CrossRef CAS
 .
. - G. Minotti, P. Menna, E. Salvatorelli, G. Cairo and L. Gianni, Anthracyclines: molecular advances and pharmacologic developments in antitumor activity and cardiotoxicity, Pharmacol. Rev., 2004, 56, 185–229 CrossRef CAS PubMed
 .
. - F. Arcamone and S. Penco, in Anthracycline and Anthracenedione-Based Anticancer Agents, ed. J. W. Lown, Elsevier, Amsterdam, 1988 Search PubMed
 .
. - K. C. Chow, T. L. Macdonald and W. E. Ross, DNA binding by epipodophyllotoxins and N-acyl anthracyclines: implications for mechanism of topoisomerase II inhibition, Mol. Pharmacol., 1988, 34, 467–473 CAS
 .
. - S.-C. Hsu and J.-G. Chung, Anticancer potential of emodin, Biomedicine, 2012, 2, 108–116 CrossRef CAS
 .
. - Y. Sun, Chemosensitization by emodin, a plant-derived anti-cancer agent: mechanism of action, Cancer Biol. Ther., 2008, 7, 476–478 CrossRef CAS PubMed
 .
. - G. Srinivas, S. Babykutty, P. P. Sathiadevan and P. Srinivas, Molecular mechanism of emodin action: transition from laxative ingredient to an antitumor agent, Med. Res. Rev., 2007, 27, 591–608 CrossRef CAS PubMed
 .
. - W.-T. Wei, S.-Z. Lin, D.-L. Liu and Z.-H. Wang, The distinct mechanisms of the antitumor activity of emodin in different types of cancer (review), Oncol. Rep., 2013, 30, 2555–2562 CAS
 .
. - X. Huang, J. Wang, C. Huang, Y. Chen, G. Shi, Q. Hu and J. Yi, Emodin enhances cytotoxicity of chemotherapeutic drugs in prostate cancer cells: the mechanisms involve ROS-mediated suppression of multidrug resistance and hypoxia inducible factor-1, Cancer Biol. Ther., 2008, 7, 468–475 CrossRef CAS PubMed
 .
. - P. S. Guin, S. Das and P. C. Mandal, Studies on the formation of a complex of Cu(II) with sodium 1,4-dihydroxy-9,10-anthraquinone-2-sulphonate – an analogue of the core unit of anthracycline anticancer drugs and its interaction with calf thymus DNA, J. Inorg. Biochem., 2009, 103, 1702–1710 CrossRef CAS PubMed
 .
. -
(a) P. S. Guin, S. Das and P. C. Mandal, Sodium 1,4-dihydroxy-9,10-anthraquinone-2-sulphonate interacts with calf thymus DNA in a way that mimics anthracycline antibiotics: an electrochemical and spectroscopic study, J. Phys. Org. Chem., 2010, 23, 477–482 CrossRef CAS
 ;
(b) P. Das, P. S. Guin, P. C. Mandal, M. Paul, S. Paul and S. Das, Cyclic voltammetric studies of 1,2,4-trihydroxy-9,10-anthraquinone, its interaction with calf thymus DNA and anti-leukemic activity on MOLT-4 cell lines: a comparison with anthracycline anticancer drugs, J. Phys. Org. Chem., 2011, 24, 774–785 CAS
  ;
(c) S. Mukherjee, P. Das and S. Das, Exploration of small hydroxy-9,10-anthraquinones as anthracycline analogues: physicochemical characteristics and DNA binding for comparison, J. Phys. Org. Chem., 2012, 25, 385–393 CrossRef CAS
  .
. - S. Roy, P. Mondal, P. S. Sengupta, D. Dhak, R. C. Santra, S. Das and P. S. Guin, Spectroscopic, computational and electrochemical studies on the formation of the copper complex of 1-amino-4-hydroxy-9,10-anthraquinone and effect of it on superoxide formation by NADH dehydrogenase, Dalton Trans., 2015, 44, 5428–5440 RSC
 .
. - S. Mukherjee, P. Gopal, S. Paul and S. Das, Acetylation of 1,2,5,8-tetrahydroxy-9,10-anthraquinone Improves Binding to DNA and Shows Enhanced Superoxide Formation that Explains Better Cytotoxicity on JURKAT T Lymphocyte Cells, J. Anal. Oncol., 2014, 3, 122–129 CrossRef
 .
. - P. Das, D. Bhattacharya, P. Karmakar and S. Das, Influence of ionic strength on the interaction of THA and its Cu(II) complex
with DNA helps to explain studies on various breast cancer cells, RSC Adv., 2015, 5, 73099–73111 RSC
 .
. - L. Yang, J. Tan, B. C. Wang and L. C. Zhu, Synthesis, characterization, and anti-cancer activity of emodin-Mn(II) metal complex, Chin. J. Nat. Med., 2014, 12, 937–942 CAS
 .
. - M. D. Vaira, P. Orioli, F. Piccioli, B. Bruni and L. Messori, Structure of a terbium(III)−quinizarinecomplex:
![[thin space (1/6-em)]](https://www.rsc.org/images/entities/char_2009.gif) the first crystallographic model for metalloanthracyclines, Inorg. Chem., 2003, 42, 3157–3159 CrossRef PubMed
the first crystallographic model for metalloanthracyclines, Inorg. Chem., 2003, 42, 3157–3159 CrossRef PubMed  .
. - B. Mandal, S. Singha, S. K. Dey, S. Mazumdar, T. K. Mondal, P. Karmakar, S. Kumar and S. Das, Synthesis, crystal structure from PXRD of a MnII(purp)2complex, interaction with DNA at different temperatures and pH and lack of stimulated ROS formation by the complex, RSC Adv., 2016, 6, 51520–51532 RSC
 .
. - A. Kheirolomoom, L. M. Mahakian, C. Y. Lai, H. A. Lindfors, J. W. Seo, E. E. Paoli, K. D. Watson, E. M. Haynam, E. S. Ingham, L. Xing, R. H. Cheng, A. D. Borowsky, R. D. Cardiff and K. W. Ferrara, Copper-doxorubicin as a nanoparticle cargo retains efficacy with minimal toxicity, Mol. Pharm., 2010, 7, 1948–1958 CrossRef CAS PubMed
 .
. -
(a) M. M. L. Fiallo and A. Garnier-Suillerot, Physicochemical studies of the Iron(III)-carminomycincomplex and evidence of the lack of stimulated superoxide production by NADH dehydrogenase, Biochim. Biophys. Acta, 1985, 840, 91–98 CrossRef CAS PubMed
 ;
(b) H. Beraldo, A. Garnier-Suillerot, L. Tosi and F. Lavelle, Iron(III)-adriamycin and iron(III)-daunorubicin complexes: physicochemical characteristics, interaction with DNA, and antitumor activity, Biochemistry, 1985, 24, 284–289 CrossRef CAS PubMed
  .
. - A. Altomare, M. Camalli, C. Cucci, C. Giacovazzo, A. Moliterni and R. Rizzi, EXPO2009: structure solution by powder data in direct and reciprocal space, J. Appl. Crystallogr., 2009, 42, 1197–1202 CrossRef CAS
 .
. - V. Favre-Nicolin and R. Cerny, FOX, ‘free objects for crystallography’: a modular approach to ab initio structure determination from powder diffraction, J. Appl. Crystallogr., 2002, 35, 734–743 CrossRef CAS
 .
. - J. J. P. Stewart, Stewart Computational Chemistry, MOPAC 2016, Colorado Springs, CO, USA, 2016, http://OpenMOPAC.net Search PubMed
 .
. - A. C. Larson and R. B. Von Dreele, General structure analysissystem (GSAS), Los AlamosNational Laboratory Report LAUR, Los Alamos, NM, 2000, p. 86 Search PubMed
 .
. - B. H. Toby, EXPGUI, a graphical user interface for GSAS, J. Appl. Crystallogr., 2001, 34, 210–213 CrossRef CAS
 .
. - G. W. Castellan, in Physical Chemistry, Addison-Wesley/Narosa Publishing House, New Delhi, 3rd edn, 1989, p. 799, Indian Student Edition Search PubMed
 .
. - H. Wang and J. A. Joseph, Quantifying cellular oxidative stress by dichlorofluorescein assay using microplate reader, Free Radical Biol. Med., 1999, 27, 612–616 CrossRef CAS PubMed
 .
. - O. Myhre, J. M. Andersen, H. Aarnes and F. Fonnum, Evaluation of the probes 2′,7′-dichlorofluorescin diacetate, luminol, and lucigenin as indicators of reactive species formation, Biochem. Pharmacol., 2003, 65, 1575–1582 CrossRef CAS PubMed
 .
. - A. Gomes, E. Fernandes and J. L. Lima, Fluorescence probes used for detection of reactive oxygen species, J. Biochem. Biophys. Methods, 2005, 65, 45–80 CrossRef CAS PubMed
 .
. - A. Pramanik, D. Laha, S. Chattopadhyay, S. K. Dash, S. Roy, P. Pramanik and P. Karmakar, Targeted delivery of “copper carbonate” nanoparticles to cancer cells in vivo, Toxicol. Res., 2015, 4, 1604–1612 RSC
 .
. - G. Scatchard, Theattractionsof proteins for small molecules and ions, Ann. N. Y. Acad. Sci., 1949, 51, 660–672 CrossRef CAS
 .
. - X. H. Lin, H. Y. Wan, Y. F. Zhang and J. H. Chen, Studies of the interaction between Aloe-emodin and DNA and preparation of DNA biosensor for detection of PML-RARα fusion gene in acute promyelocytic
leukemia, Talanta, 2008, 74, 944–950 CrossRef CAS PubMed
 .
. - R. A. G. Friedman and G. S. Manning, Polyelectrolyte effects on site-binding equilibria with application to the intercalation of drugs into DNA, Biopolymers, 1984, 23, 2671–2714 CrossRef CAS PubMed
 .
. - M. Cusumano and A. Giannetto, The interaction of mixed-ligand square-planar complexes with calf thymus DNA, J. Inorg. Biochem., 1997, 65, 137–144 CrossRef CAS PubMed
 .
. - L. Gianni, B. J. Corden and C. E. Myers, The biochemical basis of anthracycline toxicity and antitumor activity, in Reviews in Biochemical Toxicology, ed. E. Hodgson, J. Bend and R. M. Philpot, Elsevier Biomedical, New York, 1983, pp. 1–82 Search PubMed
 .
. - S. V. Geiger, N. Lange, P. Suhl, V. Heinemann and H. J. Stemmler, Anticancer therapy induced cardiotoxicity: review of the literature, Anticancer Drugs, 2010, 21, 578–590 CrossRef CAS PubMed
 .
. - A. Nagy, A. V. Schally, P. Armatis, K. Szepeshazi, G. Halmos, M. Kovacs, M. Zarandi, K. Groot, M. Miyazaki, A. Jungwirth and J. Horvath, Cytotoxic analogs of luteinizing hormone-releasing hormone containing doxorubicin or 2-pyrrolinodoxorubicin, a derivative 500-1000 times more potent, Proc. Natl. Acad. Sci. U. S. A., 1996, 93, 7269–7273 CrossRef CAS
 .
. - P. Aich and D. Dasgupta, Role of magnesium ion in mithramycin-DNAinteraction: binding of mithramycin-Mg2+ complexes with DNA, Biochemistry, 1995, 34, 1376–1385 CrossRef CAS PubMed
 .
. - S. Majee, R. Sen, S. Guha, D. Bhattacharya and D. Dasgupta, Differential interactions of the Mg2+ complexes of chromomycin A3 and mithramycin with poly(dG-dC)·poly(dC-dG) and poly(dG)·poly(dC), Biochemistry, 1997, 36, 2291–2299 CrossRef CAS PubMed
 .
. - S. Das and D. Dasgupta, Binding of (MTR)2Zn2+ complex to chromatin: a comparison with (MTR)2Mg2+ complex, J. Inorg. Biochem., 2005, 99, 707–715 CrossRef CAS PubMed
 .
. - S. Roy, R. Banerjee and M. Sarkar, Interaction of a common painkiller piroxicam and copper-piroxicam with chromatin causes structural alterations accompanied by modulation at the epigenomic/genomic level, J. Inorg. Biochem., 2006, 100, 1320–1331 CrossRef CAS PubMed
 .
. - J. B. Chaires, Drug–DNA interactions, Curr. Opin. Struct. Biol., 1998, 8, 314–320 CrossRef CAS PubMed
 .
. - I. Haq, Thermodynamics of drug–DNA interactions, Arch. Biochem. Biophys., 2002, 403, 1–15 CrossRef CAS PubMed
 .
. - S. Kashanian and J. E. N. Dolatabadi, In vitro studies on calf thymus DNA interaction and 2-tert-butyl-4-methylphenol food additive, Eur. Food Res. Technol., 2010, 230, 821–825 CrossRef CAS
 .
. - J. B. Chaires, A thermodynamic signature for drug–DNA binding mode, Arch. Biochem. Biophys., 2006, 453, 26–31 CrossRef CAS PubMed
 .
. - N. Shahabadi, S. Kashanian and F. Darabi, In vitro study of DNA interaction with a water-soluble dinitrogenschiffbase, DNA Cell Biol., 2009, 28, 589–596 CrossRef CAS PubMed
 .
.
Footnote |
| † Electronic supplementary information (ESI) available: Physicochemical experiments on complex formation in solution. Spectroscopic characterization (IR, mass, EPR) of the complex. Equations for the evaluation of binding parameters for the interaction of the compounds with calf thymus DNA. CIF and check CIF pdf files of [CuII(LH)2]2−. A figure showing the variation of pKa with the ionic strength of the medium. CCDC 1516190. For ESI and crystallographic data in CIF or other electronic format see DOI: 10.1039/c7ra06696a |
|
| This journal is © The Royal Society of Chemistry 2017 |
Click here to see how this site uses Cookies. View our privacy policy here.  Open Access Article
 *a
*a
![[thin space (1/6-em)]](https://www.rsc.org/images/entities/char_2009.gif) :
:![[thin space (1/6-em)]](https://www.rsc.org/images/entities/char_2009.gif) 2, with adjusting the pH to approximately 6.0 using sodium bicarbonate. The mixture was stirred for 1 h at 40 °C and then allowed to stand overnight. A reddish brown solid was formed, which was filtered and washed with a 10% hot methanol–water mixture. The product was dried in a vacuum dessicator. Changes in the UV-Vis spectrum (Fig. S2, ESI†) were recorded on a JASCO V-630 spectrophotometer. IR spectra [Fig. S3, emodin; Fig. S4, the Cu(II) complex, ESI†] were recorded on a Perkin Elmer Spectrum Two FTIR spectrophotometer that suggested complex formation. Mass spectra (Fig. S5, ESI†) were recorded on a Micromass Q-Tofmicro™, Waters Corporation, while TGA (Fig. S6, ESI†) was performed using a MettlerToledo TGA/SDTA 851e, which provided further evidence in favor of complex formation. Magnetic susceptibility measurements of the powdered samples at room temperature (298 K) were recorded by the Gouy method using a Magway MSB MK1, Sherwood Scientific Ltd. The EPR spectrum of the complex (Fig. S7, ESI†) showing a g value of 2.058 was recorded on a JEOL JES-FA 200 ESR. Specifically for the analyses: UV-Vis spectra: λmax at 536 nm; MS (m/z): 600.9 considering 63Cu and 601.48 considering 65Cu [M]+.
2, with adjusting the pH to approximately 6.0 using sodium bicarbonate. The mixture was stirred for 1 h at 40 °C and then allowed to stand overnight. A reddish brown solid was formed, which was filtered and washed with a 10% hot methanol–water mixture. The product was dried in a vacuum dessicator. Changes in the UV-Vis spectrum (Fig. S2, ESI†) were recorded on a JASCO V-630 spectrophotometer. IR spectra [Fig. S3, emodin; Fig. S4, the Cu(II) complex, ESI†] were recorded on a Perkin Elmer Spectrum Two FTIR spectrophotometer that suggested complex formation. Mass spectra (Fig. S5, ESI†) were recorded on a Micromass Q-Tofmicro™, Waters Corporation, while TGA (Fig. S6, ESI†) was performed using a MettlerToledo TGA/SDTA 851e, which provided further evidence in favor of complex formation. Magnetic susceptibility measurements of the powdered samples at room temperature (298 K) were recorded by the Gouy method using a Magway MSB MK1, Sherwood Scientific Ltd. The EPR spectrum of the complex (Fig. S7, ESI†) showing a g value of 2.058 was recorded on a JEOL JES-FA 200 ESR. Specifically for the analyses: UV-Vis spectra: λmax at 536 nm; MS (m/z): 600.9 considering 63Cu and 601.48 considering 65Cu [M]+.![[thin space (1/6-em)]](https://www.rsc.org/images/entities/char_2009.gif) :
:![[thin space (1/6-em)]](https://www.rsc.org/images/entities/char_2009.gif) 2 as determined earlier by experiments on the stoichiometry (Fig. S1a and b, ESI†). Changes in absorbance at 525 nm for emodin alone (Fig. S8, ESI†) and at 536 nm in the presence of CuII (Fig. 1) were fitted to eqn (1) below.
2 as determined earlier by experiments on the stoichiometry (Fig. S1a and b, ESI†). Changes in absorbance at 525 nm for emodin alone (Fig. S8, ESI†) and at 536 nm in the presence of CuII (Fig. 1) were fitted to eqn (1) below.


![[thin space (1/6-em)]](https://www.rsc.org/images/entities/char_2009.gif) β = 16.0).
β = 16.0).![[1 with combining macron]](https://www.rsc.org/images/entities/char_0031_0304.gif) . For this unit cell and space group, full pattern decompositions were performed using the Le Bail method, which gave a good fit between the calculated and experimental powder X-ray patterns. Structure solutions from the PXRD data were carried out using the simulated annealing technique (parallel tempering mode) as implemented in the program FOX,40 a Monte Carlo-based software package. The initial molecular structural model was first drawn using ACD/Chem Sketch. The geometry of the structure was then optimized with the help of MOPAC 2016 to arrive at the reference structural model for FOX.41 After going through a large number of successful cycles, we obtained the atomic coordinates from FOX. These were used as the input for the starting model for Rietveld structure refinement through the program GSAS42 with the EXPGUI43 interface. Peak shapes were described as pseudo-Voigt functions, while the backgrounds were fitted by the shifted Chebyshev function of the first kind with 36 points regularly distributed over the entire 2θ range. Initially the lattice parameters, the profile parameters, and the background coefficients were refined. After applying the soft constraints on the bond lengths and bond angles and planar restraints on the aromatic rings, the positions of the atoms were refined. Fixed isotropic displacement parameters of 0.04 Å2 for non-hydrogen atoms and 0.06 Å2 for hydrogen atoms were maintained. At the final stage of refinement, the preferred orientation correction was applied using a generalized spherical harmonic model. The final Rietveld plot is shown in Fig. 3.
. For this unit cell and space group, full pattern decompositions were performed using the Le Bail method, which gave a good fit between the calculated and experimental powder X-ray patterns. Structure solutions from the PXRD data were carried out using the simulated annealing technique (parallel tempering mode) as implemented in the program FOX,40 a Monte Carlo-based software package. The initial molecular structural model was first drawn using ACD/Chem Sketch. The geometry of the structure was then optimized with the help of MOPAC 2016 to arrive at the reference structural model for FOX.41 After going through a large number of successful cycles, we obtained the atomic coordinates from FOX. These were used as the input for the starting model for Rietveld structure refinement through the program GSAS42 with the EXPGUI43 interface. Peak shapes were described as pseudo-Voigt functions, while the backgrounds were fitted by the shifted Chebyshev function of the first kind with 36 points regularly distributed over the entire 2θ range. Initially the lattice parameters, the profile parameters, and the background coefficients were refined. After applying the soft constraints on the bond lengths and bond angles and planar restraints on the aromatic rings, the positions of the atoms were refined. Fixed isotropic displacement parameters of 0.04 Å2 for non-hydrogen atoms and 0.06 Å2 for hydrogen atoms were maintained. At the final stage of refinement, the preferred orientation correction was applied using a generalized spherical harmonic model. The final Rietveld plot is shown in Fig. 3.
![[thin space (1/6-em)]](https://www.rsc.org/images/entities/char_2009.gif) 500 μM) till saturation was reached. The results were analyzed using eqn (S1)–(S5), ESI.†16–20,29–33
500 μM) till saturation was reached. The results were analyzed using eqn (S1)–(S5), ESI.†16–20,29–33![[thin space (1/6-em)]](https://www.rsc.org/images/entities/char_2009.gif) Kapp = (−ΔH0/RT) + (ΔS0/R)
Kapp = (−ΔH0/RT) + (ΔS0/R)
![[thin space (1/6-em)]](https://www.rsc.org/images/entities/char_2009.gif) ln
ln![[thin space (1/6-em)]](https://www.rsc.org/images/entities/char_2009.gif) Kapp
Kapp
![[thin space (1/6-em)]](https://www.rsc.org/images/entities/char_2009.gif) Kapp vs. 1/T gave a straight line, with ΔH0 and ΔS0 determined from the slope and intercept, respectively (eqn (7)). ΔG0 was obtained from eqn (8) and (9).44 It needs mentioning here that since we did not have access to an isothermal titration calorimeter (ITC), this prevented us from determining thermodynamic parameters that are model independent.
Kapp vs. 1/T gave a straight line, with ΔH0 and ΔS0 determined from the slope and intercept, respectively (eqn (7)). ΔG0 was obtained from eqn (8) and (9).44 It needs mentioning here that since we did not have access to an isothermal titration calorimeter (ITC), this prevented us from determining thermodynamic parameters that are model independent.![[1 with combining macron]](https://www.rsc.org/images/entities/char_0031_0304.gif) space group and that the asymmetric unit of the complex contains one CuII and two monoanionic LH2− units. The final crystallographic data and Rietveld refinement parameters are depicted in Table 1 and the asymmetric unit of the complex is presented in Fig. 4.
space group and that the asymmetric unit of the complex contains one CuII and two monoanionic LH2− units. The final crystallographic data and Rietveld refinement parameters are depicted in Table 1 and the asymmetric unit of the complex is presented in Fig. 4.
![[1 with combining macron]](https://www.rsc.org/images/entities/char_0031_0304.gif)
![[thin space (1/6-em)]](https://www.rsc.org/images/entities/char_2009.gif) K/∂log[Na+]) = −2nb(φ − φ*) − zφ*
K/∂log[Na+]) = −2nb(φ − φ*) − zφ*

![[thin space (1/6-em)]](https://www.rsc.org/images/entities/char_2009.gif) Kapp) for emodin and its Cu(II) complex were plotted against 1/T (Fig. 11).
Kapp) for emodin and its Cu(II) complex were plotted against 1/T (Fig. 11).
.
.
.
.
.
.
.
.
.
.
.
.
.
.
.
.
.
.
.
.
.
.
.
.
.
.
.
.
.
; (b) P. Das, P. S. Guin, P. C. Mandal, M. Paul, S. Paul and S. Das, Cyclic voltammetric studies of 1,2,4-trihydroxy-9,10-anthraquinone, its interaction with calf thymus DNA and anti-leukemic activity on MOLT-4 cell lines: a comparison with anthracycline anticancer drugs, J. Phys. Org. Chem., 2011, 24, 774–785 CAS
; (c) S. Mukherjee, P. Das and S. Das, Exploration of small hydroxy-9,10-anthraquinones as anthracycline analogues: physicochemical characteristics and DNA binding for comparison, J. Phys. Org. Chem., 2012, 25, 385–393 CrossRef CAS
.
.
.
.
.
![[thin space (1/6-em)]](https://www.rsc.org/images/entities/char_2009.gif) the first crystallographic model for metalloanthracyclines, Inorg. Chem., 2003, 42, 3157–3159 CrossRef PubMed
the first crystallographic model for metalloanthracyclines, Inorg. Chem., 2003, 42, 3157–3159 CrossRef PubMed .
.
.
; (b) H. Beraldo, A. Garnier-Suillerot, L. Tosi and F. Lavelle, Iron(III)-adriamycin and iron(III)-daunorubicin complexes: physicochemical characteristics, interaction with DNA, and antitumor activity, Biochemistry, 1985, 24, 284–289 CrossRef CAS PubMed
.
.
.
.
.
.
.
.
.
.
.
.
.
.
.
.
.
.
.
.
.
.
.
.
.
.
.

