 Open Access Article
Quantum dot encapsulation in virus-like particles with tuneable structural properties and low toxicity†
O. Tagit‡
 *,
M. V. de Ruiter,
M. Brasch,
Y. Ma and
J. J. L. M. Cornelissen
 *
*
Laboratory of Biomolecular Nanotechnology, MESA + Institute of Nanotechnology, University of Twente, Enschede, The Netherlands. E-mail: J.J.L.M.Cornelissen@utwente.nl; Oya.Tagit@radboudumc.nl
First published on 2nd August 2017
Abstract
A simple method for the encapsulation of quantum dots (QDs) in virus-like particle (VLP) nanoassemblies with tuneable structural properties and enhanced biocompatibility is presented. Cowpea chlorotic mottle virus-based capsid proteins assemble around the carboxylated QDs to form QD/VLP nanoassemblies of different capsid size as a function of pH and ionic strength. Detailed structural characterizations verify that nanoassemblies with probably native capsid icosahedral symmetry (T = 3) are obtained at low pH and high ionic strength (pH 5.0, 1.0 M NaCl), whereas high pH and low ionic strength conditions (pH 7.5, 0.3 M NaCl) result in the formation of smaller assembly sizes similar to T = 1 symmetry. In vitro studies reveal that QD/VLP nanoassemblies are efficiently internalized by RAW 264.7 macrophages and HeLa cells with no signs of toxicity at QD concentrations exceeding the potentially-toxic levels. The presented route holds great promise for preparation of size-tuneable, robust, non-toxic luminescent probes for long term cellular imaging applications. Furthermore, thanks to the possibility of chemical and genetic manipulation of the viral protein shell encaging the QDs, the nanoassemblies have potential for in vivo targeting applications.
Introduction
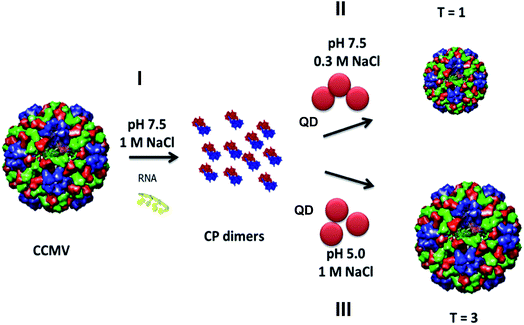
Luminescent nanostructures engineered at the nanoscale are promising candidates to satisfy requirements of a variety of biological applications such as in vitro imaging and therapeutic interventions.1,2 Semiconductor quantum dots (QDs) are an attractive class of materials for such applications due to their unique size-tuneable optical properties, size in the nanometer range and resistance to photobleaching.3 However, their potential cytotoxicity is an ongoing concern particularly for long-term, in vivo exposures or live cell imaging and needs to be addressed before the realization of in vitro and in vivo applications.4 The strong dependence of QD toxicity to concentration, size, charge, and stability of surface ligands5,6 has increased the need for biocompatible and robust scaffolds to encage QDs. Virus-like particles (VLPs) constitute an example of natural protein cages that offer great potential as robust and monodisperse hollow scaffolds with a highly organized supramolecular structure.7–9 In this respect, there has been a growing interest in using these biomolecular architectures as nanotemplates and nanoreactors for modulating the assembly10,11 and growth12 of nanoparticles due to the natural ability of biological structures to organize on many length scales with controlled size, shape, alignment and orientation. Moreover, viral particles are amenable to both chemical modifications and genetic manipulations and are designed by nature to stabilize and shield their cargo from their surroundings. Therefore, encapsulation of QDs within such well-defined biomolecular structures would not only prevent the potential QD toxicity but also enable e.g. in vivo targeting via capsid protein modifications.A number of studies have explored the formation of VLP/inorganic nanoparticle assemblies via either assembly of the cage proteins around the inorganic cores,7,10,11,13–16 or in situ formation of inorganic nanoparticles within the assembled capsids.12,17,18 In the former case, the guest molecules are entrapped within the cage during capsid assembly via complementary electrostatic interactions, whereas in the latter, the precursor molecules diffuse into the pre-formed cage to form nanocrystals. VLP self-assembly around inorganic ‘guests’ has been explored for gold nanoparticles,7,19–22 magnetic cores,23–26 and QDs10,14,16,27–29 among others, which have been discussed in recent reviews.30–32 In this work, we extend the QD encapsulation concept to cowpea chlorotic mottle virus (CCMV)-based protein cages. CCMV is a member of the Bromoviridae family of plant viruses with an icosahedral protein shell of 28 nm of outer diameter and 18 nm of inner cavity.9 One of the highly interesting properties of CCMV is that the protein shell, which is composed of 180 identical subunits, can reversibly disassemble into 90 capsid protein (CP) dimers in vitro. Depending on the pH and ionic strength, the reassembly process may result in capsids of the same size and geometry as the wild type CCMV, or different capsids morphologies.33–35 In this respect, compared to other virus-based protein cages, CCMV offers the versatility to achieve nanoassemblies of different sizes and structural parameters. In addition, its highly symmetrical structure enables multivalent presentation of molecules (e.g. for targeting) conjugated to outer surface while its inner cavity can host different types of cargo.36 Furthermore, unlike adenoviruses, CCMV and other plant-derived viruses are non-pathogenic for humans and are regarded as safe for potential human use37 and have a broad in vivo biodistribution without any toxicity.38 Therefore, CCMV-based protein cages hold a great promise as biocompatible nano-scaffolds for applications in nanomedicine such as targeted drug delivery systems. Alternatively, when combined with contrast agents such as QDs, they can serve as powerful tools as non-toxic probes for long-term, disease-specific imaging.39 In this work, we explore the encapsulation of QDs within CCMV-based protein cages and demonstrate their biocompatibility and in vitro imaging applications. Depending on the pH and ionic strength, CCMV-based CPs assembled around the carboxylic acid-functionalized QDs to form hybrid particles of two different sizes (Fig. 1). Detailed colloidal and optical characterization of these nanoassemblies as size-tuneable, non-toxic, luminescent imaging probes is discussed.
Experimental
Materials
Qdot® 605 ITK™ carboxylated CdSe/ZnS core/shell QDs (peak emission at 605 nm) were purchased from ThermoFisher Scientific. Isolation and purification of CCMV, removal of viral RNA and isolation of CPs was performed as reported previously.12,33Encapsulation
20 μL of 8 μM carboxylated QDs were mixed with 50 μL of disassembled CCMV CP solution (8.8 mg mL−1). The protein-QD mixture was dialyzed against either sodium acetate buffer (50 mM, 1.0 M NaCl, 1.0 mM NaN3, pH 5.0) or Tris–HCl buffer (50 mM, 0.3 M NaCl, 1.0 mM DTT, pH 7.5) for 2 days.Characterization
Fast protein liquid chromatography (FPLC), which enabled both purification and structural characterization of nanoassemblies, was performed using a Superose 6 column (GE Healthcare). All the buffers used for FPLC were filtered using a Millipore filter (0.2 μm pore size) before use. Protein concentration was determined using a NanoDrop 1000 spectrometer (Thermo Scientific). The QD concentration encapsulated within the virus capsids was determined with a Perkin Elmer Lambda 850 UV/vis spectrometer. Emission spectra of the QDs were recorded with a Perkin Elmer LS55 fluorescence spectrometer.The size distribution of the VLPs was measured using dynamic light scattering (DLS) with a Microtrac Nanotrac Wave W3043. Viscosity and refractive index of the buffer were assumed to be identical to water. For the refractive index of particles, that of native CCMV (1.54) was used. Furthermore, the VLPs were imaged with transmission electron microscopy (TEM) on a FEG-TEM (Phillips CM 30) operated at 300 kV acceleration voltages. Samples were prepared on formvar Carbon 200 copper grids by incubating the samples for 1 min, draining the liquid, followed by 1% uranyl acetate staining for 15 seconds. The diameter of imaged particles was measured with ImageJ to determine the size distribution. Particles were measured in two orthogonal directions.
In vitro imaging of RAW 264.7 macrophages
Approximately 1014 QD-loaded VLPs in their corresponding buffer, without the NaN3 and DTT, were mixed with 103 to 104 seeded RAW 264.7 macrophages in 100 μL growth medium and were incubated overnight (more than 18 h) at 37 °C. Afterwards cells were washed three times with fresh medium to remove the excess of material. Confocal laser scanning microscopy (CLSM) images of the cells were obtained using a Zeiss LSM 510 (Carl Zeiss Microimaging GmbH, Göttingen, Germany) confocal scanning system with a 20× objective. An Ar-ion laser (458 nm) was chosen as the excitation light source and emission was collected using a LP 560 filter for QD imaging. Images were processed with ImageJ. Cells incubated only with QDs (50 nM) were also imaged as control. Intracellular fluorescence intensities were determined by ImageJ using at least 65 individual cells. Statistical analysis was performed using GraphPad Prism software.MTT assay
RAW cells seeded on a 96 well-plate (5 × 10³ cells per well) were incubated with QDs and nanoassemblies in equal QD concentrations for 4 h. Cells were incubated for another 4 hours after addition of 20 μL of 5 mg mL−1 MTT solution (freshly prepared in PBS) in each well. At the end of the incubation period 150 μL of DMSO was added to each well. After shaking the plate for 5 min absorbance of each well was measured at 490 nm using a plate reader.In vitro imaging of HeLa cells
50 nM QD/VLP nanoassemblies were mixed with ∼5 × 10³ HeLa cells in 100 μL growth medium and were incubated overnight at 37 °C. At the end of incubation period cells were washed three times with fresh medium to remove the excess of material. CLSM images were acquired using an Olympus FV1000 (Olympus, Tokyo, Japan) with a 60 × 1.35 NA Oil immersion objective. Images were processed with ImageJ. Cells incubated only with QDs (50 nM) were also imaged as control.Results and discussion
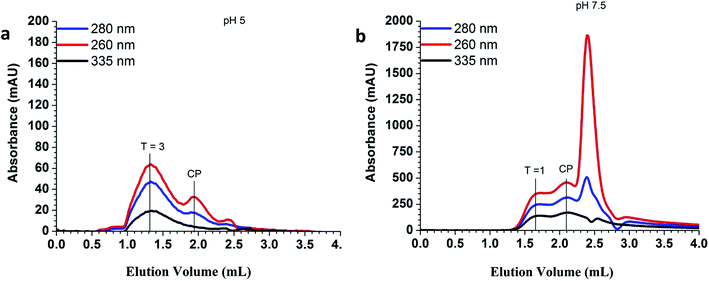
The QD/VLP nanoassemblies were formed via two different routes. In both cases, wild-type CPs without any further modifications, and commercially available QDs of the same size (λemission 605 nm, ∼6.4 nm core diameter, Fig. ESI 1†) and surface functionality (carboxylic acid) were used. In the first method the assembly was carried out at pH 5.0 in sodium acetate buffer (1.0 M NaCl), whereas the second method involved the use of Tris–HCl buffer (0.3 M NaCl) at pH 7.5 for the capsid assembly. The experimental route is presented in Fig. 1.Purification and structural characterization of the QD/VLP nanostructures was achieved by fast protein liquid chromatography (FPLC). The elution of QDs and capsid proteins were monitored at λ = 335 nm and 280 nm, respectively and the corresponding fractions, where both peaks co-elute, were used for further characterization. The elution profile of the assemblies prepared at pH 5.0 and pH 7.5 are shown in Fig. 2. Assembly at pH 5.0 (1.0 M NaCl) resulted in two main structures with elution volumes of 1.3 mL and 1.9 mL (Fig. 2a). When compared to the FPLC chromatogram of native CCMV capsid (Fig. ESI 2†), it can be concluded that the peaks observed at 1.3 mL and 1.9 mL correspond to assembled capsids and CP dimers, respectively. The co-elution of QDs (335 nm) and CPs (280 nm) at the same volume as the native capsid (1.3 mL) suggests that encapsulation at pH 5.0 resulted in QD/VLP structures similar to T = 3 native capsid symmetry.
The elution profile of the nanohybrid structures assembled at pH 7.5 (0.3 M NaCl) showed an intense peak around 2.4 mL in addition to two overlapping peaks at 1.7 mL and 2.1 mL (Fig. 2b). This intense peak likely originates from unencapsulated QDs. The retarded elution of the QD/VLP hybrids implied the formation of particles with sizes smaller than the wild type CCMV capsid. Previous studies also demonstrated the assembly of CPs into smaller size capsids to form T = 1 particles, which are 18 nm in diameter and consist of 30 CP dimers, or pseudo T = 2 particles of 22 nm size with 60 CP dimers in the presence of negatively charged molecular species.35,40,41 The role of electrostatic interactions between the positively-charged N-termini of capsid proteins and the negatively-charged encapsulant in the capsid assembly process has been investigated further by other recent studies. For instance, Garmann et al. have reported the preparation of CP mutants with extra and missing (relative to the wild type CPs) N-terminal cationic residues that were used for packaging of RNA. It was shown that a smaller and larger excess of CPs was needed for complete packaging of RNA by CP mutants bearing extra and missing cationic residues, respectively.42 Another study investigating the assembly of CP dimers around a single stranded RNA has reported the influence of ionic strength and pH on the assembly process in details.43 Accordingly, the entire assembly process indeed depends delicately on the strength of CP–CP attractions relative to CP–cargo attractions. While CP–CP attractions are controlled by pH, CP–cargo attractions are more sensitive to ionic strength. CP–CP and CP–cargo attractive interactions decrease at high pH and high ionic strength, respectively.44 Therefore, it can be stated that CP–QD interactions of electrostatic nature mainly drive the formation of QD/VLP nanohybrid structures at high pH and low ionic strength (pH 7.5, 0.3 M NaCl). The Zeta potential measurements (Table ESI 1†) performed in parallel to size exclusion chromatography revealed that CPs that did not form assembled capsids in the absence of carboxylated QDs had a slightly positive charge probably due to exposed cationic N-termini at pH 7.5 (0.3 M NaCl) (Fig. ESI 3a†). In the presence of QDs, however, the assembly formation was verified by size exclusion chromatography (Fig. ESI 3b†) and a net negative charge was observed for the QD/VLP assemblies, which is in accordance with the Zeta potential of the assembled capsids (Table ESI 1†). Therefore, the peaks observed at 1.7 mL and 2.1 mL (Fig. 2b) can be assigned to T = 1 particles and CP dimers that failed to assemble into capsids, respectively. The inability of CP dimers to assemble around QDs implies the lack of charge matching between CP N-terminus and negatively-charged QD surface. Extended incubation of CP dimers at pH 7.5 was reported to cause near-complete truncation of positively charged amino acid residues on the CP N-terminus.45 A small degree of the capsid proteins lost their N-terminal part at pH 7.5 (Fig. ESI 4†), lowering the formation of electrostatic attractive forces between QDs and CPs. The formation of T = 1 VLPs for CCMV CPs was previously observed for serval other negatively charged cargo systems as well.8,46,47 The encapsulation efficiency was estimated as ∼70% by calculating the ratio of the integrated intensity of the QD elution curve at T = 1 peak over the total QD elution curve. It is noteworthy that QDs have very high molar extinction coefficients and absorb strongly in the UV range (Fig. ESI 1†). Therefore, QD absorption contributes to the intensity levels monitored at 260 nm and 280 nm as well.
Formation of QD/VLP nanoparticles was mainly driven by CP–CP interactions at low pH and high ionic strength (pH 5.0, 1.0 M NaCl). Negligible-ionization of carboxylic acid groups on the QD surface at low pH probably equally contributed to the formation of particles with T = 3 native capsid symmetry bearing packed QD cores with high encapsulation efficiency (∼90%).
For further characterization, only the fractions containing T = 3 and T = 1 particles were used. Fluorescent characterization of the assemblies revealed that QD emission peak slightly red-shifted upon encapsulation (Fig. ESI 5†). This is a general observation for the encaged QDs48,49 and implies QD encapsulation within the protein cages. Furthermore, when compared to absorption spectra of QDs, QD/VLP assemblies showed an extra absorption shoulder at 280 nm that corresponded to protein absorption (Fig. ESI 6†).
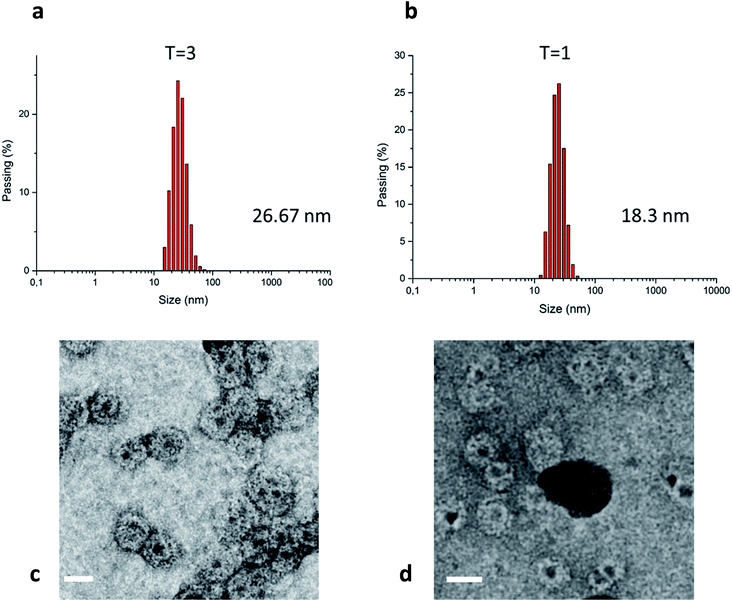
Dynamic light scattering (DLS) and transmission electron microscopy (TEM) imaging experiments further verified QD encapsulation within protein cages and formation of QD/VLP nanoassemblies of different sizes (Fig. 3). Five separate DLS measurement were averaged to determine the particle size as 26.7 nm for the larger particles (Fig. 3a), 18.3 nm for the smaller particles (Fig. 3b), and 27.3 nm for wild-type CCMV (Fig. ESI 7†). Indeed, the obtained values corresponded very well to the reported sizes of native CCMV T = 3 and T = 1 particles. Gel electrophoresis also confirmed the presence of proteins in the QD/VLP assemblies (Fig. ESI 4†). TEM imaging enabled visual assessment of individual particles in terms of both size and QD content. As depicted in Fig. 3c, a considerable number of QD/VLP assemblies with presumed T = 3 symmetry contain more than one encapsulated QD, whereas ‘T = 1 particles’ are encapsulating single QDs per assembly (Fig. 3d). The average number of QDs was estimated as 3 per VLP for nanoassemblies with T = 3 symmetry and 1.5 per VLP for those with T = 1 symmetry based on the corresponding absorption spectra (detailed calculations are shown in ESI). This observation also supports the higher encapsulation efficiency for T = 3 particles as determined using FPLC.
In vitro imaging applications
The potential QD toxicity has raised considerable concerns for their applications in biological environments requiring long term exposure or live cell imaging. While in vitro toxicity of QDs is usually associated with the release of heavy metal ions or generation of reactive oxygen species, in vivo toxicity may exert itself at the systemic level due to interactions with blood components, accumulation in non-desired organs or generation of immune responses.50 Because macrophage cells serve as the first line of immune defense against exogenous substances, it is important to investigate the potential toxicity of nanoassemblies using particularly this cell line. For this purpose, we incubated RAW 264.7 macrophages with ‘T = 1 and T = 3’ particles for a period of more than 18 hours. Confocal laser scanning microscopy imaging of the cells revealed a strong emission originating only from the cell interior, localized in the cytosol, for QD/VLP particles of both sizes (Fig. 4). The nuclear compartments can be distinguished as the dark areas within the cells (images with nuclear staining are shown in Fig. ESI 8†). During the incubation period of more than 18 hours, the cells were observed to be viable as depicted by their stretched conformation on the bottom of the wells. Parallel morphological investigations of cells that were incubated with only QDs (Fig. 4 and ESI 9†) of similar concentrations revealed reduced cell viability and certain related morphological changes such as granulation and apoptotic body formation.51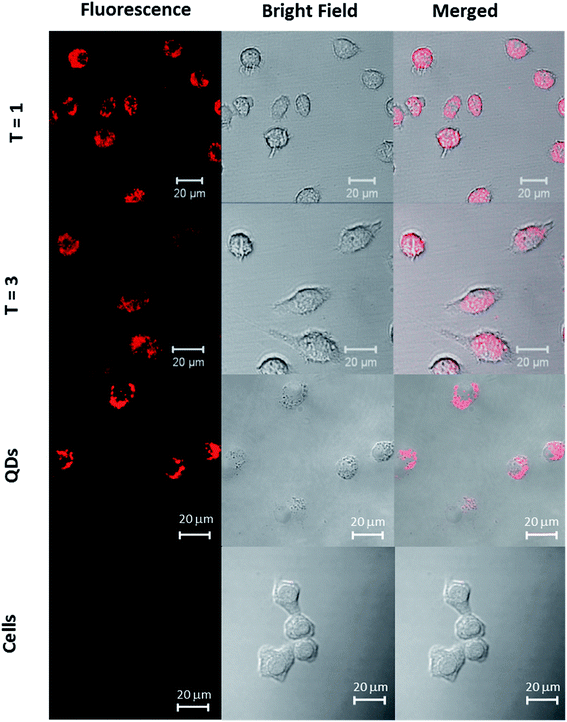 | ||
| Fig. 4 CLSM images of RAW 264.7 macrophages incubated with T = 1 particles, T = 3 particles, and QDs. Left: fluorescence, middle: bright-field, right: merged images. | ||
A recent study that has shown a detailed investigation of the immune response of RAW 264.7 macrophages incubated with commercially-available carboxylated CdSe/ZnS QDs also reported a reduced cell viability within the first 24 hours of incubation,52 which supports our observations of reduced cell viability in control experiments (Fig. ESI 10†). The viability of cells incubated with the presumed T = 1 and T = 3 particles for incubation times of 18 hours clearly show that QD cores were well protected by VLPs against intracellular oxidation during the incubation period and observations are consistent for both particles.
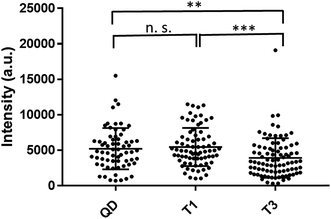
Cellular uptake efficiency of nanoparticles depends largely on the nanoparticle surface chemistries52,53 as well as the type and origin of the cells.54,55 In order to study whether VLP encapsulation interfered with the cellular uptake efficiency, we compared the intracellular fluorescence intensity levels of RAW cells incubated with T = 1 and T = 3 assemblies as well as with ‘bare’ QDs (Fig. 5). Analysis of at least 65 individual cells for each condition revealed similar intracellular fluorescence intensity levels for QD and T1 samples (P > 0.05), however both of them had fluorescence intensity significantly higher than that of T3 samples (P < 0.05). This observation was verified by flow cytometry analysis as well (Fig. ESI 11†).
It should be noted that the photoluminescence quantum yield (QY) of QD/VLP assemblies with T = 3 symmetry was found to be smaller (∼0.75) compared to T = 1 assemblies and QDs (regarded as reference with QY = 1). Therefore, the smaller degree of intracellular fluorescence intensity observed for T3 particles would not necessarily mean less particle uptake, but it could be due to lower quantum yield of these assemblies.
Cell viability studies performed on RAW macrophages suggested that QD/VLP nanoassemblies would be suitable for in vitro and in vivo applications. The possibility to chemically and genetically modify the VLPs would extend the potential applications of QD/VLP assemblies to targeted, disease-specific imaging. We used human cervical cancer cell line (HeLa cells) to test the feasibility of potential tumor imaging applications (Fig. 6). HeLa cells incubated with QDs and QD/VLP assemblies with T = 1 and T = 3 symmetry revealed cellular uptake for all samples. Similar to RAW macrophages, the fluorescence signal that accumulated in the perinuclear region (Fig. ESI 12†) was less for T = 3 assemblies compared to QDs and T = 1 assemblies. Overall, the intracellular fluorescence intensity was observed to be lower for each sample in HeLa cells compared to RAW macrophages. One of the reasons could be the differences in the particle uptake mechanisms. For instance, non-specific transcytosis49 as well as several endocytic pathways have been reported to be involved in the uptake of QDs by RAW macrophages.56 Similarly, energy-dependent endocytosis has been reported for QD uptake by HeLa cells.57 Although QD/VLP assemblies are larger than QDs, they are still small enough to be endocytosed by most endocytic mechanisms.58
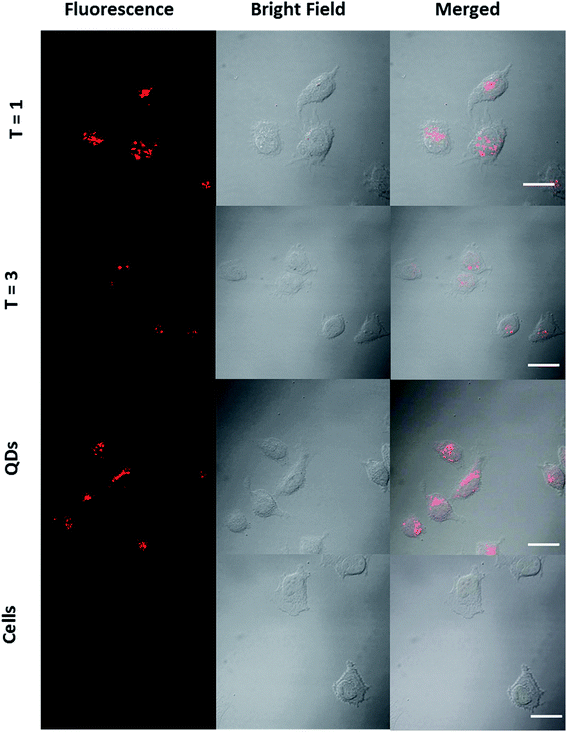 | ||
| Fig. 6 CLSM images of HeLa cells incubated with T = 1 particles, T = 3 particles, and QDs. Left: fluorescence, middle: bright-field, right: merged images. Scale bar: 20 μm. | ||
In vitro studies presented in our work provide a first proof of principle to use QD/VLP assemblies for in vitro imaging. More detailed investigations are necessary to reveal the exact mechanisms, via which QD/VLP assemblies are taken up by different cell types that are relevant to potential in vivo applications.
Conclusions
A simple route for the formation of CCMV-based VLP/QD nano hybrid particles with tuneable sizes as a function of pH and ionic strength was shown. At low pH and high ionic strength (pH 5.0, 1.0 M NaCl) capsid proteins assembled around the carboxylic acid functionalized QDs to form particles of 27 nm similar to T = 3 native capsid symmetry via CP–CP attractions. At high pH and low ionic strength (pH 7.5, 0.3 M NaCl), CP–QD electrostatic attractions governed the formation of smaller particles of 18 nm similar to T = 1 icosahedral symmetry. Cell viability assays implemented on RAW 264.7 macrophages revealed no signs of toxicity during the incubation period at QD concentrations exceeding the potentially toxic levels. The first proof of principle to use QD/VLP assemblies for in vitro imaging was shown on HeLa cells. The reported encapsulation routes can be adapted to encapsulation of other inorganic nanoparticles to obtain functional nano hybrid materials with tuneable sizes and different functions. This improve their stability, reduce their cytotoxicity and the protein capsid can be controllably functionalized, which are particularly promising for in vitro and in vivo applications.Conflict of interest
There are no conflicts of interest to declare.Acknowledgements
Authors acknowledge the funding by European Research Council CoG Protcage (616907).References
- W. Chen, J. Nanosci. Nanotechnol., 2008, 8, 1019–1051 CrossRef CAS PubMed.
- V. Biju, S. Mundayoor, R. V. Omkumar, A. Anas and M. Ishikawa, Biotechnol. Adv., 2010, 28, 199–213 CrossRef CAS PubMed.
- W. C. Chan and S. Nie, Science, 1998, 281, 2016–2018 CrossRef CAS PubMed.
- I. L. Medintz, H. Mattoussi and A. R. Clapp, Int. J. Nanomed., 2008, 3, 151–167 CAS.
- F. M. Winnik and D. Maysinger, Acc. Chem. Res., 2013, 46, 672–680 CrossRef CAS PubMed.
- K.-T. Yong, W.-C. Law, R. Hu, L. Ye, L. Liu, M. T. Swihart and P. N. Prasad, Chem. Soc. Rev., 2013, 42, 1236–1250 RSC.
- C. Chen, M.-C. Daniel, Z. T. Quinkert, M. De, B. Stein, V. D. Bowman, P. R. Chipman, V. M. Rotello, C. C. Kao and B. Dragnea, Nano Lett., 2006, 6, 611–615 CrossRef CAS PubMed.
- F. D. Sikkema, M. Comellas-Aragones, R. G. Fokkink, B. J. M. Verduin, J. J. L. M. Cornelissen and R. J. M. Nolte, Org. Biomol. Chem., 2007, 5, 54–57 CAS.
- J. A. Speir, S. Munshi, G. Wang, T. S. Baker and J. E. Johnson, Structure, 1995, 3, 63–78 CrossRef CAS PubMed.
- S. K. Dixit, N. L. Goicochea, M.-C. Daniel, A. Murali, L. Bronstein, M. De, B. Stein, V. M. Rotello, C. C. Kao and B. Dragnea, Nano Lett., 2006, 6, 1993–1999 CrossRef CAS PubMed.
- L. Loo, R. H. Guenther, S. A. Lommel and S. Franzen, J. Am. Chem. Soc., 2007, 129, 11111–11117 CrossRef CAS PubMed.
- A. de la Escosura, M. Verwegen, F. D. Sikkema, M. Comellas-Aragones, A. Kirilyuk, T. Rasing, R. J. M. Nolte and J. J. L. M. Cornelissen, Chem. Commun., 2008, 1542–1544, 10.1039/B800936H.
- C. Chen, E.-S. Kwak, B. Stein, C. C. Kao and B. Dragnea, J. Nanosci. Nanotechnol., 2005, 5, 2029–2033 CrossRef CAS PubMed.
- D. Gao, Z.-P. Zhang, F. Li, D. Men, J.-Y. Deng, H.-P. Wei, X.-E. Zhang and Z.-Q. Cui, Int. J. Nanomed., 2013, 8, 2119–2128 Search PubMed.
- F. Li, Z.-P. Zhang, J. Peng, Z.-Q. Cui, D.-W. Pang, K. Li, H.-P. Wei, Y.-F. Zhou, J.-K. Wen and X.-E. Zhang, Small, 2009, 5, 718–726 CrossRef CAS PubMed.
- D. Yan, B. Wang, S. Sun, X. Feng, Y. Jin, X. Yao, S. Cao and H. Guo, PLoS One, 2015, 10, e0138883 Search PubMed.
- T. Douglas and M. Young, Nature, 1998, 393, 152–155 CrossRef CAS.
- M. Jaafar, A. A. A. Aljabali, I. Berlanga, R. Mas-Ballesté, P. Saxena, S. Warren, G. P. Lomonossoff, D. J. Evans and P. J. de Pablo, ACS Appl. Mater. Interfaces, 2014, 6, 20936–20942 CAS.
- S. L. Capehart, M. P. Coyle, J. E. Glasgow and M. B. Francis, J. Am. Chem. Soc., 2013, 135, 3011–3016 CrossRef CAS PubMed.
- M.-C. Daniel, I. B. Tsvetkova, Z. T. Quinkert, A. Murali, M. De, V. M. Rotello, C. C. Kao and B. Dragnea, ACS Nano, 2010, 4, 3853–3860 CrossRef CAS PubMed.
- R. Kusters, H.-K. Lin, R. Zandi, I. Tsvetkova, B. Dragnea and P. van der Schoot, J. Phys. Chem. B, 2015, 119, 1869–1880 CrossRef CAS PubMed.
- A. Liu, M. Verwegen, M. V. de Ruiter, S. J. Maassen, C. H. H. Traulsen and J. J. L. M. Cornelissen, J. Phys. Chem. B, 2016, 120, 6352–6357 CrossRef CAS PubMed.
- X. Huang, L. M. Bronstein, J. Retrum, C. Dufort, I. Tsvetkova, S. Aniagyei, B. Stein, G. Stucky, B. McKenna, N. Remmes, D. Baxter, C. C. Kao and B. Dragnea, Nano Lett., 2007, 7, 2407–2416 CrossRef CAS PubMed.
- Y. A. Kabachii, A. S. Golub, S. Y. Kochev, N. D. Lenenko, S. S. Abramchuk, M. Y. Antipin, P. M. Valetsky, B. D. Stein, W. E. Mahmoud, A. A. Al-Ghamdi and L. M. Bronstein, Chem. Mater., 2013, 25, 2434–2440 CrossRef CAS.
- A. G. Malyutin, R. Easterday, Y. Lozovyy, A. Spilotros, H. Cheng, O. R. Sanchez-Felix, B. D. Stein, D. G. Morgan, D. I. Svergun, B. Dragnea and L. M. Bronstein, Chem. Mater., 2015, 27, 327–335 CrossRef CAS.
- L. Shen, J. Zhou, Y. Wang, N. Kang, X. Ke, S. Bi and L. Ren, Small, 2015, 11, 1190–1196 CrossRef CAS PubMed.
- F. Li, Z. P. Zhang, J. Peng, Z. Q. Cui, D. W. Pang, K. Li, H. P. Wei, Y. F. Zhou, J. K. Wen and X. E. Zhang, Small, 2009, 5, 718–726 CrossRef CAS PubMed.
- Y. Zhang, X. Ke, Z. Zheng, C. Zhang, Z. Zhang, F. Zhang, Q. Hu, Z. He and H. Wang, ACS Nano, 2013, 7, 3896–3904 CrossRef CAS PubMed.
- F. Li, K. Li, Z.-Q. Cui, Z.-P. Zhang, H.-P. Wei, D. Gao, J.-Y. Deng and X.-E. Zhang, Small, 2010, 6, 2301–2308 CrossRef CAS PubMed.
- L. M. Bronstein, Small, 2011, 7, 1609–1618 CrossRef CAS PubMed.
- F. Li and Q. Wang, Small, 2014, 10, 230–245 CrossRef CAS PubMed.
- A. M. Wen and N. F. Steinmetz, Chem. Soc. Rev., 2016, 45, 4074–4126 RSC.
- M. Brasch, A. de la Escosura, Y. Ma, C. Uetrecht, A. J. R. Heck, T. Torres and J. J. L. M. Cornelissen, J. Am. Chem. Soc., 2011, 133, 6878–6881 CrossRef CAS PubMed.
- L. Lavelle, M. Gingery, M. Phillips, W. M. Gelbart, C. M. Knobler, R. D. Cadena-Nava, J. R. Vega-Acosta, L. A. Pinedo-Torres and J. Ruiz-Garcia, J. Phys. Chem. B, 2009, 113, 3813–3819 CrossRef CAS PubMed.
- J. Tang, J. M. Johnson, K. A. Dryden, M. J. Young, A. Zlotnick and J. E. Johnson, J. Struct. Biol., 2006, 154, 59–67 CrossRef CAS PubMed.
- A. Hassani-Mehraban, S. Creutzburg, L. van Heereveld and R. Kormelink, BMC Biotechnol., 2015, 15, 80 CrossRef PubMed.
- H. E. van Kan-Davelaar, J. C. M. van Hest, J. J. L. M. Cornelissen and M. S. T. Koay, Br. J. Pharmacol., 2014, 171, 4001–4009 CrossRef CAS PubMed.
- C. R. Kaiser, M. L. Flenniken, E. Gillitzer, A. L. Harmsen, A. G. Harmsen, M. A. Jutila, T. Douglas and M. J. Young, Int. J. Nanomed., 2007, 2, 715–733 CAS.
- N. F. Steinmetz, Nanomedicine Nanotechnol. Biol. Med., 2010, 6, 634–641 CrossRef CAS PubMed.
- R. D. Cadena-Nava, Y. Hu, R. F. Garmann, B. Ng, A. N. Zelikin, C. M. Knobler and W. M. Gelbart, J. Phys. Chem. B, 2011, 115, 2386–2391 CrossRef CAS PubMed.
- D. L. D. Caspar and A. Klug, Cold Spring Harbor Symp. Quant. Biol., 1962, 27, 1–24 CrossRef CAS PubMed.
- R. F. Garmann, M. Comas-Garcia, M. S. T. Koay, J. J. L. M. Cornelissen, C. M. Knobler and W. M. Gelbart, J. Virol., 2014, 88, 10472–10479 CrossRef PubMed.
- R. F. Garmann, M. Comas-Garcia, A. Gopal, C. M. Knobler and W. M. Gelbart, J. Mol. Biol., 2014, 426, 1050–1060 CrossRef CAS PubMed.
- R. F. Garmann, M. Comas-Garcia, C. M. Knobler and W. M. Gelbart, Acc. Chem. Res., 2016, 49, 48–55 CrossRef CAS PubMed.
- D. Luque, A. d. L. Escosura, J. Snijder, M. Brasch, R. J. Burnley, M. S. T. Koay, J. L. Carrascosa, G. J. L. Wuite, W. H. Roos, A. J. R. Heck, J. J. L. M. Cornelissen, T. Torres and J. R. Caston, Chem. Sci., 2014, 5, 575–581 RSC.
- M. Brasch, R. M. Putri, M. V. de Ruiter, D. Luque, M. S. T. Koay, J. R. Castón and J. J. L. M. Cornelissen, J. Am. Chem. Soc., 2017, 139, 1512–1519 CrossRef CAS PubMed.
- J. Sun, C. DuFort, M.-C. Daniel, A. Murali, C. Chen, K. Gopinath, B. Stein, M. De, V. M. Rotello, A. Holzenburg, C. C. Kao and B. Dragnea, Proc. Natl. Acad. Sci. U. S. A., 2007, 104, 1354–1359 CrossRef CAS PubMed.
- O. Tagit, N. Tomczak, A. Jafarpour, D. Jańczewski, M. Y. Han, G. J. Vancso and J. L. Herek, Nanotechnology, 2011, 22, 265701 CrossRef PubMed.
- M. Wang, N. Felorzabihi, G. Guerin, J. C. Haley, G. D. Scholes and M. A. Winnik, Macromolecules, 2007, 40, 6377–6384 CrossRef CAS.
- K.-T. Yong and M. T. Swihart, Nanomedicine, 2012, 7, 1641–1643 CrossRef CAS PubMed.
- R. S.-C. Wu, K.-C. Wu, J.-S. Yang, S.-M. Chiou, C.-S. Yu, S.-J. Chang, F.-S. Chueh and J.-G. Chung, Anticancer Res., 2011, 31, 2203–2208 CAS.
- G. Lin, Z. Ding, R. Hu, X. Wang, Q. Chen, X. Zhu, K. Liu, J. Liang, F. Lu, D. Lei, G. Xu and K.-T. Yong, RSC Adv., 2014, 4, 5792–5797 RSC.
- H. C. Fischer, T. S. Hauck, A. Gómez-Aristizábal and W. C. W. Chan, Adv. Mater., 2010, 22, 2520–2524 CrossRef CAS PubMed.
- Y. Lai, P.-C. Chiang, J. D. Blom, N. Li, K. Shevlin, T. G. Brayman, Y. Hu, J. G. Selbo and L. Hu, Nanoscale Res. Lett., 2008, 3, 321–329 CrossRef CAS.
- Y. Xiao, S. P. Forry, X. Gao, R. D. Holbrook, W. G. Telford and A. Tona, J. Nanobiotechnol., 2010, 8, 1–9 CrossRef PubMed.
- Q. Liu, H. Li, Q. Xia, Y. Liu and K. Xiao, Int. J. Nanomed., 2015, 10, 7073–7088 CAS.
- T. Wang and X. Jiang, ACS Appl. Mater. Interfaces, 2013, 5, 1190–1196 CAS.
- T. G. Iversen, N. Frerker and K. Sandvig, J. Nanobiotechnol., 2012, 10, 33 CrossRef CAS PubMed.
Footnotes |
| † Electronic supplementary information (ESI) available. See DOI: 10.1039/c7ra06684h |
| ‡ Present address: Department of Tumor Immunology, Radboud University Medical Centre and Radboud Institute for Molecular Life Sciences, Nijmegen, The Netherlands. |
| This journal is © The Royal Society of Chemistry 2017 |

