 Open Access Article
Creative Commons Attribution 3.0 Unported Licence
Crystallinity depends on choice of iron salt precursor in the continuous hydrothermal synthesis of Fe–Co oxide nanoparticles
Jian
Liu
 a,
Isabella
Römer
 b,
Selina Vi Yu
Tang
c,
Eugenia
Valsami-Jones
b and
Richard E.
Palmer
*d
aNanoscale Physics Research Laboratory, School of Physics and Astronomy, University of Birmingham, Edgbaston, Birmingham B15 2TT, UK
bSchool of Geography, Earth and Environmental Sciences, University of Birmingham, Edgbaston, Birmingham, B15 2TT, UK
cPromethean Particles Ltd., 1-3 Genesis Park, Midland Way, Nottingham NG7 3EF, UK
dCollege of Engineering, Swansea University, Bay Campus, Fabian Way, Swansea, SA1 8EN, UK. E-mail: r.e.palmer@swansea.ac.uk
First published on 28th July 2017
Abstract
A series of Fe–Co oxide nanoparticles (NPs) were prepared by a continuous hydrothermal method using iron nitrate and ammonium iron citrate as alternative iron precursors. The crystallinity, Fe/Co composition and element spatial distribution in the synthesised NPs were investigated using X-ray diffraction (XRD), aberration-corrected scanning transmission electron microscopy (ac-STEM) imaging, energy-dispersive X-ray spectroscopy (EDX) and electron energy loss spectroscopy (EELS). Strong dependence on the choice of iron salt was observed. We demonstrate that the presence of ammonium citrate markedly improves the crystallinity of the NPs; an ordered cobalt ferrite alloy is formed. We suggest this is due to the formation of a homogenous reaction environment during the thermal decomposition of ammonium citrate, and the formation of complexes among citrate, Fe and Co ions.
Introduction
Magnetic nanoparticles (NPs) have shown great potential for a number of important technological applications, such as information storage, medical diagnosis, drug delivery, etc.1–3 For example, in an alternating magnetic field, magnetic NPs are able to convert electromagnetic energy into thermal energy, which is useful for treatment of cancer by magnetic hyperthermia.4,5 Fe–Co oxide NPs have demonstrated great potential linked to their distinctive properties. They show large magnetic anisotropy, moderate saturation magnetization, chemical stability and mechanical hardness.6–8 The magnetic properties of Fe–Co oxide NPs are believed to be related to their morphology, composition, and cation arrangements.9–11 Joshi et al.9 reported that the saturation magnetization of cobalt ferrite NPs increases with an increase in size, and that spherical NPs exhibit higher saturation magnetization than faceted irregular ones. The effect of stoichiometry, i.e. metal ratio, on the magnetic properties of cobalt ferrite NPs was studied by Sathya et al.10 They reported that the specific absorption rate (relevant for magnetic hyperthermia) and the relaxivity value (significant for magnetic resonance imaging, MRI) of the cobalt ferrite (CoxFe3−xO4) NPs could be tuned not only by the NP's size, but also by the Fe/Co ratio. They concluded that particles of 20 ± 2 nm in size and Co stoichiometry (x) in the x = 0.5–0.7 range are promising candidates as heat mediators for both hyperthermia and MRI applications. Fe–Co oxide NPs usually have a spinel structure with unit formula AB2O4, where A and B stand for tetrahedral and octahedral cation sites within the close packed array of oxygen atoms.12 The metal ion arrangement at different sites also has a strong influence on magnetic properties. Previous studies13–15 have reported the valence states of the Fe and Co cations and their corresponding distributions in the A and B sites of the cobalt ferrite structure with Mössbauer spectra. Liu et al.11 reported that the migration of Co2+ ions from A to B sites could result in an increase in the saturation magnetization and coercivity.The hydrothermal method is one of the most widely used synthesis protocols for the preparation of metal oxide NPs.16,17 By adjusting the synthesis conditions, such as pH, reaction temperature, Co to Fe ratio and surfactants, the particle morphology and Co to Fe ratio in the NPs can be adjusted.16,18,19 The cation distribution in A or B sites can be tuned by changing the reaction time11 or the quenching speed after post-annealing of the Fe–Co oxide NPs.12,20 However, the effect of synthesis conditions on the element spatial distribution of Co and Fe in the NPs is rarely discussed. The degree of inhomogeneous alloying in the NPs will undoubtedly affect their magnetic properties; Antoniak et al.21 found that the magnetic moment of FePt NPs was reduced by 20–30% with respect to the bulk material due to compositional inhomogeneity in the particles. Furthermore, López-Ortega et al.22 synthesized magnetic core/shell NPs of MnxFe3−xO4/FexMn3−xO4 using a seeded growth procedure; the heterostructured NPs showed a strong exchange coupling between the core and shell resulting in a coercivity increase.
Ac-STEM is a powerful tool for characterising binary complex NPs using Z-contrast imaging23,24 and STEM-EELS analysis.25–27 Here we studied the morphology, Fe/Co ratio and Fe and Co distribution of the hydrothermally prepared Fe–Co oxide NPs by ac-STEM. We found that by changing the iron salt, from iron nitrate to ammonium iron citrate, the internal order (crystallinity, elemental distribution, etc.) in the Fe–Co oxide NPs can be changed.
Synthesis procedure and experimental method
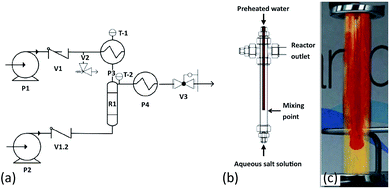
The synthesis of a series of Fe–Co oxide samples at Promethean Particles Ltd (Nottingham, UK) was conducted in water using a continuous-flow hydrothermal reactor, which has previously been described in the literature;28–32 a schematic diagram is shown in Fig. 1. Briefly, deionised water was pumped into an electric preheater at a rate of 20 ml min−1. The water was heated to 400 °C and flowed into the nozzle reactor section of the system, where it met a flow of aqueous metal salt solution at ambient temperature, pumped in at a rate of 10 ml min−1. | ||
| Fig. 1 (a) Flow diagram of continuous flow supercritical water reactor system: P1 and P2 – Gilson HPLC pumps, P3 – water preheater, R1 – nozzle reactor, P4 – cooler, V1, V1.2 – check valves, V2 – pressure relief valve, V3 – Tescom backpressure regulator, T-1,2 – thermocouples. (b) Nozzle reactor design.29 (c) An animated depiction of the nozzle reactor.30 | ||
For each sample, the metal salt solution was composed of the specified concentration ratio of iron and cobalt ions, with total concentration 0.05 M. The cobalt salt used was cobalt(II) acetate tetrahydrate (Co(C2H3O2)2·4H2O, Sigma-Aldrich). Two different iron salts, iron(III) nitrate nonahydrate (Fe(NO3)3·9H2O, Sigma Aldrich) and ammonium iron(III) citrate (C6H8O7·xFe3+·yNH3, Sigma-Aldrich), were used to synthesise sample series INN (iron nitrate nonahydrate) and AIC (ammonium iron citrate), respectively. A summary of the precursor concentrations used is given in Table 1.
| Sample code | Fe/Co ratio | Cobalt acetate (M) | Ammonium iron citrate (M) | Iron nitrate (M) |
|---|---|---|---|---|
| INN-1 | 1![[thin space (1/6-em)]](https://www.rsc.org/images/entities/char_2009.gif) : :![[thin space (1/6-em)]](https://www.rsc.org/images/entities/char_2009.gif) 3 3 |
0.0375 | — | 0.0125 |
| INN-2 | 1![[thin space (1/6-em)]](https://www.rsc.org/images/entities/char_2009.gif) : :![[thin space (1/6-em)]](https://www.rsc.org/images/entities/char_2009.gif) 1 1 |
0.0250 | — | 0.0250 |
| INN-3 | 3![[thin space (1/6-em)]](https://www.rsc.org/images/entities/char_2009.gif) : :![[thin space (1/6-em)]](https://www.rsc.org/images/entities/char_2009.gif) 1 1 |
0.0125 | — | 0.0375 |
| AIC-1 | 1![[thin space (1/6-em)]](https://www.rsc.org/images/entities/char_2009.gif) : :![[thin space (1/6-em)]](https://www.rsc.org/images/entities/char_2009.gif) 3 3 |
0.0375 | 0.0125 | — |
| AIC-2 | 1![[thin space (1/6-em)]](https://www.rsc.org/images/entities/char_2009.gif) : :![[thin space (1/6-em)]](https://www.rsc.org/images/entities/char_2009.gif) 1 1 |
0.0250 | 0.0250 | — |
| AIC-3 | 3![[thin space (1/6-em)]](https://www.rsc.org/images/entities/char_2009.gif) : :![[thin space (1/6-em)]](https://www.rsc.org/images/entities/char_2009.gif) 1 1 |
0.0125 | 0.0375 | — |
For the AIC-1 sample, the water flow feed also contained 0.25% v/v hydrogen peroxide (H2O2, Fisher Scientific, UK). Hydrogen peroxide was used here to drive oxidation of the cobalt precursor. A reaction temperature of 400 °C was chosen to keep a high rate of conversion and the whole system pressure was maintained at 240 bar by a backpressure regulator. The collected samples were washed by centrifugation or filtration and then sent to the University of Birmingham for characterisation.
The samples were imaged in a 200 kV JEM2100F (JEOL) STEM with a spherical aberration probe corrector (CEOS). High-angle annular dark field (HAADF) images were acquired with inner and outer detector semi-angles of 62 and 164 mrad (camera length 10 cm), and probe convergence semi-angle of 19 mrad. The elemental composition was determined by EDX spectra, which were obtained with a Bruker XFlash 4030 detector attached to the microscope. The EELS spectra were recorded with a Gatan Enfina detector at a camera length of 2 cm and a collection semi-angle of 57.8 mrad. Zeta potential measurements were made with a Malvern Zetasizer ZS system. Measurements were performed at 21 °C and repeated at least 5 times per sample using a low volume zeta potential cell, which was washed with ultra-high purity (UHP) water in between each sample. The X-ray diffraction (XRD) patterns were collected using a Bruker D8 powder diffractometer using Cu Kα radiation (λ = 1.5406 Å).
Results and discussion
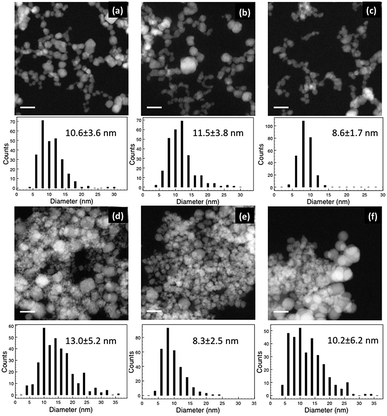
Fig. 2 shows the HAADF images and corresponding histograms of NP diameter for the samples from the INN and AIC batches. In both cases, the NPs were aggregated. However, the level of agglomeration of the NPs in the AIC sample series was higher than that in the INN series, which agrees with the zeta potential measurements. The average zeta potential (shown in Table 2) of the INN samples is larger than the AIC series, indicating a higher stability and lower level of agglomeration. From the size distribution histograms, it can be seen that the diameter ranged from around 5 to 30 nm, and that the AIC sample series had more large particles (>15 nm). Overall, the average diameters of the two batches of samples were close to each other. Changing the iron salt in the solution seems to have an effect on the dispersion of the hydrothermally synthesised Fe–Co NPs.| Sample code | Zeta potential (mV) |
|---|---|
| INN-1 | 17.8 ± 0.6 |
| INN-2 | 20.5 ± 0.7 |
| INN-3 | 19.7 ± 0.5 |
| AIC-1 | 18.8 ± 0.4 |
| AIC-2 | 8.5 ± 0.3 |
| AIC-3 | −7.3 ± 0.2 |
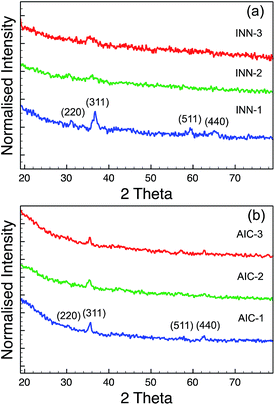
The XRD results from the INN and AIC sample series are shown in Fig. 3. The XRD spectra of the INN samples (Fig. 3a) suggested that the Fe–Co oxide NPs from INN-2 and -3 are not well crystallised, since the diffraction peaks were weak and broad. The crystallite sizes of Fe–Co nanoparticles in the INN series are calculated using the Scherer equation,33
D = Kλ/β![[thin space (1/6-em)]](https://www.rsc.org/images/entities/char_2009.gif) cos cos![[thin space (1/6-em)]](https://www.rsc.org/images/entities/char_2009.gif) θ, θ, |
Table 3 shows the elemental compositions of each sample in the INN and AIC series. It is important to note that the Fe/Co ratios of the synthesised INN samples are close to the ratios in the metal salt solutions. In the case of the AIC samples, these two ratios are very different, and the Fe/Co ratios detected in the particles are always higher than in the solutions. This may be caused by the ammonium citrate in the solutions. In the hydrothermal synthesis of iron oxide particles from ammonium iron citrate, it has been reported that the Fe3+ can be reduced to Fe2+ by the carbon monoxide formed from the thermal decomposition of ammonium citrate in the supercritical water.37,38 In a reducing environment, the oxidation of Co2+ to Co3+ will also be highly suppressed and the precipitation of Co ions from the solution will become more difficult.16 This could explain why the Co content detected in the AIC samples was always lower than expected. For the samples in the INN series, where iron nitrate was used as the precursor, the nitrate ions might act as an oxidation agent to drive the Co2+ to Co3+.
| Sample code | Fe/Co ratio | Element (at%) | ||
|---|---|---|---|---|
| O | Fe | Co | ||
| INN-1 | 0.37 ± 0.02 | 62.2 ± 2.4 | 10.2 ± 0.4 | 27.6 ± 1.0 |
| INN-2 | 0.91 ± 0.05 | 61.0 ± 2.7 | 18.6 ± 0.8 | 20.5 ± 0.8 |
| INN-3 | 3.17 ± 0.15 | 66.4 ± 2.4 | 25.6 ± 0.8 | 8.1 ± 0.3 |
| AIC-1 | 1.87 ± 0.08 | 58.4 ± 1.9 | 27.1 ± 0.8 | 14.5 ± 0.5 |
| AIC-2 | 2.56 ± 0.11 | 62.6 ± 1.9 | 26.9 ± 0.8 | 10.5 ± 0.3 |
| AIC-3 | 3.22 ± 0.12 | 51.5 ± 1.4 | 37.0 ± 1.0 | 11.5 ± 0.3 |
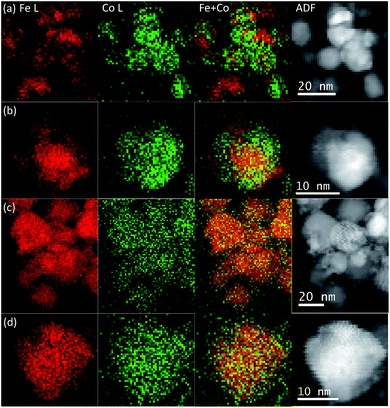
The element spatial distribution of the metals in the samples was studied by STEM-EELS and some mapping results are shown in Fig. 4. We found that the element spatial distributions in the NPs synthesised with iron nitrate (INN batch) were not uniform, as is shown in Fig. 4a and b. A Co-rich region tended to lie at the surface of the particles and an Fe-rich area in the core. However, a complete core–shell structure was not observed, and in some cases, even a “dumbbell” distribution of Fe and Co was also observed. The non-uniform elemental distribution in the NPs of INN samples may be caused by the nitrate anions in the iron salt and the solubility of the Fe and Co ions in the solutions. Previous studies16,39 implied that Co oxide NPs could not be precipitated from cobalt nitrate solutions in the absence of a base, or that only a few large particles could be produced when Co nitrate was in contact with supercritical water.40 In contrast, the solubility of Fe ions in the iron nitrate solution is several orders of magnitude lower than that of Co in its nitrate solution.16 Therefore, the nucleation of Fe oxide or hydroxide particles is easier than that of Co oxide or hydroxide during hydrothermal processing. Consequently, the Co cations may then proceed to precipitate on the surface of Fe oxide particles due to ion diffusion in the solution, forming Co and Fe-rich areas. This also explains why the Fe-rich regions tend to be in the core and Co-rich regions on the surface.
For the AIC sample series, we found that the Fe and Co spatial distributions in these NPs were very uniform (shown in Fig. 4c and d). In this case, cobalt ferrite is the likely product as the XRD results indicate. There are two possible reasons for the uniform elemental distributions. First, the CO molecules produced by the thermal decomposition of citrate37,41 are expected to be miscible with supercritical water and provide a homogeneous reaction environment promoting the oxidizing and reducing capability.38 Second, citrate anions can form complexes with Fe and Co cations, respectively. Citrate complexes of Fe or Co have been reported elsewhere in the literatures;42,43 the citrate ligand binds to Fe or Co atoms through the O atom of the hydroxyl group and the carboxyl group. A formation of these complexes (among Fe ions, Co ions and citrate) in the cobalt iron salts solution will promote the simultaneous precipitation of Fe and Co ions during the thermal decomposition process,41,44 resulting in a uniform elemental distribution.
Controlling the elemental arrangement in magnetic alloy NPs is of great importance, not only because it can change the magnetic properties of the particles21 but also because it might influence their toxicities and biocompatibilities. Iron oxide NPs are widely used in in vivo applications because of their low toxicity and biocompatibility.45,46 For the Fe–Co oxide NPs, the non-uniform distribution of Co oxide (especially when the Co rich region is on the surface of the NPs) may increase the toxicity of the particles, since it has been reported that Co NPs can induce cytotoxicity and genotoxicity in cells.47–49 A toxicity investigation of the Fe–Co oxide NPs reported in this work is in progress, and may shed light on the effect of the spatial distributions of the metals in the NPs on the toxicity.
Conclusions
In summary, we have explored a continuous hydrothermal method to prepare Fe–Co oxide NPs using two different iron salts as precursors. We found that the iron salt anions have a significant effect on the degree of crystallinity and aggregation, composition of the NPs, and spatial distribution of the metals in the NPs. The Fe–Co oxide NPs prepared with ammonium iron citrate were found to be well crystallised and had a more uniform Fe and Co distribution than the particles synthesised with an iron nitrate precursor. We suggest that ammonium citrate provides homogeneous reaction environment and promotes the simultaneous precipitation of Fe and Co ions by forming complexes. Overall, our investigation into the effect of precursor salt on the continuous hydrothermal synthesis is helpful to understanding the reaction process, allowing for better control of the NPs produced.Acknowledgements
We thank Wolfgang Theis for a careful reading of this manuscript. We thank the EPSRC (EP/K006061/1) and the European Commission's 7th Framework Programme project “NanoMILE” (contract no. NMP4-LA-2013-310451) for financial support. The STEM instrument employed in this research was obtained through the Birmingham Science City project “Creating and Characterising Next Generation Advanced Materials,” supported by Advantage West Midlands (AWM) and funded in part by the European Regional Development Fund (ERDF). JL acknowledges the Chinese Scholarship Council and the University of Birmingham for funding of his doctorate studies.Notes and references
- A. K. Nikumbh, R. A. Pawar, D. V. Nighot, G. S. Gugale, M. D. Sangale, M. B. Khanvilkar and A. V. Nagawade, J. Magn. Magn. Mater., 2014, 355, 201–209 CrossRef CAS.
- S. Mornet, S. Vasseur, F. Grasset and E. Duguet, J. Mater. Chem., 2004, 14, 2161–2175 RSC.
- P. K. Jain, X. Huang, I. H. El-Sayed and M. A. El-Sayed, Acc. Chem. Res., 2008, 41, 1578–1586 CrossRef CAS PubMed.
- J. Lee, J. Jang, J. Choi, S. H. Moon, S. Noh, J. Kim, J. G. Kim, I. Kim, K. I. Park and J. Cheon, Nat. Nanotechnol., 2011, 6, 418–422 CrossRef CAS PubMed.
- E. Fantechi, C. Innocenti, M. Zanardelli, M. Fittipaldi, E. Falvo, M. Carbo, V. Shullani, L. Di Cesare Mannelli, C. Ghelardini, A. M. Ferretti, A. Ponti, C. Sangregorio and P. Ceci, ACS Nano, 2014, 8, 4705–4719 CrossRef CAS PubMed.
- F. Tihay, G. Pourroy, M. Richard-Plouet, A. C. Roger and A. Kiennemann, Appl. Catal., A, 2001, 206, 29–42 CrossRef CAS.
- D. S. Mathew and R. S. Juang, Chem. Eng. J., 2007, 129, 51–65 CrossRef CAS.
- B. G. Toksha, S. E. Shirsath, S. M. Patange and K. M. Jadhav, Solid State Commun., 2008, 147, 479–483 CrossRef CAS.
- H. M. Joshi, Y. P. Lin, M. Aslam, P. V. Prasad, E. A. Schultz-Sikma, R. Edelman, T. Meade and V. P. Dravid, J. Phys. Chem. C, 2009, 113, 17761–17767 CAS.
- A. Sathya, P. Guardia, R. Brescia, N. Silvestri, G. Pugliese, S. Nitti, L. Manna and T. Pellegrino, Chem. Mater., 2016, 28, 1769–1780 CrossRef CAS.
- M. Liu, M. Lu, L. Wang, S. Xu, J. Zhao and H. Li, J. Mater. Sci., 2016, 51, 5487–5492 CrossRef CAS.
- G. A. Sawatzky, J. Appl. Phys., 1968, 39, 1204 CrossRef CAS.
- S. Kawano, N. Yamamoto and N. Achiwa, Jpn. J. Appl. Phys., 1974, 13, 1891–1892 CrossRef CAS.
- P. J. Murray and J. W. Linnett, J. Phys. Chem. Solids, 1976, 37, 1041–1042 CrossRef CAS.
- P. A. Smith, C. D. Spencer and R. P. Stillwell, J. Phys. Chem. Solids, 1978, 39, 107–111 CrossRef CAS.
- L. J. Cote, A. S. Teja, A. P. Wilkinson and Z. J. Zhang, J. Mater. Res., 2003, 210, 307–317 CAS.
- T. J. Daou, G. Pourroy, S. Begin-Colin, J. M. Greneche, C. Ulhaq-Bouillet, P. Legare, P. Bernhardt, C. Leuvrey and G. Rogez, Chem. Mater., 2006, 18, 4399–4404 CrossRef CAS.
- D. Zhao, X. Wu, H. Guan and E. Han, J. Supercrit. Fluids, 2007, 42, 226–233 CrossRef CAS.
- L. Zhao, H. Zhang, Y. Xing, S. Song, S. Yu, W. Shi, X. Guo, J. Yang, Y. Lei and F. Cao, J. Solid State Chem., 2008, 181, 245–252 CrossRef CAS.
- G. A. Sawatzky, F. Van Der Woude and A. H. Morrish, Phys. Rev., 1969, 187, 747–757 CrossRef CAS.
- C. Antoniak, M. Spasova, A. Trunova, K. Fauth, F. Wilhelm, A. Rogalev, J. Minár, H. Ebert, M. Farle and H. Wende, J. Phys.: Condens. Matter, 2009, 21, 336002 CrossRef CAS PubMed.
- A. López-Ortega, M. Estrader, G. Salazar-Alvarez, S. Estradé, I. V. Golosovsky, R. K. Dumas, D. J. Keavney, M. Vasilakaki, K. N. Trohidou, J. Sort, F. Peiró, S. Suriñach, M. D. Baró and J. Nogués, Nanoscale, 2012, 4, 5138–5147 RSC.
- N. Jian and R. E. Palmer, J. Phys. Chem. C, 2015, 119, 11114–11119 CAS.
- F. Yin, Z. W. Wang and R. E. Palmer, J. Am. Chem. Soc., 2011, 133, 10325–10327 CrossRef CAS PubMed.
- I. Romer, Z. Wang, R. C. Merrifield, R. E. Palmer and J. R. Lead, Environ. Sci. Technol., 2016, 50, 2183–2190 CrossRef CAS PubMed.
- M. Baalousha, K. P. Arkill, I. Romer, R. E. Palmer and J. R. Lead, Sci. Total Environ., 2015, 502, 344–353 CrossRef CAS PubMed.
- Y. Li, Z. W. Wang, C.-Y. Chiu, L. Ruan, W. Yang, Y. Yang, R. E. Palmer and Y. Huang, Nanoscale, 2012, 4, 845–851 RSC.
- H. Hobbs, S. Briddon and E. Lester, Green Chem., 2009, 11, 484–491 RSC.
- E. Lester, G. Aksomaityte, J. Li, S. Gomez, J. Gonzalez-Gonzalez and M. Poliakoff, Prog. Cryst. Growth Charact. Mater., 2012, 58, 3–13 CrossRef CAS.
- F. Moro, S. V. Y. Tang, F. Tuna and E. Lester, J. Magn. Magn. Mater., 2013, 348, 1–7 CrossRef CAS.
- E. Lester, S. V. Y. Tang, A. Khlobystov, V. L. Rose, L. Buttery and C. J. Roberts, CrystEngComm, 2013, 15, 3256 RSC.
- Q. Wang, S. V. Y. Tang, E. Lester and D. O'Hare, Nanoscale, 2013, 5, 114–117 RSC.
- P. Scherrer, Nachr. Ges. Wiss. Goettingen, Math.-Phys. Kl., Fachgruppe 2, 1918, 96 CAS.
- T. A. S. Ferreira, J. C. Waerenborgh, M. H. R. M. Mendonça, M. R. Nunes and F. M. Costa, Solid State Sci., 2003, 5, 383–392 CrossRef CAS.
- Y. I. Kim, D. Kim and C. S. Lee, Phys. B, 2003, 337, 42–51 CrossRef CAS.
- Z. Ma, L. Ren, S. Xing, Y. Wu and Y. Gao, J. Phys. Chem. C, 2015, 119, 23068–23074 CAS.
- T. Adschiri, K. Kanazawa and K. Arai, J. Am. Ceram. Soc., 1992, 75, 1019–1022 CrossRef CAS.
- T. Adschiri, Y. Hakuta and K. Arai, Ind. Eng. Chem. Res., 2000, 39, 4901–4907 CrossRef CAS.
- L. J. Cote, A. S. Teja, A. P. Wilkinson and Z. J. Zhang, J. Mater. Res., 2002, 19, 2410–2416 CrossRef.
- Y. Hao and A. Teja, J. Mater. Res., 2003, 18, 415–422 CrossRef CAS.
- N. S. Gajbhiye and S. Prasad, Thermochim. Acta, 1996, 285, 325–336 CrossRef CAS.
- T. Birsa Čelič, Z. Jagličič, K. Lazar and N. Zabukovec Logar, Acta Crystallogr., 2013, 69, 490–495 Search PubMed.
- Z. Zhou, Y. Deng and H. Wan, Cryst. Growth Des., 2005, 5, 1109–1117 CAS.
- S. Prasad, A. Vijayalakshmi and N. S. Gajbhiye, J. Therm. Anal. Calorim., 1998, 52, 595–607 CrossRef CAS.
- R. Weissleder, D. D. Stark, B. L. Engelstad, B. R. Bacon, C. C. Compton, D. L. White, P. Jacobs and J. Lewis, Am. J. Roentgenol., 1989, 152, 167–173 CrossRef CAS PubMed.
- Y. Wu, Y. Wang, G. Luo and Y. Dai, Bioresour. Technol., 2009, 100, 3459–3464 CrossRef CAS PubMed.
- E. Papis, F. Rossi, M. Raspanti, I. Dalle-Donne, G. Colombo, A. Milzani, G. Bernardini and R. Gornati, Toxicol. Lett., 2009, 189, 253–259 CrossRef CAS PubMed.
- J. Ponti, E. Sabbioni, B. Munaro, F. Broggi, P. Marmorato, F. Franchini, R. Colognato and F. Rossi, Mutagenesis, 2009, 24, 439–445 CrossRef CAS PubMed.
- S. Chattopadhyay, S. K. Dash, S. Tripathy, B. Das, D. Mandal, P. Pramanik and S. Roy, Chem.-Biol. Interact., 2015, 226, 58–71 CrossRef CAS PubMed.
| This journal is © The Royal Society of Chemistry 2017 |


