 Open Access Article
Creative Commons Attribution 3.0 Unported Licence
Calcium hydroxide doped by KNO3 as a promising candidate for thermochemical storage of solar heat
Alexandr Shkatulov *ab and
Yuri Aristovab
aBoreskov Institute of Catalysis, Ac. Lavrentieva Av. 5, Novosibirsk, 630090, Russia. E-mail: shkatuov@catalysis.ru; Fax: +7-383-3309573; Tel: +7-383-3309573
bNovosibirsk State University, Pirogova Str. 2, Novosibirsk, 630090, Russia
First published on 5th September 2017
Abstract
New materials for thermochemical storage of concentrated solar heat are highly desirable for making this emerging technology competitive with the traditional sensible and latent heat storage. Keeping this in mind, we have prepared calcium hydroxide modified with potassium nitrate and studied its de-/rehydration dynamics by differential scanning calorimetry and thermogravimetry techniques. The following notable observations are described for the modified Ca(OH)2: (1) an acceleration of the dehydration and reduction of its temperature as compared with the pure hydroxide; (2) the temperature reduction depends on the KNO3 content Y and reaches 35 °C at Y = 5 wt%; (3) the addition of KNO3 only slightly reduces the dehydration heat which remains promising for heat storage applications. Fast rehydration of the doped CaO is observed at T = 290–360 °C and P(H2O) = 23–128 mbar, and its rate strongly depends on both temperature and pressure. De- and rehydrated products were studied by the BET analysis and IR-spectroscopy to elucidate possible ways for the salt to influence the Ca(OH)2 dehydration. The mechanism involving a chemical interaction between the salt and the hydroxide is discussed. The new material exhibits a large heat storage density, fast de-/rehydration and adjustable decomposition temperature, and may be considered as a promising candidate for thermochemical storage of concentrated solar energy.
1. Introduction
The present increase in the world's energy demand along with restrictions on the use of fossil fuels has spurred research activity in the area of renewable energy including concentrated solar radiation. Development of concentrated solar power (CSP) technologies has made heat with middle-temperature potential (200–500 °C) available and useful for production of overheated steam followed by the generation of electricity.1 For instance, parabolic troughs are able to maintain the focal line temperature in an interval of 350–400 °C![[thin space (1/6-em)]](https://www.rsc.org/images/entities/char_2009.gif) 2 and parabolic dishes allow temperatures of 250–700 °C to be obtained.3
2 and parabolic dishes allow temperatures of 250–700 °C to be obtained.3
Heat storage mitigates a mismatch between energy supply and demand inevitably present if one uses the solar radiation as a source of heat. Therefore, storage of middle-temperature heat is one of the crucial technologies for systems using solar concentrators for heat production which makes heat available on cloudy days or at night.
There are three ways to store middle-temperature heat. The first one is sensible heat storage by rocks, sand, oil, etc.4 The second way involves fusion of salts,5 mainly nitrates,6,7 or metals.8 The third way represents heat storage by means of chemical reactions9 or adsorption,10 i.e. heat is stored in a form of chemical species. Sensible and latent heat storages are well-developed and used commercially. Thermochemical heat storage is an attractive alternative to the first two methods since it ensures a higher energy storage density and negligible thermal losses.
Middle-temperature thermochemical heat storage (MT-THS) is an emerging technology with a limited range of promising chemical reactions and materials. The MT-THS may be carried out by decomposition of NH3,11 NH4HSO4,12 dehydrogenation of MgH2![[thin space (1/6-em)]](https://www.rsc.org/images/entities/char_2009.gif) 13 or cyclohexane,14 etc. For the last decades, metal hydroxides were widely studied as materials for MT-THS.9 One of the most promising hydroxides is Ca(OH)2 which stores heat in the course of its dehydration:
13 or cyclohexane,14 etc. For the last decades, metal hydroxides were widely studied as materials for MT-THS.9 One of the most promising hydroxides is Ca(OH)2 which stores heat in the course of its dehydration:
| Ca(OH)2(s) = CaO(s) + H2O(g), ΔrHo298 = 104.4 kJ mol−1. | (1) |
This endothermic process corresponds to heat storage while during the exothermic rehydration the stored heat is released.15 Calcium hydroxide ensures a high heat storage density up to 1400 kJ kg−1 or 3.1 GJ m−3 (the real volumetric density, however, may be ca. two times lower due to lower apparent density of Ca(OH)2). This hydroxide is non-corrosive, non-hazardous, inexpensive and stable over cycling.16 Due to these virtues, reaction (1) was proposed for CSP applications17 and chemical heat pumps.18,19
A simple chemical heat pump, that operates under a closed cycle mode, consists of two vessels, namely, a reactor where reaction (1) takes place and a condenser/evaporator (Fig. 1a). During the heat storage stage (1 → 2 on Fig. 1b), middle-temperature heat is supplied to the reactor to initiate the hydroxide decomposition. The resultant water vapour condenses in the condenser at constant pressure. During this stage, the valve between the vessels is open and water vapour moves freely from the reactor to the condenser as no other gas is present in the unit.
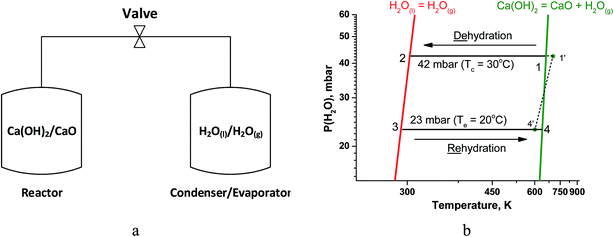 | ||
| Fig. 1 (a) Schematic representation of a closed THS system. (b) Schematics of thermodynamic cycle of H2O/CaO heat storage studied in the paper. | ||
At the heat release stage, a low-grade ambient heat (at 20–30 °C) is supplied to the evaporator (the same vessel as the condenser) to generate vapour (at point 3, Fig. 1b) and carry out the isobaric rehydration of CaO (3 → 4). During this stage, water vapour moves freely from the evaporator to the reactor, and the useful heat is released to a consumer at point 4.
According to the Gibbs phase rule, the equilibrium of reaction (1) is monovariant for bulk phases since both CaO and Ca(OH)2 exist only in one form. Hence, there is an one-to-one correspondence between temperature T and water vapour pressure P(H2O) over the solids.20 This correspondence is expressed by a linear form of the van't Hoff equation (Fig. 1b, green line):
 | (2) |
Increasing the dehydration rate at the lower temperature is beneficial as it could (a) facilitate the heat storage, (b) broaden the range of heat sources available for MT-THS, and (c) increase the second-law efficiency of MT-THS by adjusting the dehydration temperature to the temperature of the heat source.22
A thermophysical approach to increasing the hydroxide dehydration rate does not change thermodynamic parameters of reaction (1) and consists in amelioration of transport properties of the hydroxide grain or bed which affect the overall efficiency of heat storage in real devices. For instance, use of copper fins intensifies the heat transfer in the bed and decomposition rate of Ca(OH)2 bed.23 The addition of graphite to Ca(OH)2 also enhances heat transfer and accelerates the dehydration.24 Coating of Ca(OH)2 with SiO2 nanoparticles prevents agglomeration of oxide particles during dehydration,25 however, gradual degradation of the material due to a side chemical reaction was found afterwards. Impregnation of Ca(OH)2 into vermiculite matrix to accelerate the dehydration was reported in ref. 26. Recently, composites of Ca(OH)2 and sodium silicate with enhanced mechanical properties have been proposed for MT-THS.27
The complementary approach suggests a chemical modification of calcium hydroxide by various additives to reduce the dehydration temperature. Homogeneous doping of Ca(OH)2 with Al3+, Zn2+, Cu2+, and Ni2+ (1–5 at% of a doping cation) was shown to lower the dehydration temperature and increase the process rate at 450 °C.28 Based on the kinetic analysis, the authors discussed possible reasons for the rate enhancement, namely, the introduction of additional nucleation sites (e.g. point substitution defects) and lowering the activation energy. It was theoretically shown that the doping Ca(OH)2 with Li+ and Mg2+ can reduce the energy barrier for the dehydration.29 This conclusion was experimentally corroborated for the lithium additive in ref. 30.
First attempt to chemically modify Ca(OH)2/CaO system for MT-THS was made by using LiCl as a heterogeneous doping additive to improve rehydration reactivity of the resulting CaO.31 The range of modifying salts was significantly expanded in ref. 21 where several classes of alkali metal salts (nitrates, acetates, chlorides and sulphates) were systematically screened to elucidate their effect on the Ca(OH)2 dehydration. The maximal reduction of the dehydration temperature was revealed for KNO3 as a doping salt.
So far, a detailed study of the novel composite KNO3/Ca(OH)2 has not been carried out. The comprehensive investigation of its de-/rehydration kinetics is necessary to consider its applicability for CSP storage in closed THS cycles. This work is aimed at such study. The emphasis is put on the properties of the modified material KNO3/Ca(OH)2 important for CSP storage as well as on the understanding the effect of modification. The dehydration temperature, heat storage capacity, de- and rehydration kinetics as a function of temperature and vapour pressure are reported and analyzed. A mechanism of the KNO3 effect on the Ca(OH)2 dehydration is also discussed in the light of data obtained by various physicochemical methods.
2. Experimental
2.1. Materials preparation
A reference calcium hydroxide (hereinafter referred to as CH) was prepared by hydration of CaO (>99.9%) which was preliminarily calcined at 900 °C for 4 hours for the elimination of possible carbonate impurities. The hydration was carried out by degassed distilled water. A mixture of CaO and water was sealed in an autoclave and kept at T = 110 °C for 18 hours. The resultant Ca(OH)2 was filtered and washed by distilled degassed water.Composites KNO3/Ca(OH)2 with a varied salt content of 0.5–20 wt% were prepared by mixing CH with KNO3 (>99.9%, Reakhim Ltd). A mechanical mixture of Ca(OH)2 and KNO3 in necessary proportion was placed in a flask and the distilled degassed water was added. The subsequent drying at 60 °C in vacuum under vigorous stirring ensured a uniform salt distribution over Ca(OH)2 surface. Finally, the material was dried at 120 °C. We will refer to a sample with KNO3 weight content Y% as PN/CH-Y (Potassium Nitrate/Calcium Hydroxide-Y) (Table 1).
| Sample | Content, wt% | Content, mol% |
|---|---|---|
| PN/CH-0.5 | 0.5 | 0.4 |
| PN/CH-1 | 1.0 | 0.7 |
| PN/CH-2 | 2.0 | 1.5 |
| PN/CH-5 | 5.0 | 3.7 |
| PN/CH-10 | 10.0 | 7.5 |
| PN/CH-15 | 15.0 | 11.4 |
| PN/CH-20 | 20.0 | 15.5 |
The material PN/CH-5 was calcined in air at 400 °C for 2 hours (PN/CaO). The resulting PN/CaO was rehydrated by water vapour (0.2 bar) at 60 °C for 1 hour to get the rehydrated material PN/CH-5-r.
2.2. Materials characterization
Dehydration kinetics was studied at T = 370, 380, 390, and 400 °C and P(H2O) = 23 mbar that corresponds to Tc = 20 °C in the condenser. It was chosen as a typical ambient temperature at which water vapour released during dehydration was condensed. A sample of 35–40 mg (fine powder) was placed in a measuring cell which was hermetically sealed afterwards. The small mass of the sample ensured that the heat and mass transfer limitations within the material had negligible effect on the overall reaction kinetics. After sealing, the cell was vacuumed by a pump. After this, the sample was dried at 120 °C. Then, water vapour was introduced into the measuring cell by connecting it to the evaporator. After gaining a constant weight, the cell temperature was quickly increased from 120 °C to a specified one, and the dehydration occurred at constant pressure (23 mbar).
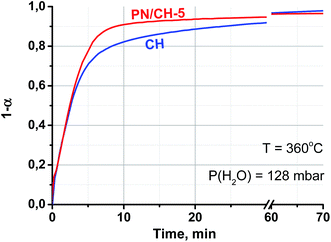
Rehydration kinetics was systematically studied either at fixed water vapour pressure P(H2O) = 23 mbar and various T = 290, 300 and 310 °C or at fixed temperature T = 330 °C and various P(H2O) = 23, 32 and 43 mbar. These correspond to the pressures of saturated water vapour at ambient temperatures, respectively, 20 °C, 25 °C, and 30 °C, because the ambient heat is expected to be used to generate for free water vapour during the heat release (rehydration) stage. Moreover, additional experiments were done at T = 360 °C and P(H2O) = 128 mbar (Te = 51 °C) in order to have a brief idea how the materials perform at a higher vapour pressure. Before the experiments, a sample was fully dehydrated under vacuum at T = 400 °C. After that, the reaction chamber, still under vacuum, was cooled down to the desired rehydration temperature. Then, the rehydration was initiated by connection of the measuring cell with the evaporator maintained at Te = 20 °C, 25 °C, and 30 °C to fix the appropriate vapour pressure over the sample. Every rehydration kinetic experiment was repeated thrice in order to ensure reproducibility.
The conversion degree for both de- and rehydration was determined as
| α = [m(0) − m(t)]/mH2O, | (3) |
3. Results
3.1. DSC analysis
The DSC curves of the doped Ca(OH)2 (PN/CH-Y) exhibit a broad endothermic peak of the Ca(OH)2 dehydration (Fig. 2a). The position of the peak depends on the KNO3 content: the dehydration start temperature or the onset temperature Tonset decreases from 494 °C to 459 °C when the KNO3 content increases from 0 to 5 wt% (Fig. 2b). Even small quantities of KNO3 considerably affect the dehydration, e.g. a 0.5% KNO3 additive reduces Tonset by 19 °C. At Y = 5 wt%, the minimal Tonset is reached. Thus, varying the KNO3 content is an efficient and convenient tool for managing the Ca(OH)2 dehydration temperature within the 35 °C range below that of the pure Ca(OH)2 (CH).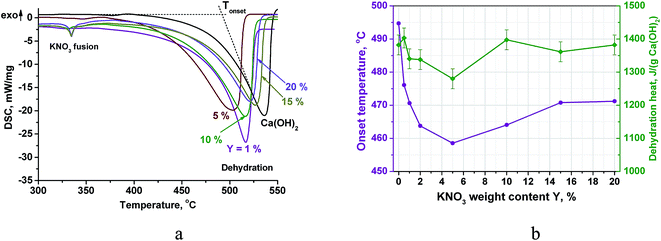 | ||
| Fig. 2 DSC-thermograms of PN/CH-Y materials (a), the dehydration temperature and heat at various salt contents (b). | ||
At larger salt contents (Y ≥ 10%), a small endothermic peak appears at 334 °C (Fig. 3a). This effect can be ascribed to a fusion of crystalline KNO3.32 The apparent specific heat of KNO3 melting calculated by the peak integration at Y = 20% is about 12 J g−1. This value is lower than calculated from the melting heat of bulk KNO3 and the salt content in PN/CH-20 (21 J g−1). The discrepancy indicates that the state of potassium nitrate in the mixtures PN/CH-Y differs from its bulk crystalline state.
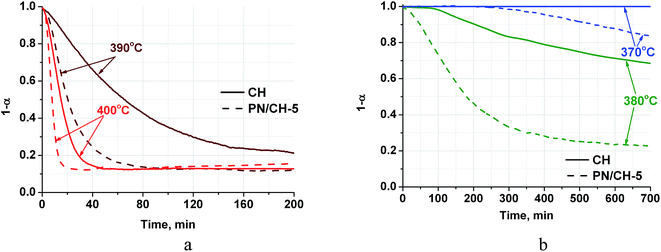 | ||
| Fig. 3 Dehydration kinetic curves for CH and PN/CH-5 at T = 390–400 °C (a) and 370–380 °C (b), P(H2O) = 23 mbar. | ||
Integration of the DSC dehydration peaks demonstrates that the estimated heat of dehydration also reaches a minimum at Y = 5% along with the onset temperature. For PN/CH-5, a dehydration heat of 1280 J g−1 is only 7% less than the dehydration heat of CH, therefore, it is still promising for MT-THS. For the further detailed study of the dehydration/rehydration kinetics, we have chosen the material with the minimal dehydration temperature, namely, PN/CH-5.
3.2. Dehydration kinetics
Complete dehydration of CH in vacuum shows the total weight loss mH2O/m0 = 0.240–0.244. This value is in good agreement with the theoretical loss (0.243) calculated from the stoichiometry of reaction (1). For PN/CH-5, the weight loss equals 0.230 that also fits the reaction stoichiometry if one makes a correction for the salt content.The dehydration kinetic curves for CH and PN/CH-5 at 390 °C and 400 °C are of a decelerating type and do not have induction period (Fig. 3a). The doped material PN/CH-5 exhibits a half-conversion time shorter by a factor of 2–3 (Table 2). At 380 °C, CH exhibits a sigmoid kinetic curve with the induction period of about 100 min, whereas the induction period for PN/CH-5 is absent (Fig. 3b) and the ratio of half-conversion times (τ0.5(CH)/τ0.5(PN/CH-5)) exceeds 5. An induction period in gas–solid reactions is commonly ascribed to a low rate of the nuclei formation.33 Therefore, one may suggest that the doping of Ca(OH)2 with KNO3 facilitates the nucleation.
| Temperature, °C | CH | PN/CH-5 |
|---|---|---|
| 380 | — | 180 |
| 390 | 65 | 20 |
| 400 | 15 | 7 |
At 370 °C no dehydration of CH is detected for at least 2600 min (only the first 700 min are displayed in Fig. 3b). This may be due to a low driving force for nucleation as the reaction is close to its equilibrium. Indeed, the equilibrium temperature, calculated from the thermodynamic data of ref. 34, at P = 23 mbar equals 361 °C that is just 9 °C lower than the temperature of the discussed dehydration run. It is important that the doped hydroxide PN/CH-5 yet starts to decompose at this temperature, albeit after an induction period of 250–300 min (Fig. 3b). Thus, the doped material shows higher dehydration rates at T = 370–400 °C as compared with the pure Ca(OH)2 under the conditions typical for a closed THS cycle, therefore, it may be regarded as a promising candidate for MH-THS.
3.3. Rehydration kinetics
The rehydration kinetic curves (Fig. 4) may be divided into two parts. Jump of the water vapour pressure at t = 0 results in a sharp rise of the sample weight. It takes 5–10 s and corresponds to approximately 20% of the total weight change mH2O. Further weight evolution lasts 100–200 min. In ref. 35, the authors observed alike behaviour for MgO and conjectured that the fast process may be related to water adsorption on the oxide surface and the following chemical hydration. In our case, the similar effect is observed. The adsorption is followed by rapid rehydration of an oxide layer adjacent to the external surface of CaO particles. The thickness of this layer L can be roughly estimated from the following equation under stipulation of spherical particle shape
 | (4) |
 is the relation of molar volumes, r0 is the radius of initial particles determined from the BET analysis (see 3.4.). Numerical solution of eqn (4) gives L = 0.8 nm. This product layer creates a diffusion barrier for water molecules, thus slowing down the rehydration at t > 10 s.
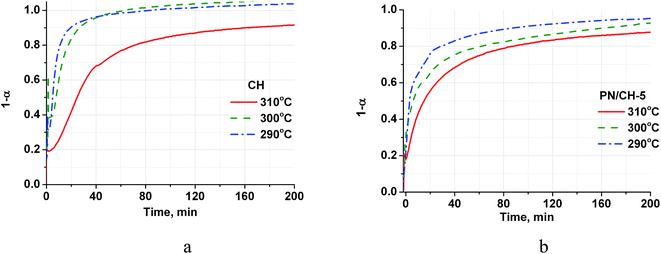 | ||
| Fig. 4 Isothermal kinetic curves of the CH (a) and PN/CH-5 (b) rehydration at different temperatures and P = 23 mbar. | ||
The rehydration rate is strongly affected by the reaction temperature and this dependence is quite unusual because the rate decreases with the temperature increase (Fig. 4). Indeed, at a constant P(H2O) of 23 mbar, the temperature rise from 290 °C to 310 °C leads to the reduction of the half-conversion time by a factor of 5 (Table 3). At a constant P(H2O) of 23 mbar, the equilibrium dehydration temperature is equal to 368 °C, therefore the temperature rise from 290 °C to 310 °C reduces the difference between the real and equilibrium temperatures and, hence, the driving force for dehydration.36
| P(H2O), mbar | Temperature, °C | CH | PN/CH-5 |
|---|---|---|---|
| 23 | 290 | 5 | 3 |
| 23 | 300 | 8 | 5 |
| 23 | 310 | 25 | 15 |
| 32 | 330 | 125 | 104 |
| 43 | 330 | 7 | 10 |
| 128 | 360 | 3 | 3 |
The vapour pressure strongly affects the rehydration rate as well (Fig. 5). The half-conversion time decreases by a factor of 10–17 when the pressure increases only from 32 to 43 mbar which formally gives the dependence τ ∼ P−8. Thus, the rehydration rate increases at higher vapour pressure which can be easily controlled by a proper choice of the evaporator temperature Te. For instance, the vapour pressures mentioned above correspond to Te equal 25 and 30 °C, respectively. Hence, the ambient heat can be used to directly generate water vapour for fast rehydration reaction. This results in a maximal temperature lift of (265–285)°C which could be used for upgrading the ambient heat up to the middle temperature level.
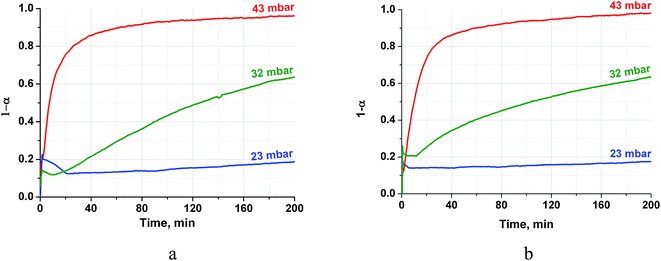 | ||
| Fig. 5 Isobaric kinetic curves of the CH (a) and PN/CH-5 (b) rehydration at T = 330 °C and different pressures. | ||
Thus, the heat stored from an external source at T > 380 °C (i.e. solar concentrator) can be returned at around 300 °C by supplying heat at the temperature of the environment. The returned heat, even if at the lower temperature, still has commercial value and may be further used for various purposes such as steam generation, organic Rankine cycles, etc.
It is worth mentioning that the rehydration rate is less sensitive to the salt presence than the dehydration one. For the doped hydroxide, the rate is somewhat larger at low conversions and smaller at high conversions (see Fig. 4–6 and Table 3). At high P(H2O) = 128 mbar, the kinetic curves coincide at α < 0.55 (Fig. 5). At α > 0.55, the doped hydroxide is rehydrated slightly faster. The enlargement of CaO particles can be responsible for lower rehydration rate at high conversions, since the thickness of the product layer becomes larger (see 3.4). In any case, the rehydration rate is high enough and can be further enhanced by even small increasing the vapour pressure.
3.4. BET analysis of N2 adsorption isotherms
The initial CH has a specific surface area S of (15.1 ± 0.2) m2 g−1 (Table 4). Evaluation of the particle radius
 | (5) |
| Sample | BET surface area, m2 g−1 | Particle radius, nm |
|---|---|---|
| CH | 15.1 ± 0.2 | 22 |
| PN/CH-5 | 12.8 ± 0.1 | 26 |
| CaO | 29.5 ± 0.5 | 8 |
| PN/CaO | 7.3 ± 0.1 | 31 |
The modification of calcium hydroxide with KNO3 slightly reduces its specific surface area (Table 4) probably due to the coating of Ca(OH)2 particles by the salt and partial blocking of its surface. The specific surface area of PN/CaO is 4 folds lower as compared with CaO obtained from CH, hence, the KNO3 addition to CH results in coarser CaO particles.
3.5. Infrared spectroscopy
Infrared spectra of CH and PN/CH-5 exhibit a narrow band at 3642 cm−1 corresponding to O-H vibrations as well as bands at 543, 393 and 307 cm−1 attributed to lattice vibrations of Ca(OH)2. In addition, the material PN/CH-5 exhibits bands related to vibrations of nitrate in KNO3, namely, 1360 (ν3), 1049 (ν1) and 831 (ν4) cm−1. Bands at 1472, 1423, 1116, 1080 and 873 cm−1 of low intensity in PN/CH-5 suggest the presence of carbonate-ions in minor quantities (Fig. 7).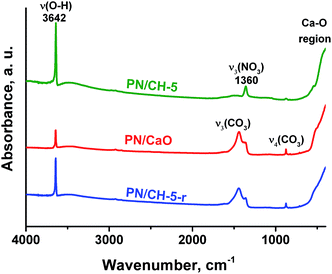 | ||
| Fig. 7 IR-spectra of PN/CH-5 and products of its de- and rehydration recorded in the range 4000–200 cm−1. | ||
Vibrations of nitrate-ion in PN/CH-5 undergo appreciable changes during the material de- and rehydration. The band ν3 (E′) at 1360 cm−1 corresponding to the twice degenerated vibration of nitrate-ion splits into two bands at 1380 and 1362 cm−1 after calcination (Fig. 8a). The band ν4 at 830 cm−1 also splits, and the band ν1 at 1049 cm−1 disappears (Fig. 8b). These observations show that potassium nitrate does not preserve its crystalline structure after dehydration and the symmetry of nitrate-ion lowers. The rehydration leads to partial restore of the initial bands, however, band ν1 at 1049 cm−1 does not restore at all. This band is active in KNO3 with the aragonite structure, thus, the rehydration does not lead to a complete restoration of the initial KNO3. We suppose that the band splitting during dehydration may be a manifestation of a chemical interaction between the nitrate and the hydroxide as discussed in 4.3.
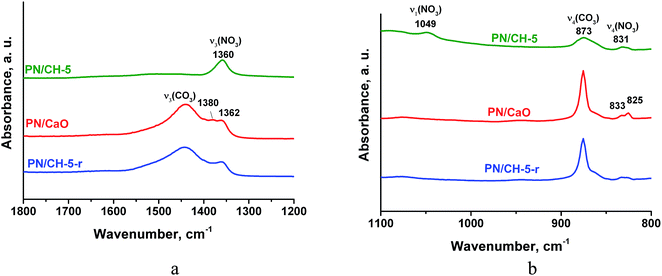 | ||
| Fig. 8 IR-spectra of PN/CH-5 and products of its de- and rehydration in a narrow range of 1800–800 cm−1 for illustration of the nitrate state changes. | ||
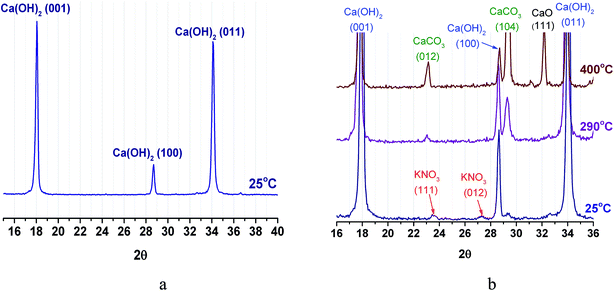
3.6. Powder X-ray diffraction analysis
Powder XRD pattern of CH at room temperature exhibits reflexes of merely portlandite (Ca(OH)2) phase (Fig. 9a). For PN/CH-5 at 25 °C, reflexes of low intensity from α-KNO3 phase are detected (Fig. 9b).At 290 °C, the peaks of KNO3 vanish. This may indicate a loss of the KNO3 crystalline structure already at T = 290 °C, i.e. at temperature which is much lower than the melting point of pure KNO3 (334 °C (ref. 32)). This effect resembles the disappearance of NaNO3 reflexes observed on heating of NaNO3/Mg(OH)2.22 Therefore, we assume that for the KNO3/Ca(OH)2 case this effect may be likewise caused by the nitrate–hydroxide interaction which may lead to the PN/CH-5 dehydration at the lower temperature (see 4.3). At 400 °C, the dehydration proceeds and reflexes of lime (CaO) appear. Reflexes of calcite (CaCO3), initially absent, appear at 290 °C, probably, due to the interaction of Ca(OH)2 with CO2 from air directly inside the XRD measurement chamber.
The strong interaction of Ca(OH)2 and CaO with CO2 resulting in the formation of CaCO3 is well-known and widely used for removal of CO2 from air and other gases in industry.38 This carbonate is more stable than Ca(OH)2 as its decarbonation temperature is above 800 °C. Therefore, reaction (1) can be used for MT-THS only in CO2-free conditions, i.e. in closed systems containing only water vapour in the gas phase.19 We have maintained such conditions in the majority of experiments performed in this study. As a result, the data obtained on the effect of KNO3 additive on the Ca(OH)2 dehydration and rehydration are reproducible.
4. Discussion
4.1. Estimation of the specific power of heat storage and release
The specific power W [kW kg−1] of heat storing/releasing process is an important parameter that defines a size of THS unit. It can be evaluated as
 | (6) |
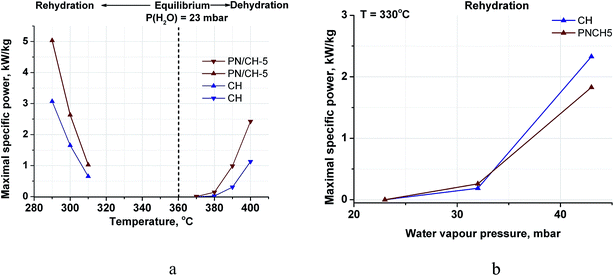 | ||
| Fig. 10 Maximal specific power of de-/rehydration of CH and PN/CH-5 at various temperatures (a) and pressures (b). | ||
Hence, the doped Ca(OH)2 can transform (store or release) more heat (in a unit time) in less unit volume, which makes an excellent base for creating compact MT-THS units. Indeed, a reactor containing 1 dm3 Ca(OH)2 can ensure more than 4 kW power during the heat generation stage.
4.2. Contribution of the surface energy
The maximal specific power for both de- and rehydration dramatically lowers to almost zero as the system approaches the equilibrium (Fig. 10a). Therefore, an appreciable difference between the actual process temperature and the equilibrium one is necessary to drive the process. The equilibrium temperature of reaction (1) is estimated above considering the thermodynamic data for the bulk hydroxide and oxide tabulated in ref. 39. The equilibrium reaction temperature is defined as an intersection of lines ΔfGopro(T) and ΔfGorea(T) that are the temperature dependencies of the free formation energy of the products and reagents, respectively. For bulk Ca(OH)2 and CaO, this equilibrium is schematically represented by bold lines on Fig. 11 with the intersection at point A (the bulk equilibrium). For disperse calcium hydroxide and oxide, appropriate contributions of their surface energies, ΔsGopro and ΔsGorea, may affect the equilibrium. If ΔsGopro > ΔsGorea (the case shown on Fig. 11 by dashed lines), the intersection should shift to a higher temperature (point B) that agrees with our experimental data on the dehydration of the pure Ca(OH)2.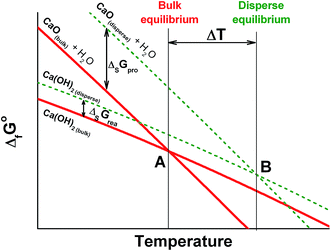 | ||
| Fig. 11 Schematic illustration of the surface energy contribution and its effect on to the equilibrium temperature of reaction (1) for the bulk (A) and disperse (B) phases. | ||
The surface area of the dehydration product PN/CaO is 4 times lower as compared to pure CaO (see 3.4.). This effect diminishes the contribution of the oxide surface energy to the total free energy of products, thus, making the dehydration more favourable from the thermodynamic point of view and shifting point B on Fig. 11 to a lower temperature for the KNO3-doped materials. This gives a thermodynamic explanation of the observed reduction of the Ca(OH)2 dehydration temperature.
4.3. KNO3–Ca(OH)2 interaction
Thus, the doping of Ca(OH)2 with KNO3 leads to lowering of the dehydration temperature and accelerates its dehydration. The following observations are made upon examination of the effect:(a) DSC signals of the doped KNO3 melting are absent at low salt contents;
(b) surface area of the salt-doped dehydration product is lower as compared with the non-doped CaO;
(c) X-ray diffraction peaks of KNO3 vanish at 290 °C that is 44 °C lower than the KNO3 melting point;
(d) IR bands of nitrate vibrations split after calcination which may indicate the NO3 symmetry lowering.
These effects can be considered as an indication of an interaction between the nitrate and the hydroxide. Alike effects were found for NaNO3/Mg(OH)2 in ref. 22 and were ascribed to the salt-hydroxide chemical interaction.
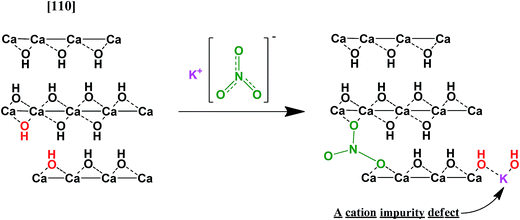
A hypothetical mechanism of the interaction is an embedding of nitrate-ions into the brucite-like lattice of Ca(OH)2 occurring in a surface-adjacent layer (Fig. 12). Indeed, such process would lead to a collapse of the KNO3 structure and lowering of the nitrate symmetry. Moreover, it can create additional structural imperfections which could facilitate nucleation during dehydration at lower temperatures.30 These defects can also lead to lowering the surface area of the resulting CaO due to alleviating mechanical strains which relax during the dehydration due to cracking CaO particles off the reaction front thus increasing the specific surface area of the product. This alleviation can result in less fracturing and larger CaO particles as compared with dehydration of the pure Ca(OH)2.
5. Conclusions
This paper is aimed at the synthesis and study of KNO3-doped Ca(OH)2 keeping in mind opportunity to use this material for storage of concentrated solar heat. The doping of Ca(OH)2 by KNO3 results in a significant acceleration of the dehydration as well as in the reduction of the dehydration temperature as compared with the pure hydroxide. This reduction is a function of the salt content and, thus, can be intentionally managed. The dehydration temperature reaches a minimum for the material KNO3/Ca(OH)2 with 5 wt% of the salt (ΔT = 35 °C). The dehydration heat is reduced only by 7% when KNO3 is added (1280 J g−1) and remains promising for heat storage.The material KNO3(5 wt%)/Ca(OH)2 shows higher dehydration rate at T = 370–400 °C as compared with the pure calcium hydroxide under the conditions typical for a closed THS cycle for storing CSP. The rehydration rate is less sensitive to the salt presence than the dehydration one. For the doped hydroxide, the rate is somewhat larger at low conversions and smaller at high conversions. The cycle dynamic analysis shows that the doped Ca(OH)2 can store or release more heat (in a unit time) in the same volume, than the pure Ca(OH)2. This creates a robust basis for designing compact and efficient units for storage of concentrated solar heat.
The KNO3 addition dramatically lowers the surface area of the dehydration product (CaO). This reduces the contribution of the oxide surface energy to the total free energy of products and makes the dehydration more thermodynamically profitable. This effect may contribute to the observed depression of the dehydration temperature.
Complementary physical methods provide an indication of an interaction between the nitrate and the hydroxide, which is responsible for the observed effects. A possible mechanism of this interaction can be an embedding of nitrate-ions into the brucite-like lattice that may facilitate a nucleation stage and accelerate the dehydration reaction.
Thus, the modification of Ca(OH)2 with potassium nitrate appears to provide a valuable opportunity to enhance the dehydration rate at T < 400 °C as well as to vary the product texture. The reported material KNO3/Ca(OH)2 exhibits a large heat storage density and adjustable reaction temperature and may be considered as a promising new candidate for storage of concentrated solar heat. In a broader sense, the approach of modification by salts can be applied for improving the kinetics and thermodynamics of decomposition of other materials interesting for storage of concentrated solar heat, such as carbonates.
Conflicts of interest
There are no conflicts to declare.Acknowledgements
The authors gratefully acknowledge the contribution from Dr T. A. Krieger on measuring X-ray diffraction patterns and Dr Yu. A. Chesalov on recording IR-spectra. This work was conducted within the framework of budget project No. 0303-2016-0013 of the Boreskov Institute of Catalysis. One of the authors (A. Shkatulov) thanks the Russian Foundation for Basic Researches (project 16-38-00503) for partial financial support.Notes and references
- L. F. Cabeza, A. Solé, X. Fontanet, C. Barreneche, A. Jové, M. Gallas, C. Prieto and A. I. Fernández, Appl. Energy, 2017, 185, 836–845 CrossRef CAS.
- Y. Tian and C. Y. Zhao, Appl. Energy, 2013, 104, 538–553 CrossRef CAS.
- D. Goswami, Principles of Solar Engineering, CRC Press, New York, 2015 Search PubMed.
- M. Medrano, A. Gil, I. Martorell, X. Potau and L. F. Cabeza, Renewable Sustainable Energy Rev., 2012, 14, 56–72 CrossRef.
- F. J. Ruiz-Cabañas, A. Jové, C. Prieto, V. Madina, A. I. Fernández and L. F. Cabeza, Sol. Energy Mater. Sol. Cells, 2017, 159, 526–535 CrossRef.
- D. Zhou and P. Eames, Sol. Energy Mater. Sol. Cells, 2016, 157, 1019–1025 CrossRef CAS.
- G. García-Martín, M. I. Lasanta, V. Encinas-Sánchez, M. T. de Miguel and F. J. Pérez, Sol. Energy Mater. Sol. Cells, 2017, 161, 226–231 CrossRef.
- M. Liu, W. Saman and F. Bruno, Renewable Sustainable Energy Rev., 2012, 16, 2118–2132 CrossRef CAS.
- L. André, S. Abanades and G. Flamant, Renewable Sustainable Energy Rev., 2016, 64, 703–715 CrossRef.
- A. Jabbari-Hichri, S. Bennici and A. Auroux, Sol. Energy Mater. Sol. Cells, 2015, 140, 351–360 CrossRef CAS.
- K. M. Lovegrove, A. Luzzi, I. Soldiani and H. Kreetz, Sol. Energy, 2004, 76, 331–337 CrossRef CAS.
- S. M. Ranade, M.-C. Lee and W. Prengle, Sol. Energy, 1986, 37, 375–388 CrossRef CAS.
- M. Felderhoff and B. Bogdanović, Int. J. Mol. Sci., 2009, 10, 325–344 CrossRef CAS PubMed.
- Y. I. Aristov, V. N. Parmon, G. Cacciola and N. Giordano, Int. J. Energy Res., 1993, 17, 293–303 CrossRef CAS.
- Y. A. Criado, M. Alonso, J. C. Abanades and Z. Anxionnaz-Minvielle, Appl. Therm. Eng., 2014, 73, 1085–1092 CrossRef.
- F. Schaube, L. Koch, A. Wörner and H. Müller-Steinhagen, Thermochim. Acta, 2012, 538, 9–20 CrossRef CAS.
- F. Schaube, A. Wörner and R. Tamme, Trans. ASME: J. Sol. Energy Eng., 2011, 133, 031006 CrossRef.
- H. Ogura, T. Yamamoto and H. Kage, Energy, 2003, 28, 1479–1493 CrossRef CAS.
- M. N. Azpiazu, J. M. Morquillas and A. Vasquez, Appl. Therm. Eng., 2003, 23, 733–741 CrossRef CAS.
- E. Halstead and A. Moore, J. Chem. Soc., 1957, 3873–3875 RSC.
- A. I. Shkatulov and Y. I. Aristov, Energy, 2015, 85, 667–676 CrossRef CAS.
- A. I. Shkatulov, T. A. Krieger, V. I. Zaikovskii, Y. A. Chesalov and Y. I. Aristov, ACS Appl. Mater. Interfaces, 2014, 6, 19966–19977 CAS.
- A. Kanzawa and Y. Arai, Sol. Energy, 1981, 27, 289–294 CrossRef CAS.
- J. Kariya, J. Ryu and Y. Kato, ISIJ Int., 2015, 55, 457–463 CrossRef CAS.
- C. Roßkopf, S. Afflerbach, M. Schmidt, B. Görtz, T. Kowald, M. Linder and R. Trettin, Energy Convers. Manage., 2015, 97, 94–102 CrossRef.
- J. Kariya, J. Ryu and Y. Kato, Appl. Therm. Eng., 2016, 94, 186–192 CrossRef CAS.
- Y. A. Criado, M. Alonso and J. C. Abanades, Sol. Energy, 2016, 135, 800–809 CrossRef CAS.
- M. S. Murthy, P. Raghavendrachar and S. V. Sriram, Sol. Energy, 1986, 36, 53–62 CrossRef CAS.
- J. Yan and C. Y. Zhao, Chem. Eng. Sci., 2014, 117, 293–300 CrossRef CAS.
- J. Yan and C. Y. Zhao, Chem. Eng. Sci., 2015, 138, 86–92 CrossRef CAS.
- T. Kito and N. Kobayashi, Kagaku Kogaku Ronbunshu, 2012, 38, 172–175 CrossRef CAS.
- CRC Handbook of chemistry and physics, ed. D. R. Lide, 90th edn, 2010, pp. 4–83 Search PubMed.
- A. K. Galwey and M. E. Brown, Thermal decomposition of ionic solids, Elsevier, 1999, p. 106 Search PubMed.
- NIST-JANAF Thermochemical tables, ed. M. W. Chase, Woodbury, New York, 4th edn, part I, Al-Co, 1998 Search PubMed.
- Y. Kato, Y. Sasaki and Y. Yoshizawa, Energy, 2005, 30, 2144–2155 CrossRef CAS.
- G. Lebon, D. Jou and J. Casas-Vázquez, Understanding Non-equilibrium Thermodynamics: Foundations, Applications, Frontiers, Springer-Verlag, Berlin, 2008, p. 92 Search PubMed.
- M. Hartman, O. Trnka, K. Svoboda and J. Kocurek, Chem. Eng. Sci., 1994, 49, 1209–1216 CrossRef CAS.
- J. M. Valverde, J. Mater. Chem. A, 2013, 1, 447–468 CAS.
- I. Barin, Thermochemical Data of Pure Substances, Weinheim, New York, 1989 Search PubMed.
| This journal is © The Royal Society of Chemistry 2017 |

